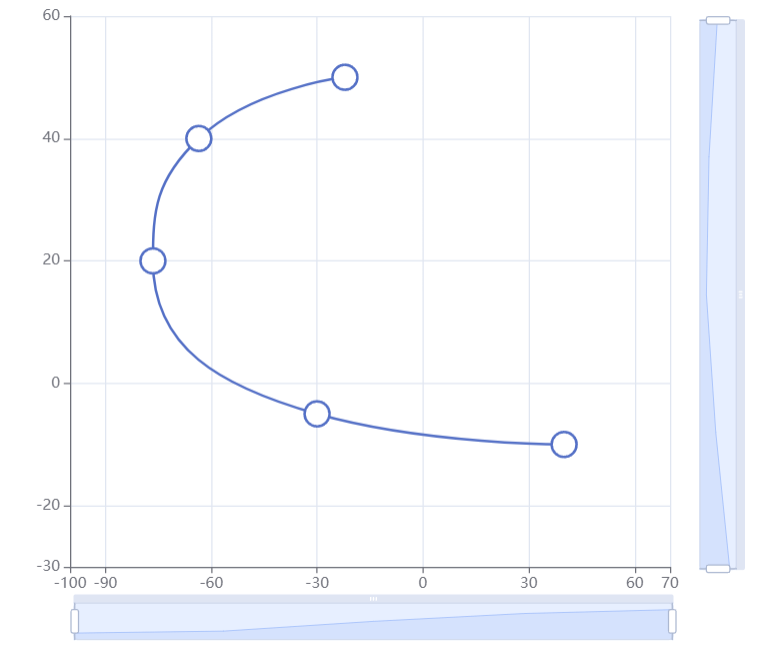
拖拽
<!--
	此示例下载自 https://echarts.apache.org/examples/zh/editor.html?c=line-draggable&version=5.1.2
-->
<!DOCTYPE html>
<html lang="en" style="height: 100%">
<head>
  <meta charset="utf-8">
</head>
<body style="height: 100%; margin: 0">
  <div id="container" style="width: 600px;height: 550px"></div>


  <script type="text/javascript" src="https://registry.npmmirror.com/echarts/5.1.2/files/dist/echarts.min.js"></script>
  <!-- Uncomment this line if you want to dataTool extension
  <script type="text/javascript" src="https://registry.npmmirror.com/echarts/5.1.2/files/dist/extension/dataTool.min.js"></script>
  -->
  <!-- Uncomment this line if you want to use gl extension
  <script type="text/javascript" src="https://registry.npmmirror.com/echarts-gl/2/files/dist/echarts-gl.min.js"></script>
  -->
  <!-- Uncomment this line if you want to echarts-stat extension
  <script type="text/javascript" src="https://registry.npmmirror.com/echarts-stat/latest/files/dist/ecStat.min.js"></script>
  -->
  <!-- Uncomment this line if you want to use map
  <script type="text/javascript" src="https://registry.npmmirror.com/echarts/4.9.0/files/map/js/china.js"></script>
  <script type="text/javascript" src="https://registry.npmmirror.com/echarts/4.9.0/files/map/js/world.js"></script>
  -->
  <!-- Uncomment these two lines if you want to use bmap extension
  <script type="text/javascript" src="https://api.map.baidu.com/api?v=3.0&ak=YOUR_API_KEY"></script>
  <script type="text/javascript" src="https://registry.npmmirror.com/echarts/5.1.2/files/dist/extension/bmap.min.js"></script>
  -->

  <script type="text/javascript">
    var dom = document.getElementById('container');
    var myChart = echarts.init(dom, null, {
      renderer: 'canvas',
      useDirtyRect: false
    });
    var app = {};

    var option;

    const symbolSize = 20;
const data = [
  [40, -10],
  [-30, -5],
  [-76.5, 20],
  [-63.5, 40],
  [-22.1, 50]
];
option = {
  title: {
    text: 'Try Dragging these Points',
    left: 'center'
  },
  tooltip: {
    triggerOn: 'none',
    formatter: function (params) {
      return (
        'X: ' +
        params.data[0].toFixed(2) +
        '<br>Y: ' +
        params.data[1].toFixed(2)
      );
    }
  },
  grid: {
    top: '8%',
    bottom: '12%'
  },
  xAxis: {
    min: -100,
    max: 70,
    type: 'value',
    axisLine: { onZero: false }
  },
  yAxis: {
    min: -30,
    max: 60,
    type: 'value',
    axisLine: { onZero: false }
  },
  dataZoom: [
    {
      type: 'slider',
      xAxisIndex: 0,
      filterMode: 'none'
    },
    {
      type: 'slider',
      yAxisIndex: 0,
      filterMode: 'none'
    },
    {
      type: 'inside',
      xAxisIndex: 0,
      filterMode: 'none'
    },
    {
      type: 'inside',
      yAxisIndex: 0,
      filterMode: 'none'
    }
  ],
  series: [
    {
      id: 'a',
      type: 'line',
      smooth: true,
      symbolSize: symbolSize,
      data: data
    }
  ]
};
setTimeout(function () {
  // Add shadow circles (which is not visible) to enable drag.
  myChart.setOption({
    graphic: data.map(function (item, dataIndex) {
      return {
        type: 'circle',
        position: myChart.convertToPixel('grid', item),
        shape: {
          cx: 0,
          cy: 0,
          r: symbolSize / 2
        },
        invisible: true,
        draggable: true,
        ondrag: function (dx, dy) {
          onPointDragging(dataIndex, [this.x, this.y]);
        },
        onmousemove: function () {
          showTooltip(dataIndex);
        },
        onmouseout: function () {
          hideTooltip(dataIndex);
        },
        z: 100
      };
    })
  });
}, 0);
window.addEventListener('resize', updatePosition);
myChart.on('dataZoom', updatePosition);
function updatePosition() {
  myChart.setOption({
    graphic: data.map(function (item, dataIndex) {
      return {
        position: myChart.convertToPixel('grid', item)
      };
    })
  });
}
function showTooltip(dataIndex) {
  myChart.dispatchAction({
    type: 'showTip',
    seriesIndex: 0,
    dataIndex: dataIndex
  });
}
function hideTooltip(dataIndex) {
  myChart.dispatchAction({
    type: 'hideTip'
  });
}
function onPointDragging(dataIndex, pos) {
  data[dataIndex] = myChart.convertFromPixel('grid', pos);
  // Update data
  myChart.setOption({
    series: [
      {
        id: 'a',
        data: data
      }
    ]
  });
}

    if (option && typeof option === 'object') {
      myChart.setOption(option);
    }

    window.addEventListener('resize', myChart.resize);
  </script>
</body>
</html>
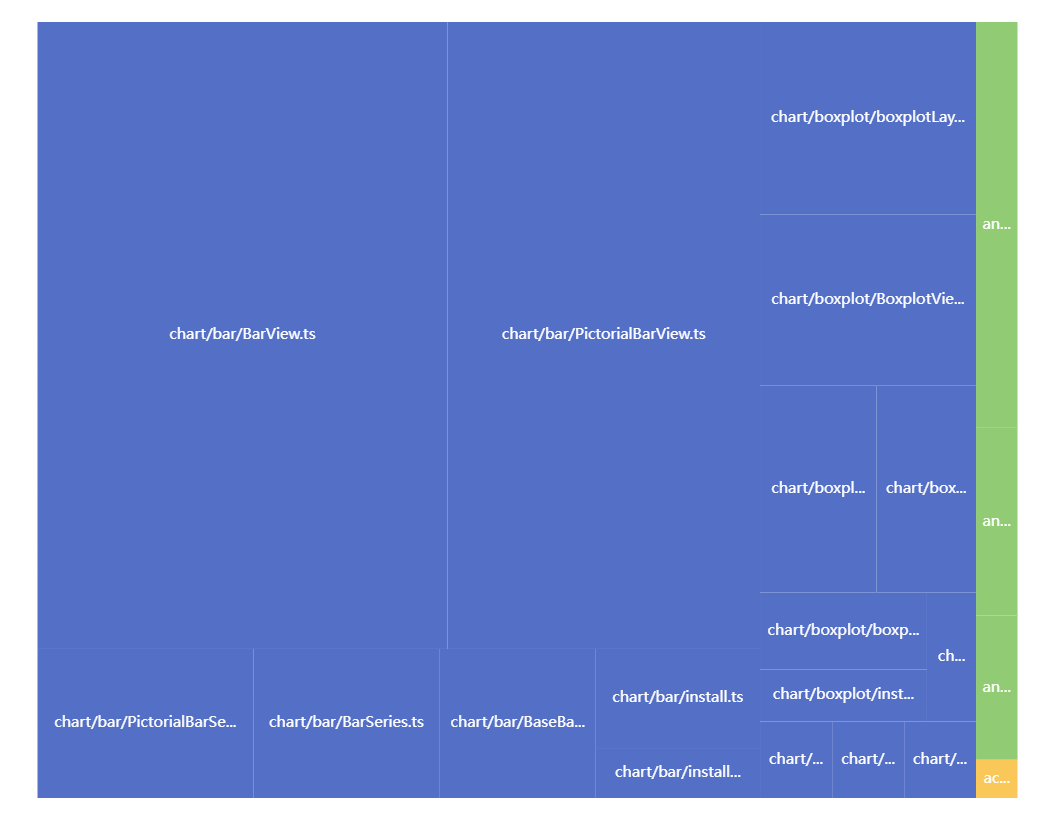
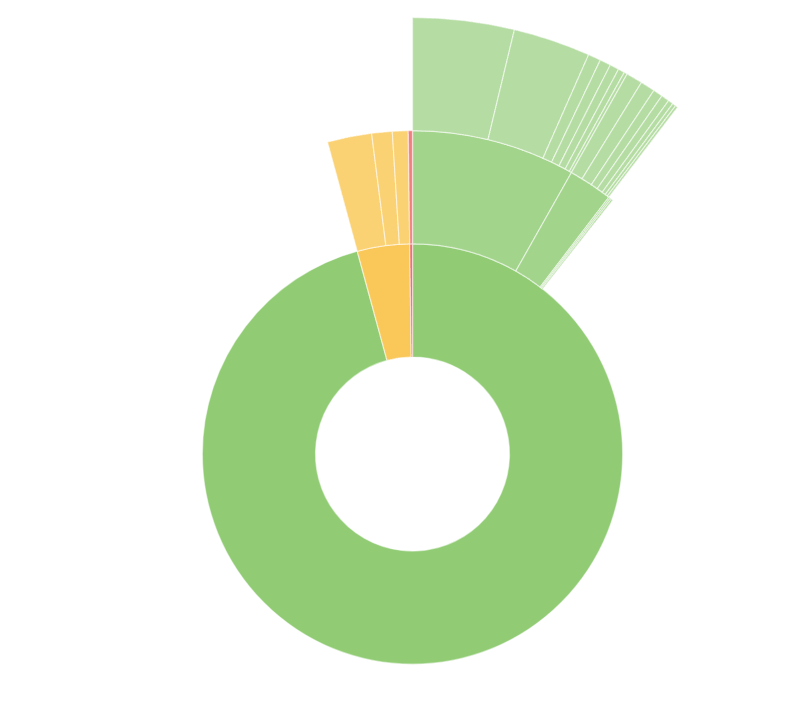
- 效果图
过渡
- 参考
- treemap-sunburst-transition.html代码如下
<!--
	此示例下载自 https://echarts.apache.org/examples/zh/editor.html?c=treemap-sunburst-transition&version=5.4.3
-->
<!DOCTYPE html>
<html lang="en" style="height: 100%">
<head>
  <meta charset="utf-8">
</head>
<body style="height: 100%; margin: 0">
  <div id="container" style="height: 100%"></div>

  <script type="text/javascript" src="https://cdn.staticfile.org/jquery/3.7.1/jquery.min.js"></script>
  <script type="text/javascript" src="https://registry.npmmirror.com/echarts/5.4.3/files/dist/echarts.min.js"></script>
  <!-- Uncomment this line if you want to dataTool extension
  <script type="text/javascript" src="https://registry.npmmirror.com/echarts/5.4.3/files/dist/extension/dataTool.min.js"></script>
  -->
  <!-- Uncomment this line if you want to use gl extension
  <script type="text/javascript" src="https://registry.npmmirror.com/echarts-gl/2/files/dist/echarts-gl.min.js"></script>
  -->
  <!-- Uncomment this line if you want to echarts-stat extension
  <script type="text/javascript" src="https://registry.npmmirror.com/echarts-stat/latest/files/dist/ecStat.min.js"></script>
  -->
  <!-- Uncomment this line if you want to use map
  <script type="text/javascript" src="https://registry.npmmirror.com/echarts/4.9.0/files/map/js/china.js"></script>
  <script type="text/javascript" src="https://registry.npmmirror.com/echarts/4.9.0/files/map/js/world.js"></script>
  -->
  <!-- Uncomment these two lines if you want to use bmap extension
  <script type="text/javascript" src="https://api.map.baidu.com/api?v=3.0&ak=YOUR_API_KEY"></script>
  <script type="text/javascript" src="https://registry.npmmirror.com/echarts/5.4.3/files/dist/extension/bmap.min.js"></script>
  -->

  <script type="text/javascript">
    var dom = document.getElementById('container');
    var myChart = echarts.init(dom, null, {
      renderer: 'canvas',
      useDirtyRect: false
    });
    var app = {};
    // var ROOT_PATH = 'https://echarts.apache.org/examples';
    var option;

    $.getJSON(
  // ROOT_PATH + '/data/asset/data/echarts-package-size.json',
  'echarts-package-size.json',
  function (data) {
    console.log(data);
    const treemapOption = {
      series: [
        {
          type: 'treemap',
          id: 'echarts-package-size',
          animationDurationUpdate: 1000,
          roam: false,
          nodeClick: undefined,
          data: data.children,
          universalTransition: true,
          label: {
            show: true
          },
          breadcrumb: {
            show: false
          }
        }
      ]
    };
    const sunburstOption = {
      series: [
        {
          type: 'sunburst',
          id: 'echarts-package-size',
          radius: ['20%', '90%'],
          animationDurationUpdate: 1000,
          nodeClick: undefined,
          data: data.children,
          universalTransition: true,
          itemStyle: {
            borderWidth: 1,
            borderColor: 'rgba(255,255,255,.5)'
          },
          label: {
            show: false
          }
        }
      ]
    };
    let currentOption = treemapOption;
    myChart.setOption(currentOption);
    setInterval(function () {
      currentOption =
        currentOption === treemapOption ? sunburstOption : treemapOption;
      myChart.setOption(currentOption);
    }, 3000);
  }
);

    if (option && typeof option === 'object') {
      myChart.setOption(option);
    }

    window.addEventListener('resize', myChart.resize);
  </script>
</body>
</html>
点击查看代码
{
  "name": "echarts",
  "size": 3835461,
  "children": [
    {
      "name": "action",
      "size": 2307,
      "children": [
        {
          "name": "action/roamHelper.ts",
          "size": 2307,
          "value": 2307
        }
      ],
      "value": 2307
    },
    {
      "name": "animation",
      "size": 44515,
      "children": [
        {
          "name": "animation/basicTrasition.ts",
          "size": 11322,
          "value": 11322
        },
        {
          "name": "animation/morphTransitionHelper.ts",
          "size": 8706,
          "value": 8706
        },
        {
          "name": "animation/universalTransition.ts",
          "size": 24487,
          "value": 24487
        }
      ],
      "value": 44515
    },
    {
      "name": "chart",
      "size": 1059597,
      "children": [
        {
          "name": "chart/bar",
          "size": 90538,
          "children": [
            {
              "name": "chart/bar/BarSeries.ts",
              "size": 4489,
              "value": 4489
            },
            {
              "name": "chart/bar/BarView.ts",
              "size": 41509,
              "value": 41509
            },
            {
              "name": "chart/bar/BaseBarSeries.ts",
              "size": 3754,
              "value": 3754
            },
            {
              "name": "chart/bar/PictorialBarSeries.ts",
              "size": 5194,
              "value": 5194
            },
            {
              "name": "chart/bar/PictorialBarView.ts",
              "size": 31640,
              "value": 31640
            },
            {
              "name": "chart/bar/install.ts",
              "size": 2627,
              "value": 2627
            },
            {
              "name": "chart/bar/installPictorialBar.ts",
              "size": 1325,
              "value": 1325
            }
          ],
          "value": 90538
        },
        {
          "name": "chart/bar.ts",
          "size": 885,
          "value": 885
        },
        {
          "name": "chart/boxplot",
          "size": 24408,
          "children": [
            {
              "name": "chart/boxplot/BoxplotSeries.ts",
              "size": 3891,
              "value": 3891
            },
            {
              "name": "chart/boxplot/BoxplotView.ts",
              "size": 5968,
              "value": 5968
            },
            {
              "name": "chart/boxplot/boxplotLayout.ts",
              "size": 6718,
              "value": 6718
            },
            {
              "name": "chart/boxplot/boxplotTransform.ts",
              "size": 2073,
              "value": 2073
            },
            {
              "name": "chart/boxplot/boxplotVisual.ts",
              "size": 1024,
              "value": 1024
            },
            {
              "name": "chart/boxplot/install.ts",
              "size": 1411,
              "value": 1411
            },
            {
              "name": "chart/boxplot/prepareBoxplotData.ts",
              "size": 3323,
              "value": 3323
            }
          ],
          "value": 24408
        },
        {
          "name": "chart/boxplot.ts",
          "size": 889,
          "value": 889
        },
        {
          "name": "chart/treemap.ts",
          "size": 887,
          "value": 887
        }
      ],
      "value": 1059597
    }
  ],
  "value": 3835461
}
- 效果图

 浙公网安备 33010602011771号