案例1
| <!DOCTYPE html> |
| <html> |
| <head> |
| <link rel="stylesheet" href="https://cdn.jsdelivr.net/chartist.js/latest/chartist.min.css"> |
| <script src="https://cdn.jsdelivr.net/chartist.js/latest/chartist.min.js"></script> |
| </head> |
| <body> |
| <div class="ct-chart ct-perfect-fourth" style="width: 400px;height: 350px;"></div> |
| <script> |
| var data = { |
| |
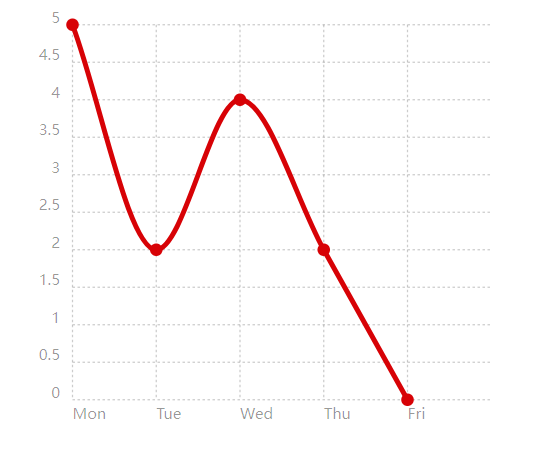
| labels: ['Mon', 'Tue', 'Wed', 'Thu', 'Fri'], |
| |
| series: [ |
| [5, 2, 4, 2, 0] |
| ] |
| }; |
| |
| |
| |
| |
| new Chartist.Line('.ct-chart', data); |
| </script> |
| </body> |
| </html> |
- 效果图

案例2
| <!DOCTYPE html> |
| <html> |
| <head> |
| <link rel="stylesheet" href="./chartist.min.css"> |
| <script src="./chartist.min.js"></script> |
| </head> |
| <body> |
| <div class="ct-chart ct-perfect-fourth" style="width: 500px;height: 350px;"></div> |
| <script> |
| new Chartist.Line('.ct-chart', { |
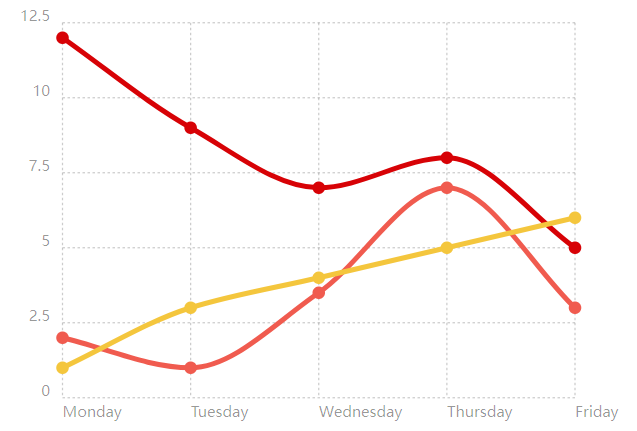
| labels: ['Monday', 'Tuesday', 'Wednesday', 'Thursday', 'Friday'], |
| series: [ |
| [12, 9, 7, 8, 5], |
| [2, 1, 3.5, 7, 3], |
| [1, 3, 4, 5, 6] |
| ] |
| }, { |
| fullWidth: true, |
| chartPadding: { |
| right: 40 |
| } |
| }); |
| </script> |
| </body> |
| </html> |
- 效果图


【推荐】国内首个AI IDE,深度理解中文开发场景,立即下载体验Trae
【推荐】编程新体验,更懂你的AI,立即体验豆包MarsCode编程助手
【推荐】抖音旗下AI助手豆包,你的智能百科全书,全免费不限次数
【推荐】轻量又高性能的 SSH 工具 IShell:AI 加持,快人一步
· TypeScript + Deepseek 打造卜卦网站:技术与玄学的结合
· 阿里巴巴 QwQ-32B真的超越了 DeepSeek R-1吗?
· 【译】Visual Studio 中新的强大生产力特性
· 【设计模式】告别冗长if-else语句:使用策略模式优化代码结构
· AI与.NET技术实操系列(六):基于图像分类模型对图像进行分类