案例1
import akshare as ak
import pandas as pd
import numpy as np
import os
"""
获取A股所有股票的代码
使用stock_info_a_code_name(),反馈数据格式详细参见akshare官网
"""
StockList=ak.stock_info_a_code_name()
#StockList返回的股票代码是“000001”,“000002”这样的格式
#但是stock_zh_a_daily()函数中,要求代码的格式为“sz000001”,或“sh600001”
#即必须有sz或者sh作为前序
#因此,通过for循环对股票代码code进行格式变换
for i in range(0,len(StockList)):
temp=StockList.iloc[i,0]
if temp[0]=="6":
temp="sh"+temp
if temp[0]=="0":
temp="sz"+temp
if temp[0]=="3":
temp="sz"+temp
StockList.iloc[i,0]=temp
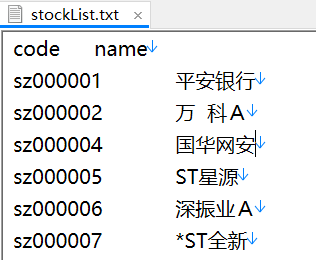
#通过txt形式保存数据,先检测是否存在文件。
#若存在,则在更新股票列表时,先将原有文件删除,再重建文件。
if os.path.exists("C://work//todo//stockList.txt"):
os.remove("C://work//todo//stockList.txt")
StockList.to_csv("C://work//todo//stockList.txt",sep="\t",index=False,header=True)
#将原有表格删除后,更新原有数据
"""
下一步,根据原有的股票代码数据,读取历史数据
"stock_zh_a_hist" # A 股日频率数据-东方财富
"stock_zh_ah_daily" # 获取 A+H 股历史行情数据(日频)
"stock_zh_a_daily" # 获取 A 股历史行情数据(日频)
"stock_zh_kcb_daily" # 获取科创板历史行情数据(日频)
"option_sina_cffex_hs300_daily" # 沪深300期权历史行情-日频
"option_sina_sse_daily" # 上交所期权日频数据
"""
查看详情
pip install akshare --upgrade
UseWlarning: 为了支持更多特性,请将 Pandas 升级到 2.1.0及以上版本
pip uninstall pandas
pip install pandas==1.1.0
Pandas requires version '3.0.10' or newer of 'openpyxl' (version '3.0.9' currently installed)
pip install openpyxl==3.0.10
- 查看
案例2
#利用baostock分析股票
import pandas as pd
from pandas import Series, DataFrame
import akshare as ak
import mplfinance as mf
import matplotlib.pyplot as plot
from statsmodels.graphics.tsaplots import plot_acf, plot_pacf
from statsmodels.tsa.arima_model import ARIMA
from pandas.plotting import scatter_matrix
#建立登录并获取数据
stock_szse_area_summary_df = ak.stock_szse_area_summary(date="202312")
print(stock_szse_area_summary_df)
# 中国工商银行数据
stock_df = ak.stock_zh_a_hist(symbol='600729', period="daily",
start_date='20230101', end_date='20240101', adjust="qfq")
print(stock_df.describe())
print(stock_df)
from pandas import Series,DataFrame
WuLiangYe=DataFrame(stock_df)
print( "五粮液")
print( WuLiangYe)
WuLiangYe['日期'] = pd.to_datetime(WuLiangYe['日期'])
print( WuLiangYe.info())
dict = {
'开盘': 'Open',
'收盘': 'Close',
'最高': 'High',
'最低': 'Low',
'涨跌幅': 'Profit',
'成交量': 'Volume',
'成交额': 'Amount',
'日期': 'Date'
}
# 画日k线图
WuLiangYe.rename(columns=dict,inplace=True)
WuLiangYe.set_index(['Date'],inplace=True)
print( WuLiangYe.info())
mc = mf.make_marketcolors(
up="red", # 上涨K线的颜色
down="green", # 下跌K线的颜色
edge="gray", # 蜡烛图箱体的颜色
volume="pink", # 成交量柱子的颜色
wick="gray" # 蜡烛图影线的颜色
)
style = mf.make_mpf_style(base_mpl_style="ggplot", marketcolors=mc)
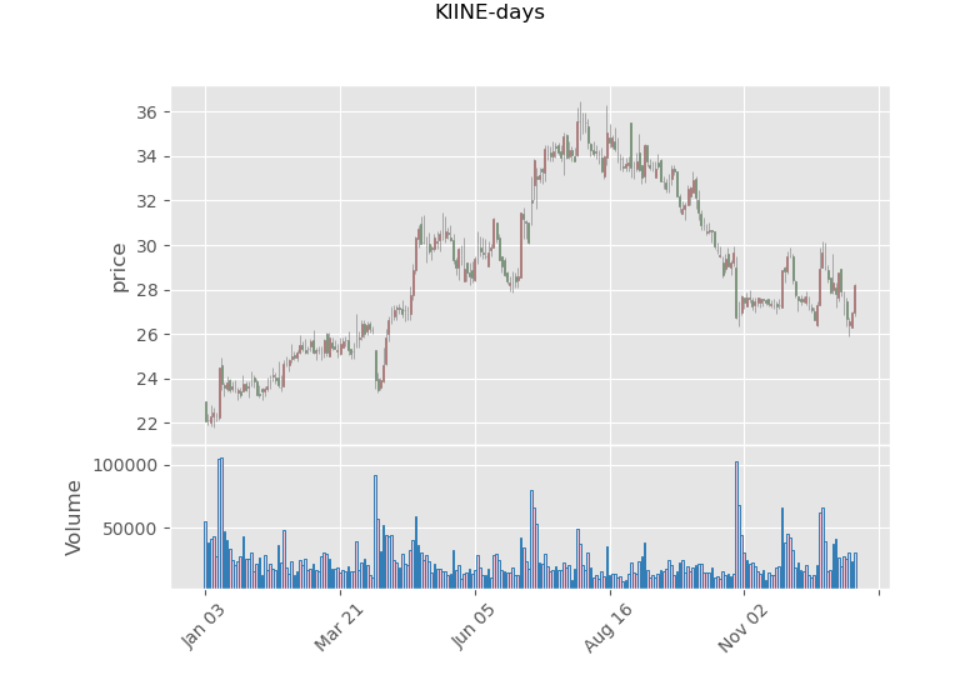
mf.plot(
data=WuLiangYe,
type="candle",
title="KlINE-days",
ylabel="price",
style=style,
volume=True
)
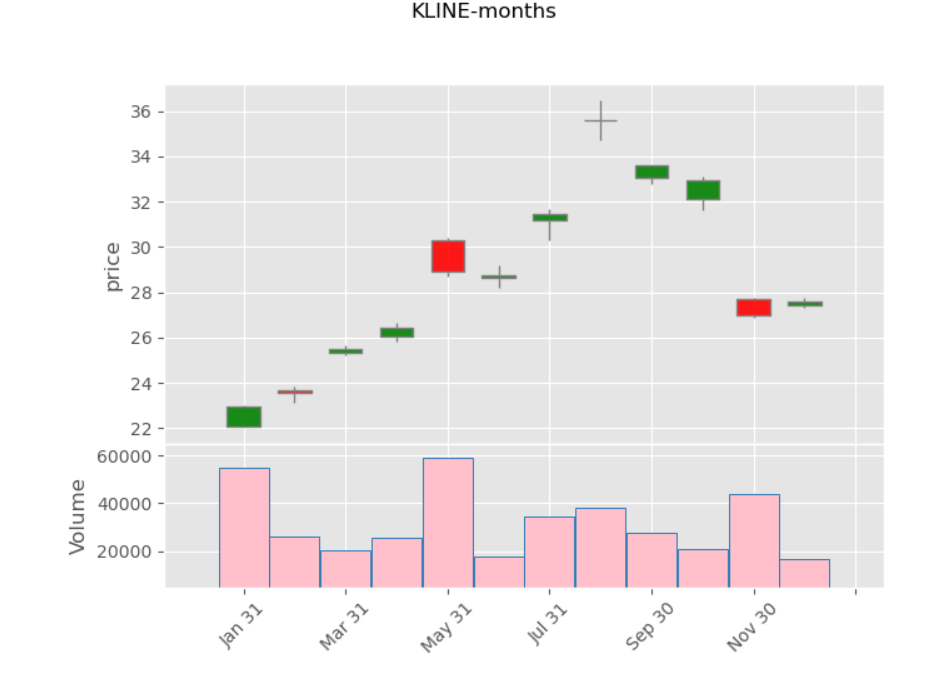
# 绘制月k图
WuLiangYeM = WuLiangYe.resample('M').first()
mc = mf.make_marketcolors(
up="red", # 上涨K线的颜色
down="green", # 下跌K线的颜色
edge="gray", # 蜡烛图箱体的颜色
volume="pink", # 成交量柱子的颜色
wick="gray" # 蜡烛图影线的颜色
)
style = mf.make_mpf_style(base_mpl_style="ggplot", marketcolors=mc)
mf.plot(
data=WuLiangYeM,
type="candle",
title="KLINE-months",
ylabel="price",
style=style,
volume=True
)
mf.show()
"""
从日K线和月k线可以看出,2020年五粮液的股价在1月到3月是呈下降的趋势这是因为2020年受海外新冠疫情的影响,股市风险情绪上升所导致的,而在四月份恐慌情绪过后,五粮液的表现非常强劲,总体呈上升趋势,反弹力度大,回调时间短
六月成交量为全年最高,该月当时券商拉升带动大盘,市场追涨情绪明显,这应该是成交量高的主要原因
评论
计算五粮液2020年总收益率
"""
#将收益率填入列表中 Preclose 上一天的收盘价格。。 有涨跌幅字段
# WuLiangYe['Profit']=((WuLiangYe['Close']-WuLiangYe['Preclose'])/WuLiangYe['Preclose'])
# WuLiangYe['Profit'] =WuLiangYe['Profit'].apply(lambda x: '%.2f%%' % (x*100))#显示百分比
# print( WuLiangYe)
#计算2023年五粮液总收益率 最后一天 减去第一天 / 分母是第一天
total_profit=((WuLiangYe['Close'][-1]-WuLiangYe['Close'][0])/WuLiangYe['Close'][0])*100
total_profit=total_profit.round(2)
print('五粮液2023年股价上涨了{}%'.format(total_profit))
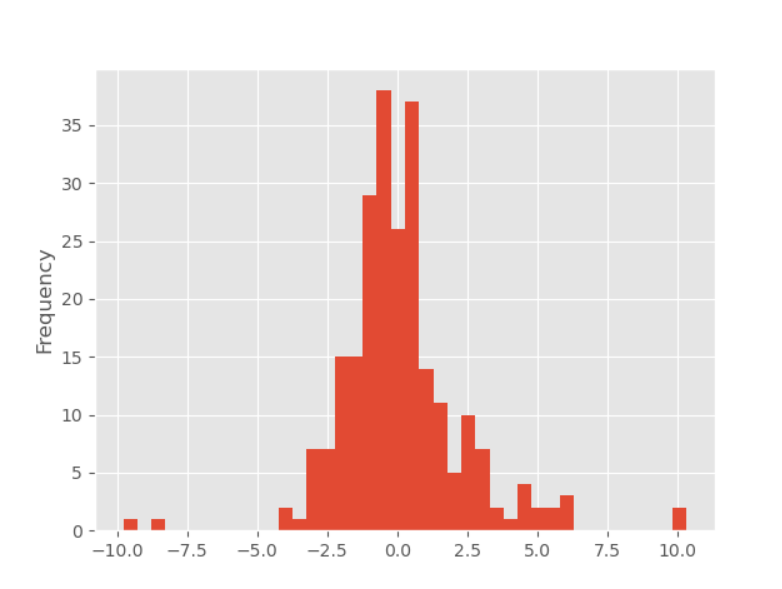
# 五粮液今年日收益率的直方图
WuLiangYe.Profit.plot.hist(bins=40)
# 从直方图可以看出在2020这一年,五粮液上涨的天数多于下跌的天数,但总体还是相对均匀的.
mf.show()
"""
寻找金死叉点并分析收益情况
当股在一年中涨跌天数均匀时,找到买入点和卖出点成为了至关重要的因素,下面通过绘制2020年五粮液股5日线和30日线,寻找其对应的金叉点和死叉点
·金叉是一个股市中常用的技术名词。是指是f由1根时间短的均线在下方向上穿越时间长一点的均线,然后这2根均线方向均朝上,则此均线组合为“均线金叉”,反之为“均线死叉”,金叉趋向买入,死叉趋向卖出
"""
M5=WuLiangYe['Close'].rolling(5).mean()
M5[29:].plot(color='red')#绘制五日线
M30=WuLiangYe['Close'].rolling(30).mean()
M30[29:].plot(color='pink')#绘制三十日线
print( "30[29:]是什么")
print(M30[29:])
s1=M5[29:]<M30[29:]
s2=M5[29:]>M30[29:]
#如上所述,金叉点为短线上扬穿过长线,所以以短线的交点为界,当交点的之前短线在长线下方,之后短线在长线上方时,该交点变为金叉点
WuLiangYe['d_goal']=~(s1|s2.shift(1))
date_goal=WuLiangYe[WuLiangYe['d_goal']==True].index
print( "date_goal是什么")
print(date_goal)
#找出银叉点
WuLiangYe['d_ex']=s1&s2.shift(1)
date_ex=WuLiangYe[WuLiangYe['d_ex']==True].index
print( "找出银叉点")
print(date_ex)
# 下面计算金叉点买入,死叉点卖出的收益率
#生成一个Series,将金死叉点合并,金叉values=1,死叉values=0
x1=pd.Series(1,date_goal)
x2=pd.Series(0,date_ex)
x=x1.append(x2)
x=x.sort_index()
print("#生成一个Series,将金死叉点合并,金叉values=1,死叉values=0")
print(x )
first_money = 1000000 # 本金
money = first_money # 初始资金
hold = 0 # 账户五粮液股票目前笔数
for i in range(0, len(x)): # 卖出买入的日期有多少个,金叉死叉的时间节点循环
if x[i] == 1: # 日期为金叉日期
time = x.index[i] # 提取当天日期
p = WuLiangYe.loc[time]['Open'] # 原数据中提取 开盘价格
hand = p * 100 # 一手(100支) 的价格
hand_count = money // hand # 目前资金最多能买几手
hold = hand_count * 100 # 需要买多少支
money -= hold * p # 尽可能多买完后,还剩余多少资金
else:
deat_time = x.index[i] # 提取死叉时间序列的值
p_death = WuLiangYe.loc[deat_time]['Open'] # 提取原数据 死叉日期当天的开盘价
money += p_death * hold # 账户所有股票根据开盘价卖出后得到的钱
hold = 0 # 账户股票清空
last_money = hold * WuLiangYe['Close'][-1] # 最后一天的日期是金叉还是死叉,账户剩余的股票按照最终价格换算价格
l = int(money + last_money - first_money) / first_money # 利润率= 口袋余额+账户余额-起始本金/初始本金
print("按照金叉购买的收益率" ,l)
#计算2020-02-19到2020-12-31的收益率
print(WuLiangYe[29:]['Profit'].sum())
"""
结论
如上述我们发现采用金叉买入死叉卖出的方法,其收益率约为81.07%。而我们计算得到从2020-02-19开始五粮液股价上涨了93.54%,我们通过MACD金叉死叉去买入卖出反而赚的少了。可见在股市,金死叉策略只是一个机械的操作方案,它并不保证我们能最大化我们的收益,因此在股票实战中,我们仍需要通过更多的分析去选取合适的买入点和卖出点。
"""
查看详情
pip install mplfinance
UserWarning: A NumPy version >=1.16.5 and <1.23.0 is required for this version of SciPy (detected version 1.26.3
  warnings.warn(f"A NumPy version >={np_minversion} and <{np_maxversion}"
Traceback (most recent call last):
  File "C:\work\PythonProject\demo1\day5\xxx.py", line 7, in <module>
    from statsmodels.graphics.tsaplots import plot_acf,plot_pacf
  File "C:\ProgramData\Anaconda3\lib\site-packages\statsmodels\graphics\tsaplots.py", line 9, in <module>
    from statsmodels.tsa.stattools import acf, pacf
  File "C:\ProgramData\Anaconda3\lib\site-packages\statsmodels\tsa\stattools.py", line 16, in <module>
    from statsmodels.regression.linear_model import OLS, yule_walker
  File "C:\ProgramData\Anaconda3\lib\site-packages\statsmodels\regression\__init__.py", line 1, in <module>
    from .linear_model import yule_walker
  File "C:\ProgramData\Anaconda3\lib\site-packages\statsmodels\regression\linear_model.py", line 46, in <module>
    import statsmodels.base.model as base
  File "C:\ProgramData\Anaconda3\lib\site-packages\statsmodels\base\model.py", line 16, in <module>
    from statsmodels.tools.numdiff import approx_fprime
  File "C:\ProgramData\Anaconda3\lib\site-packages\statsmodels\tools\numdiff.py", line 51, in <module>
    EPS = np.MachAr().eps
  File "C:\ProgramData\Anaconda3\lib\site-packages\numpy\__init__.py", line 362, in __getattr__
    raise AttributeError("module {!r} has no attribute "
AttributeError: module 'numpy' has no attribute 'MachAr'
pip install numpy==1.20.0
Traceback (most recent call last):
  File "C:\ProgramData\Anaconda3\lib\site-packages\pandas\__init__.py", line 50, in <module>
    from pandas.compat import (
  File "C:\ProgramData\Anaconda3\lib\site-packages\pandas\compat\__init__.py", line 26, in <module>
    from pandas.compat.numpy import is_numpy_dev
  File "C:\ProgramData\Anaconda3\lib\site-packages\pandas\compat\numpy\__init__.py", line 20, in <module>
    raise ImportError(
ImportError: this version of pandas is incompatible with numpy < 1.22.4
your numpy version is 1.20.0.
Please upgrade numpy to >= 1.22.4 to use this pandas version

The above exception was the direct cause of the following exception:

Traceback (most recent call last):
  File "C:\work\PythonProject\demo1\day5\xxx.py", line 2, in <module>
    import pandas as pd
  File "C:\ProgramData\Anaconda3\lib\site-packages\pandas\__init__.py", line 55, in <module>
    raise ImportError(
ImportError: C extension: None not built. If you want to import pandas from the source directory, you may need to run 'python setup.py build_ext' to build the C extensions first.
pip install numpy==1.22.4
ImportError: cannot import name 'Int64Index' from 'pandas'
pip uninstall pandas
pip install pandas==1.3
UserWarning: 为了支持更多特性,请将 Pandas 升级到 2.1.0 及以上版本!
  warnings.warn(
    序号    地区          总交易额     占市场         股票交易额         基金交易额         债券交易额
0    1    上海  5.286822e+12  17.338  2.992193e+12  1.975306e+11  2.096570e+12
1    2    深圳  4.400932e+12  14.433  2.224285e+12  1.737308e+11  2.002532e+12
2    3    北京  3.166373e+12  10.384  1.604361e+12  1.535401e+11  1.408393e+12
3    4    浙江  2.290859e+12   7.513  1.742846e+12  4.721593e+10  5.007972e+11
4    5    江苏  2.207614e+12   7.240  1.422765e+12  7.104161e+10  7.138068e+11
5    6    广州  1.322847e+12   4.338  6.287197e+11  4.877917e+10  6.450713e+11
6    7    福建  1.136743e+12   3.728  6.699251e+11  2.576655e+10  4.410518e+11
7    8  境外地区  1.107133e+12   3.631  1.103059e+12  4.074297e+09  0.000000e+00
8    9    广东  1.021030e+12   3.348  7.148823e+11  1.622570e+10  2.899221e+11
9   10    湖北  9.383528e+11   3.077  4.659381e+11  1.321760e+10  4.591970e+11
10  11    西藏  9.230503e+11   3.027  7.346356e+11  2.205791e+10  1.663568e+11
11  12    四川  9.133173e+11   2.995  5.931431e+11  1.969206e+10  3.002686e+11
12  13    山东  8.364922e+11   2.743  5.409757e+11  2.417572e+10  2.713408e+11
13  14    湖南  5.241884e+11   1.719  3.548191e+11  4.078475e+10  1.285845e+11
14  15    安徽  4.527903e+11   1.485  2.892922e+11  5.397178e+09  1.581010e+11
15  16    陕西  4.264901e+11   1.399  2.388457e+11  4.452894e+09  1.831914e+11
16  17    江西  4.242438e+11   1.391  2.602215e+11  3.511622e+09  1.605107e+11
17  18    河南  4.109226e+11   1.348  2.973818e+11  7.090634e+09  1.064501e+11
18  19    辽宁  3.408091e+11   1.118  2.133040e+11  4.173938e+09  1.233311e+11
19  20    重庆  3.241324e+11   1.063  2.213131e+11  4.530836e+09  9.828847e+10
20  21    天津  3.064202e+11   1.005  1.357469e+11  4.197615e+09  1.664757e+11
21  22    河北  2.777442e+11   0.911  1.797245e+11  6.568652e+09  9.145102e+10
22  23    吉林  2.319529e+11   0.761  8.654197e+10  3.307861e+09  1.421030e+11
23  24    山西  2.165004e+11   0.710  1.249760e+11  2.708641e+09  8.881575e+10
24  25    广西  2.011458e+11   0.660  1.319309e+11  2.249863e+09  6.696508e+10
25  26   黑龙江  1.500966e+11   0.492  9.528036e+10  2.456394e+09  5.235989e+10
26  27    贵州  1.491735e+11   0.489  7.222632e+10  1.602498e+09  7.534470e+10
27  28    云南  1.392529e+11   0.457  8.440227e+10  1.996541e+09  5.285409e+10
28  29    新疆  8.736739e+10   0.287  6.452827e+10  1.119132e+09  2.171999e+10
29  30   内蒙古  8.632613e+10   0.283  4.379208e+10  7.241238e+08  4.180992e+10
30  31    海南  7.041083e+10   0.231  5.000668e+10  1.052923e+09  1.935122e+10
31  32    甘肃  6.279017e+10   0.206  4.802690e+10  6.601270e+08  1.410314e+10
32  33    宁夏  4.611795e+10   0.151  3.611200e+10  7.105359e+08  9.295411e+09
33  34    青海  1.176249e+10   0.039  9.355787e+09  1.115216e+08  2.295182e+09
               开盘          收盘          最高  ...         涨跌幅         涨跌额         换手率
count  242.000000  242.000000  242.000000  ...  242.000000  242.000000  242.000000
mean    28.793760   28.822149   29.283512  ...    0.109380    0.021612    0.617066
std      3.598273    3.570822    3.634784  ...    2.226286    0.631399    0.397641
min     22.020000   22.080000   22.390000  ...   -9.780000   -2.900000    0.200000
25%     25.752500   25.825000   26.202500  ...   -1.035000   -0.297500    0.380000
50%     28.675000   28.630000   29.220000  ...   -0.205000   -0.055000    0.490000
75%     31.750000   31.707500   32.220000  ...    0.832500    0.220000    0.707500
max     35.600000   35.810000   36.470000  ...   10.320000    2.850000    2.630000

[8 rows x 10 columns]
             日期     开盘     收盘     最高  ...    振幅   涨跌幅   涨跌额   换手率
0    2023-01-03  22.97  22.08  22.99  ...  4.09 -3.87 -0.89  1.37
1    2023-01-04  22.12  22.10  22.39  ...  2.13  0.09  0.02  0.95
2    2023-01-05  22.02  22.31  22.82  ...  4.43  0.95  0.21  1.03
3    2023-01-06  22.28  22.47  22.66  ...  4.03  0.72  0.16  1.09
4    2023-01-09  22.24  22.18  22.48  ...  1.96 -1.29 -0.29  0.68
..          ...    ...    ...    ...  ...   ...   ...   ...   ...
237  2023-12-25  27.80  27.40  27.92  ...  3.83 -1.90 -0.53  0.70
238  2023-12-26  27.48  26.69  27.62  ...  4.60 -2.59 -0.71  0.64
239  2023-12-27  26.42  26.56  26.76  ...  3.30 -0.49 -0.13  0.77
240  2023-12-28  26.28  26.96  27.04  ...  2.94  1.51  0.40  0.60
241  2023-12-29  26.95  28.20  28.27  ...  5.53  4.60  1.24  0.76

[242 rows x 11 columns]
五粮液
             日期     开盘     收盘     最高  ...    振幅   涨跌幅   涨跌额   换手率
0    2023-01-03  22.97  22.08  22.99  ...  4.09 -3.87 -0.89  1.37
1    2023-01-04  22.12  22.10  22.39  ...  2.13  0.09  0.02  0.95
2    2023-01-05  22.02  22.31  22.82  ...  4.43  0.95  0.21  1.03
3    2023-01-06  22.28  22.47  22.66  ...  4.03  0.72  0.16  1.09
4    2023-01-09  22.24  22.18  22.48  ...  1.96 -1.29 -0.29  0.68
..          ...    ...    ...    ...  ...   ...   ...   ...   ...
237  2023-12-25  27.80  27.40  27.92  ...  3.83 -1.90 -0.53  0.70
238  2023-12-26  27.48  26.69  27.62  ...  4.60 -2.59 -0.71  0.64
239  2023-12-27  26.42  26.56  26.76  ...  3.30 -0.49 -0.13  0.77
240  2023-12-28  26.28  26.96  27.04  ...  2.94  1.51  0.40  0.60
241  2023-12-29  26.95  28.20  28.27  ...  5.53  4.60  1.24  0.76

[242 rows x 11 columns]
<class 'pandas.core.frame.DataFrame'>
RangeIndex: 242 entries, 0 to 241
Data columns (total 11 columns):
 #   Column  Non-Null Count  Dtype
---  ------  --------------  -----
 0   日期      242 non-null    datetime64[ns]
 1   开盘      242 non-null    float64
 2   收盘      242 non-null    float64
 3   最高      242 non-null    float64
 4   最低      242 non-null    float64
 5   成交量     242 non-null    int64
 6   成交额     242 non-null    float64
 7   振幅      242 non-null    float64
 8   涨跌幅     242 non-null    float64
 9   涨跌额     242 non-null    float64
 10  换手率     242 non-null    float64
dtypes: datetime64[ns](1), float64(9), int64(1)
memory usage: 20.9 KB
None
<class 'pandas.core.frame.DataFrame'>
DatetimeIndex: 242 entries, 2023-01-03 to 2023-12-29
Data columns (total 10 columns):
 #   Column  Non-Null Count  Dtype
---  ------  --------------  -----
 0   Open    242 non-null    float64
 1   Close   242 non-null    float64
 2   High    242 non-null    float64
 3   Low     242 non-null    float64
 4   Volume  242 non-null    int64
 5   Amount  242 non-null    float64
 6   振幅      242 non-null    float64
 7   Profit  242 non-null    float64
 8   涨跌额     242 non-null    float64
 9   换手率     242 non-null    float64
dtypes: float64(9), int64(1)
memory usage: 20.8 KB
None
五粮液2023年股价上涨了27.72%
30[29:]是什么
Date
2023-02-20    23.464667
2023-02-21    23.554000
2023-02-22    23.645333
2023-02-23    23.735333
2023-02-24    23.817333
                ...
2023-12-25    27.991333
2023-12-26    27.966667
2023-12-27    27.940667
2023-12-28    27.928333
2023-12-29    27.954000
Name: Close, Length: 213, dtype: float64
date_goal是什么
DatetimeIndex(['2023-02-20', '2023-04-18', '2023-06-09', '2023-06-14',
               '2023-07-03', '2023-08-15', '2023-08-17', '2023-11-24',
               '2023-12-13'],
              dtype='datetime64[ns]', name='Date', freq=None)
找出银叉点
DatetimeIndex(['2023-04-11', '2023-06-02', '2023-06-13', '2023-06-21',
               '2023-08-14', '2023-08-16', '2023-08-22', '2023-12-04',
               '2023-12-26'],
              dtype='datetime64[ns]', name='Date', freq=None)
#生成一个Series,将金死叉点合并,金叉values=1,死叉values=0
Date
2023-02-20    1
2023-04-11    0
2023-04-18    1
2023-06-02    0
2023-06-09    1
2023-06-13    0
2023-06-14    1
2023-06-21    0
2023-07-03    1
2023-08-14    0
2023-08-15    1
2023-08-16    0
2023-08-17    1
2023-08-22    0
2023-11-24    1
2023-12-04    0
2023-12-13    1
2023-12-26    0
dtype: int64
按照金叉购买的收益率 0.019397
23.140000000000008
- 输出
案例3
import akshare as ak
"""
检查 Python 的版本需要在 Python 3.8 以上,推荐使用 Python 3.10.x 及以上版本
"""
stock_szse_area_summary_df = ak.stock_szse_area_summary(date="202401")
print(stock_szse_area_summary_df)
# 中国工商银行数据
stock_df = ak.stock_zh_a_hist(symbol='601857', period="daily",
start_date='20230101', end_date='20240101', adjust="qfq")
print(stock_df.describe())
print(stock_df)
from pandas import Series,DataFrame
WuLiangYe=DataFrame(stock_df)
print( "中国石油")
print( WuLiangYe)
# # 将数据写入 CSV 文件
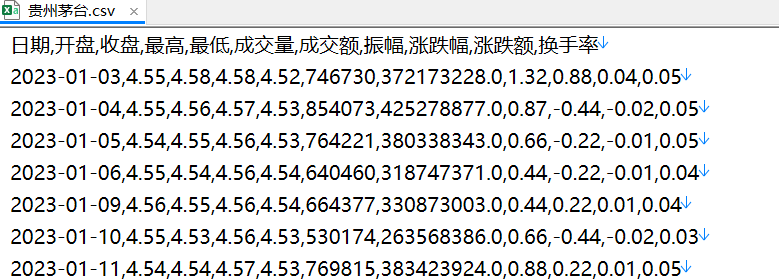
csv_output_path = "贵州茅台.csv"
stock_df.to_csv(csv_output_path, index=False)
查看详情
UserWarning: 为了支持更多特性,请将 Pandas 升级到 2.1.0 及以上版本!
  warnings.warn(
Empty DataFrame
Columns: [序号, 地区, 总交易额, 占市场, 股票交易额, 基金交易额, 债券交易额]
Index: []
               开盘          收盘          最高  ...         涨跌幅         涨跌额         换手率
count  242.000000  242.000000  242.000000  ...  242.000000  242.000000  242.000000
mean     6.709132    6.721694    6.808471  ...    0.201942    0.010413    0.091033
std      1.137603    1.129144    1.155182  ...    1.988103    0.135958    0.055287
min      4.540000    4.530000    4.560000  ...   -6.010000   -0.490000    0.030000
25%      5.637500    5.725000    5.772500  ...   -0.735000   -0.050000    0.050000
50%      7.110000    7.120000    7.200000  ...    0.000000    0.000000    0.070000
75%      7.580000    7.547500    7.640000  ...    0.962500    0.070000    0.110000
max      8.210000    8.150000    8.370000  ...    8.090000    0.610000    0.350000

[8 rows x 10 columns]
             日期    开盘    收盘    最高    最低  ...          成交额    振幅   涨跌幅   涨跌额   换手率
0    2023-01-03  4.55  4.58  4.58  4.52  ...  372173228.0  1.32  0.88  0.04  0.05
1    2023-01-04  4.55  4.56  4.57  4.53  ...  425278877.0  0.87 -0.44 -0.02  0.05
2    2023-01-05  4.54  4.55  4.56  4.53  ...  380338343.0  0.66 -0.22 -0.01  0.05
3    2023-01-06  4.55  4.54  4.56  4.54  ...  318747371.0  0.44 -0.22 -0.01  0.04
4    2023-01-09  4.56  4.55  4.56  4.54  ...  330873003.0  0.44  0.22  0.01  0.04
..          ...   ...   ...   ...   ...  ...          ...   ...   ...   ...   ...
237  2023-12-25  6.80  6.92  6.94  6.79  ...  545944105.0  2.20  1.32  0.09  0.05
238  2023-12-26  6.92  6.99  7.03  6.89  ...  663657089.0  2.02  1.01  0.07  0.06
239  2023-12-27  7.00  7.12  7.17  6.97  ...  767431892.0  2.86  1.86  0.13  0.07
240  2023-12-28  7.13  7.06  7.18  7.01  ...  825151570.0  2.39 -0.84 -0.06  0.07
241  2023-12-29  7.02  7.06  7.12  6.96  ...  836445198.0  2.27  0.00  0.00  0.07

[242 rows x 11 columns]
中国石油
             日期    开盘    收盘    最高    最低  ...          成交额    振幅   涨跌幅   涨跌额   换手率
0    2023-01-03  4.55  4.58  4.58  4.52  ...  372173228.0  1.32  0.88  0.04  0.05
1    2023-01-04  4.55  4.56  4.57  4.53  ...  425278877.0  0.87 -0.44 -0.02  0.05
2    2023-01-05  4.54  4.55  4.56  4.53  ...  380338343.0  0.66 -0.22 -0.01  0.05
3    2023-01-06  4.55  4.54  4.56  4.54  ...  318747371.0  0.44 -0.22 -0.01  0.04
4    2023-01-09  4.56  4.55  4.56  4.54  ...  330873003.0  0.44  0.22  0.01  0.04
..          ...   ...   ...   ...   ...  ...          ...   ...   ...   ...   ...
237  2023-12-25  6.80  6.92  6.94  6.79  ...  545944105.0  2.20  1.32  0.09  0.05
238  2023-12-26  6.92  6.99  7.03  6.89  ...  663657089.0  2.02  1.01  0.07  0.06
239  2023-12-27  7.00  7.12  7.17  6.97  ...  767431892.0  2.86  1.86  0.13  0.07
240  2023-12-28  7.13  7.06  7.18  7.01  ...  825151570.0  2.39 -0.84 -0.06  0.07
241  2023-12-29  7.02  7.06  7.12  6.96  ...  836445198.0  2.27  0.00  0.00  0.07

[242 rows x 11 columns]
- 输出

 浙公网安备 33010602011771号