案例1
import pyecharts
pyecharts.__version__
import pandas as pd
from pyecharts.charts import Map
from pyecharts.charts import Bar
from pyecharts.charts import Line
from pyecharts.charts import Grid
from pyecharts.charts import Pie
from pyecharts.charts import Scatter
from pyecharts import options as opts
import os
df = pd.read_csv('./data/二手房数据.csv', encoding = 'gb18030')
df.head(10)
# 3.2 查看表格数据描述
df.describe()
# 3.3 查看表格是否有数据缺失
print( df.isnull().sum())
# 可以看到电梯数据缺失 8255行。
# 3.4 查看电梯列共有几种值
print( df['电梯'].unique())
# 3.5 缺失值填充 用“未知”填充缺失数据:
df['电梯'].fillna('未知', inplace=True)
print( df.isnull().sum())
print( df['朝向'].unique() )
# 朝向数据包含了“西南”和“南西”两个方向,将其合并为一个方向“西南”:
df['朝向'] = df['朝向'].str.replace('南西','西南')
# df = df[df['朝向'] != '97']
df.drop(df[(df['朝向'] == '97') | (df['朝向'] == '有电梯')].index, inplace=True)
print( df['朝向'].unique() )
# 3.7 统计各城区二手房数量
g = df.groupby('市区')
df_region = g.count()['小区']
region = df_region.index.tolist()
count = df_region.values.tolist()
print( df_region)
new = [x + '区' for x in region]
m = (
Map()
.add('', [list(z) for z in zip(new, count)], '北京')
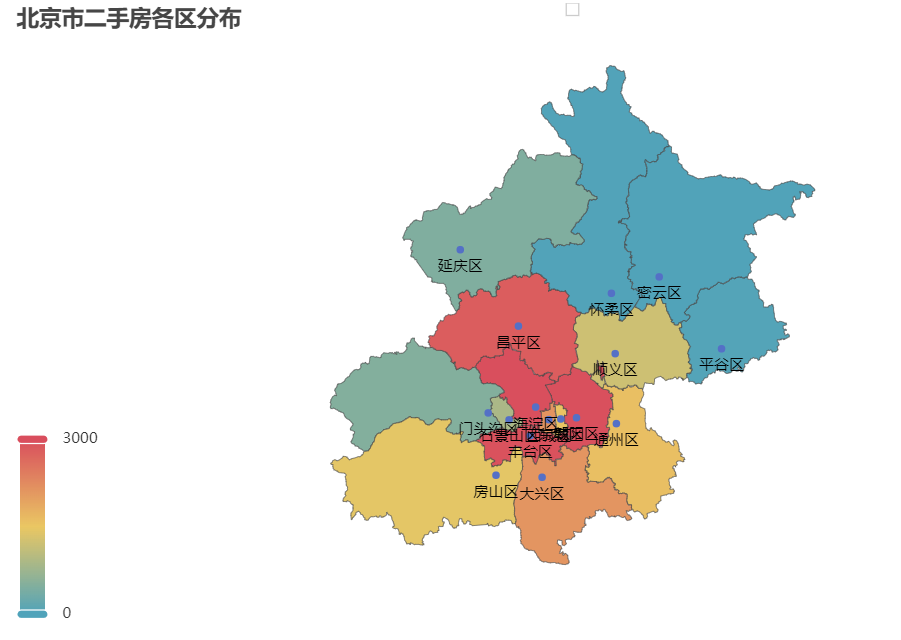
.set_global_opts(
title_opts=opts.TitleOpts(title='北京市二手房各区分布'),
visualmap_opts=opts.VisualMapOpts(max_=3000),
)
.render()
)
# 生成HTML文件(可选)
os.system("render.html")
查看详情
市区                 0
小区                 0
户型                 0
朝向                 0
楼层                 0
装修情况               0
电梯              8255
面积(㎡)              0
价格(万元)             0
年份                 0
Id                 0
Unnamed: 11    23673
dtype: int64
['有电梯' '无电梯' nan '81' '3室1厅' '2室1厅' '光熙家园一期']
市区                 0
小区                 0
户型                 0
朝向                 0
楼层                 0
装修情况               0
电梯                 0
面积(㎡)              0
价格(万元)             0
年份                 0
Id                 0
Unnamed: 11    23673
dtype: int64
['西' '南北' '东西' '南西' '西南' '东南' '南' '东北' '东' '西北' '北']
['西' '南北' '东西' '西南' '东南' '南' '东北' '东' '西北' '北']
市区
东城     1533
丰台     2952
大兴     2115
密云       12
平谷       41
延庆      469
怀柔       15
房山     1441
昌平     2811
朝阳     2972
海淀     2983
石景山     882
西城     2129
通州     1602
门头沟     496
顺义     1221
Name: 小区, dtype: int64
<!DOCTYPE html>
<html>
<head>
    <meta charset="UTF-8">
    <title>Awesome-pyecharts</title>
                <script type="text/javascript" src="https://assets.pyecharts.org/assets/v5/echarts.min.js"></script>
            <script type="text/javascript" src="https://assets.pyecharts.org/assets/v5/maps/beijing.js"></script>

</head>
<body >
    <div id="53008fb50ae5488eaee52616dfa966c2" class="chart-container" style="width:900px; height:500px; "></div>
    <script>
        var chart_53008fb50ae5488eaee52616dfa966c2 = echarts.init(
            document.getElementById('53008fb50ae5488eaee52616dfa966c2'), 'white', {renderer: 'canvas'});
        var option_53008fb50ae5488eaee52616dfa966c2 = {
    "animation": true,
    "animationThreshold": 2000,
    "animationDuration": 1000,
    "animationEasing": "cubicOut",
    "animationDelay": 0,
    "animationDurationUpdate": 300,
    "animationEasingUpdate": "cubicOut",
    "animationDelayUpdate": 0,
    "aria": {
        "enabled": false
    },
    "color": [
        "#5470c6",
        "#91cc75",
        "#fac858",
        "#ee6666",
        "#73c0de",
        "#3ba272",
        "#fc8452",
        "#9a60b4",
        "#ea7ccc"
    ],
    "series": [
        {
            "type": "map",
            "label": {
                "show": true,
                "margin": 8
            },
            "map": "\u5317\u4eac",
            "data": [
                {
                    "name": "\u4e1c\u57ce\u533a",
                    "value": 1533
                },
                {
                    "name": "\u4e30\u53f0\u533a",
                    "value": 2952
                },
                {
                    "name": "\u5927\u5174\u533a",
                    "value": 2115
                },
                {
                    "name": "\u5bc6\u4e91\u533a",
                    "value": 12
                },
                {
                    "name": "\u5e73\u8c37\u533a",
                    "value": 41
                },
                {
                    "name": "\u5ef6\u5e86\u533a",
                    "value": 469
                },
                {
                    "name": "\u6000\u67d4\u533a",
                    "value": 15
                },
                {
                    "name": "\u623f\u5c71\u533a",
                    "value": 1441
                },
                {
                    "name": "\u660c\u5e73\u533a",
                    "value": 2811
                },
                {
                    "name": "\u671d\u9633\u533a",
                    "value": 2972
                },
                {
                    "name": "\u6d77\u6dc0\u533a",
                    "value": 2983
                },
                {
                    "name": "\u77f3\u666f\u5c71\u533a",
                    "value": 882
                },
                {
                    "name": "\u897f\u57ce\u533a",
                    "value": 2129
                },
                {
                    "name": "\u901a\u5dde\u533a",
                    "value": 1602
                },
                {
                    "name": "\u95e8\u5934\u6c9f\u533a",
                    "value": 496
                },
                {
                    "name": "\u987a\u4e49\u533a",
                    "value": 1221
                }
            ],
            "roam": true,
            "aspectScale": 0.75,
            "nameProperty": "name",
            "selectedMode": false,
            "zoom": 1,
            "zlevel": 0,
            "z": 2,
            "seriesLayoutBy": "column",
            "datasetIndex": 0,
            "mapValueCalculation": "sum",
            "showLegendSymbol": true,
            "emphasis": {}
        }
    ],
    "legend": [
        {
            "data": [
                ""
            ],
            "selected": {},
            "show": true,
            "padding": 5,
            "itemGap": 10,
            "itemWidth": 25,
            "itemHeight": 14,
            "backgroundColor": "transparent",
            "borderColor": "#ccc",
            "borderWidth": 1,
            "borderRadius": 0,
            "pageButtonItemGap": 5,
            "pageButtonPosition": "end",
            "pageFormatter": "{current}/{total}",
            "pageIconColor": "#2f4554",
            "pageIconInactiveColor": "#aaa",
            "pageIconSize": 15,
            "animationDurationUpdate": 800,
            "selector": false,
            "selectorPosition": "auto",
            "selectorItemGap": 7,
            "selectorButtonGap": 10
        }
    ],
    "tooltip": {
        "show": true,
        "trigger": "item",
        "triggerOn": "mousemove|click",
        "axisPointer": {
            "type": "line"
        },
        "showContent": true,
        "alwaysShowContent": false,
        "showDelay": 0,
        "hideDelay": 100,
        "enterable": false,
        "confine": false,
        "appendToBody": false,
        "transitionDuration": 0.4,
        "textStyle": {
            "fontSize": 14
        },
        "borderWidth": 0,
        "padding": 5,
        "order": "seriesAsc"
    },
    "title": [
        {
            "show": true,
            "text": "\u5317\u4eac\u5e02\u4e8c\u624b\u623f\u5404\u533a\u5206\u5e03",
            "target": "blank",
            "subtarget": "blank",
            "padding": 5,
            "itemGap": 10,
            "textAlign": "auto",
            "textVerticalAlign": "auto",
            "triggerEvent": false
        }
    ],
    "visualMap": {
        "show": true,
        "type": "continuous",
        "min": 0,
        "max": 3000,
        "inRange": {
            "color": [
                "#50a3ba",
                "#eac763",
                "#d94e5d"
            ]
        },
        "calculable": true,
        "inverse": false,
        "splitNumber": 5,
        "hoverLink": true,
        "orient": "vertical",
        "padding": 5,
        "showLabel": true,
        "itemWidth": 20,
        "itemHeight": 140,
        "borderWidth": 0
    }
};
        chart_53008fb50ae5488eaee52616dfa966c2.setOption(option_53008fb50ae5488eaee52616dfa966c2);
    </script>
</body>
</html>
- 查看
案例2
# 4.1 北京各城区二手房数量地图分布
print( df.info())
df['价格(万元)'] = pd.to_numeric(df['价格(万元)'], errors='coerce').astype(float)
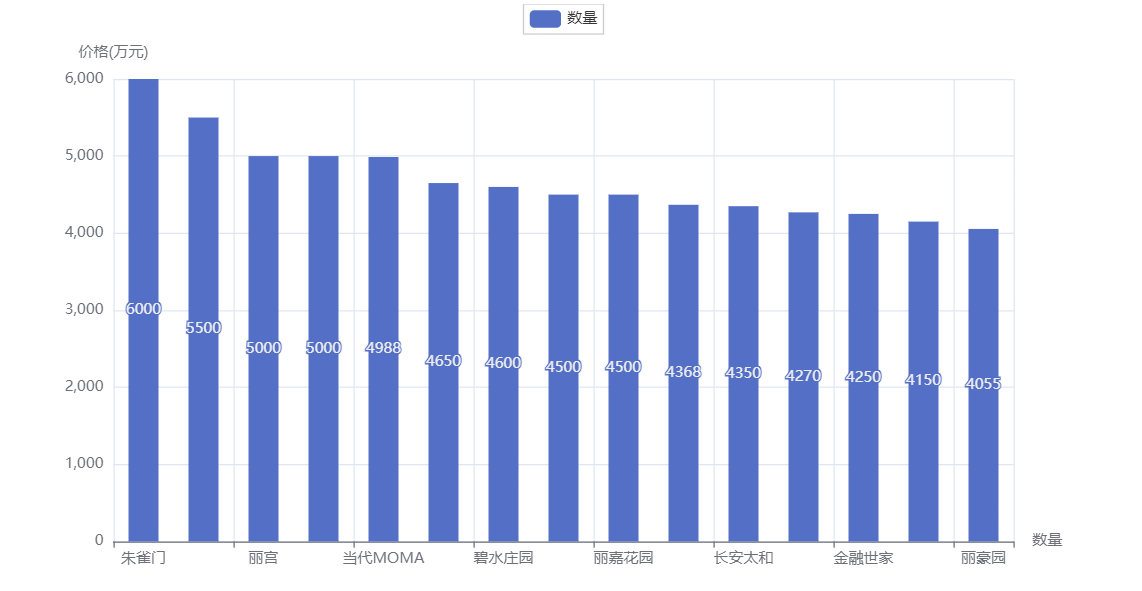
top_price = df.sort_values(by="价格(万元)",ascending=False)[:15]
print("最高价格================")
print(top_price )
area0 = top_price['小区'].values.tolist()
count = top_price['价格(万元)'].values.tolist()
bar = (
Bar()
.add_xaxis(area0)
.add_yaxis('数量', count,category_gap = '50%')
.set_global_opts(
yaxis_opts=opts.AxisOpts(name='价格(万元)'),
xaxis_opts=opts.AxisOpts(name='数量'),
)
.render()
)
os.system("render.html")
查看详情
<class 'pandas.core.frame.DataFrame'>
Int64Index: 23674 entries, 0 to 23673
Data columns (total 12 columns):
 #   Column       Non-Null Count  Dtype
---  ------       --------------  -----
 0   市区           23674 non-null  object
 1   小区           23674 non-null  object
 2   户型           23674 non-null  object
 3   朝向           23674 non-null  object
 4   楼层           23674 non-null  object
 5   装修情况         23674 non-null  object
 6   电梯           23674 non-null  object
 7   面积(㎡)        23674 non-null  object
 8   价格(万元)       23674 non-null  object
 9   年份           23674 non-null  object
 10  Id           23674 non-null  object
 11  Unnamed: 11  1 non-null      object
dtypes: object(12)
memory usage: 2.3+ MB
None
最高价格================
       市区      小区    户型  朝向  楼层  ...  面积(㎡)  价格(万元)    年份        Id Unnamed: 11
20388  西城     朱雀门  4室2厅  东南   5  ...    376  6000.0  2008  1.01E+11         NaN
22225  东城    贡院六号  5室2厅  南北  23  ...    459  5500.0  2002  1.01E+11         NaN
3218   顺义      丽宫  5室2厅  南北   3  ...    685  5000.0  2007  1.01E+11         NaN
22904  东城  NAGA上院  6室2厅  东南  12  ...    608  5000.0  2008  1.01E+11         NaN
22979  东城  当代MOMA  5室2厅  东南   7  ...    384  4988.0  2006  1.01E+11         NaN
20200  西城     耕天下  5室3厅  南北   7  ...    330  4650.0  2003  1.01E+11         NaN
6190   昌平    碧水庄园  5室3厅  南北   2  ...    571  4600.0  2005  1.01E+11         NaN
17284  朝阳    首府官邸  叠拼别墅  南北   5  ...  523.4  4500.0  2007  1.01E+11         NaN
2390   顺义    丽嘉花园  4室2厅  东南   2  ...    548  4500.0  2007  1.01E+11         NaN
15326  海淀     紫御府  4室2厅  南北  12  ...    374  4368.0  2008  1.01E+11         NaN
23237  东城    长安太和  4室1厅   东  24  ...    314  4350.0  2012  1.01E+11         NaN
21009  西城  西派国际公寓  5室2厅  东南  17  ...    355  4270.0  2009  1.01E+11         NaN
20238  西城    金融世家  4室2厅  西北  15  ...    300  4250.0  2008  1.01E+11         NaN
14530  海淀   西山壹号院  4室3厅  东南   6  ...    561  4150.0  2011  1.01E+11         NaN
21757  西城     丽豪园  4室2厅  西南   6  ...    289  4055.0  1999  1.01E+11         NaN
<!DOCTYPE html>
<html>
<head>
    <meta charset="UTF-8">
    <title>Awesome-pyecharts</title>
                <script type="text/javascript" src="https://assets.pyecharts.org/assets/v5/echarts.min.js"></script>

</head>
<body >
    <div id="a718b695e8954ead87108c07feacda57" class="chart-container" style="width:900px; height:500px; "></div>
    <script>
        var chart_a718b695e8954ead87108c07feacda57 = echarts.init(
            document.getElementById('a718b695e8954ead87108c07feacda57'), 'white', {renderer: 'canvas'});
        var option_a718b695e8954ead87108c07feacda57 = {
    "animation": true,
    "animationThreshold": 2000,
    "animationDuration": 1000,
    "animationEasing": "cubicOut",
    "animationDelay": 0,
    "animationDurationUpdate": 300,
    "animationEasingUpdate": "cubicOut",
    "animationDelayUpdate": 0,
    "aria": {
        "enabled": false
    },
    "color": [
        "#5470c6",
        "#91cc75",
        "#fac858",
        "#ee6666",
        "#73c0de",
        "#3ba272",
        "#fc8452",
        "#9a60b4",
        "#ea7ccc"
    ],
    "series": [
        {
            "type": "bar",
            "name": "\u6570\u91cf",
            "legendHoverLink": true,
            "data": [
                6000.0,
                5500.0,
                5000.0,
                5000.0,
                4988.0,
                4650.0,
                4600.0,
                4500.0,
                4500.0,
                4368.0,
                4350.0,
                4270.0,
                4250.0,
                4150.0,
                4055.0
            ],
            "realtimeSort": false,
            "showBackground": false,
            "stackStrategy": "samesign",
            "cursor": "pointer",
            "barMinHeight": 0,
            "barCategoryGap": "50%",
            "barGap": "30%",
            "large": false,
            "largeThreshold": 400,
            "seriesLayoutBy": "column",
            "datasetIndex": 0,
            "clip": true,
            "zlevel": 0,
            "z": 2,
            "label": {
                "show": true,
                "margin": 8
            }
        }
    ],
    "legend": [
        {
            "data": [
                "\u6570\u91cf"
            ],
            "selected": {},
            "show": true,
            "padding": 5,
            "itemGap": 10,
            "itemWidth": 25,
            "itemHeight": 14,
            "backgroundColor": "transparent",
            "borderColor": "#ccc",
            "borderWidth": 1,
            "borderRadius": 0,
            "pageButtonItemGap": 5,
            "pageButtonPosition": "end",
            "pageFormatter": "{current}/{total}",
            "pageIconColor": "#2f4554",
            "pageIconInactiveColor": "#aaa",
            "pageIconSize": 15,
            "animationDurationUpdate": 800,
            "selector": false,
            "selectorPosition": "auto",
            "selectorItemGap": 7,
            "selectorButtonGap": 10
        }
    ],
    "tooltip": {
        "show": true,
        "trigger": "item",
        "triggerOn": "mousemove|click",
        "axisPointer": {
            "type": "line"
        },
        "showContent": true,
        "alwaysShowContent": false,
        "showDelay": 0,
        "hideDelay": 100,
        "enterable": false,
        "confine": false,
        "appendToBody": false,
        "transitionDuration": 0.4,
        "textStyle": {
            "fontSize": 14
        },
        "borderWidth": 0,
        "padding": 5,
        "order": "seriesAsc"
    },
    "xAxis": [
        {
            "name": "\u6570\u91cf",
            "show": true,
            "scale": false,
            "nameLocation": "end",
            "nameGap": 15,
            "gridIndex": 0,
            "inverse": false,
            "offset": 0,
            "splitNumber": 5,
            "minInterval": 0,
            "splitLine": {
                "show": true,
                "lineStyle": {
                    "show": true,
                    "width": 1,
                    "opacity": 1,
                    "curveness": 0,
                    "type": "solid"
                }
            },
            "data": [
                "\u6731\u96c0\u95e8",
                "\u8d21\u9662\u516d\u53f7",
                "\u4e3d\u5bab",
                "NAGA\u4e0a\u9662",
                "\u5f53\u4ee3MOMA",
                "\u8015\u5929\u4e0b",
                "\u78a7\u6c34\u5e84\u56ed",
                "\u9996\u5e9c\u5b98\u90b8",
                "\u4e3d\u5609\u82b1\u56ed",
                "\u7d2b\u5fa1\u5e9c",
                "\u957f\u5b89\u592a\u548c",
                "\u897f\u6d3e\u56fd\u9645\u516c\u5bd3",
                "\u91d1\u878d\u4e16\u5bb6",
                "\u897f\u5c71\u58f9\u53f7\u9662",
                "\u4e3d\u8c6a\u56ed"
            ]
        }
    ],
    "yAxis": [
        {
            "name": "\u4ef7\u683c(\u4e07\u5143)",
            "show": true,
            "scale": false,
            "nameLocation": "end",
            "nameGap": 15,
            "gridIndex": 0,
            "inverse": false,
            "offset": 0,
            "splitNumber": 5,
            "minInterval": 0,
            "splitLine": {
                "show": true,
                "lineStyle": {
                    "show": true,
                    "width": 1,
                    "opacity": 1,
                    "curveness": 0,
                    "type": "solid"
                }
            }
        }
    ],
    "title": [
        {
            "show": true,
            "target": "blank",
            "subtarget": "blank",
            "padding": 5,
            "itemGap": 10,
            "textAlign": "auto",
            "textVerticalAlign": "auto",
            "triggerEvent": false
        }
    ]
};
        chart_a718b695e8954ead87108c07feacda57.setOption(option_a718b695e8954ead87108c07feacda57);
    </script>
</body>
</html>
- 查看
案例3
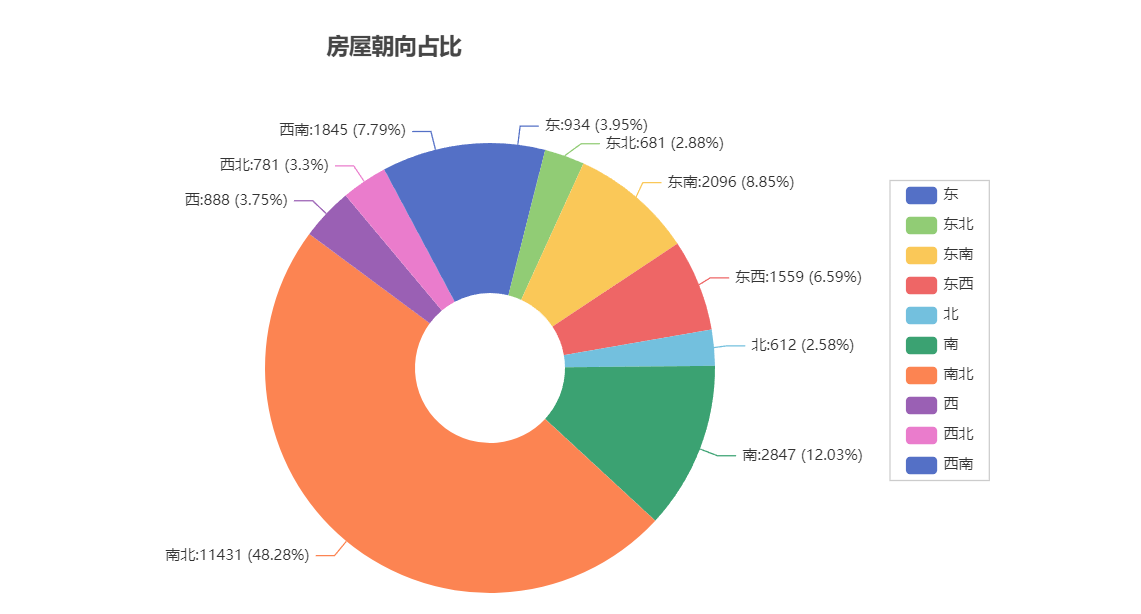
# 4.5 房屋朝向饼图  根据房屋朝向分组
g = df.groupby('朝向')
df_direction =  g.count()['小区']
directions = df_direction.index.tolist()
count = df_direction.values.tolist()

c1 = (
    Pie(init_opts=opts.InitOpts(
            width='800px', height='600px',
            )
       )
        .add(
        '',
        [list(z) for z in zip(directions, count)],
        radius=['20%', '60%'],
        center=['50%', '50%'],
#         rosetype="radius",
        label_opts=opts.LabelOpts(is_show=True),
        )
        .set_global_opts(title_opts=opts.TitleOpts(title='房屋朝向占比',pos_left='33%',pos_top="5%"),
                        legend_opts=opts.LegendOpts(type_="scroll", pos_left="90%",pos_top="25%",orient="vertical")
                        )
        .set_series_opts(label_opts=opts.LabelOpts(formatter='{b}:{c} ({d}%)'),position="outside")
    .render()
)

# 生成HTML文件(可选)
os.system("render.html")
查看详情
<!DOCTYPE html>
<html>
<head>
    <meta charset="UTF-8">
    <title>Awesome-pyecharts</title>
                <script type="text/javascript" src="https://assets.pyecharts.org/assets/v5/echarts.min.js"></script>

</head>
<body >
    <div id="317fd6b6e1f24d729ee69750b7f14a33" class="chart-container" style="width:800px; height:600px; "></div>
    <script>
        var chart_317fd6b6e1f24d729ee69750b7f14a33 = echarts.init(
            document.getElementById('317fd6b6e1f24d729ee69750b7f14a33'), 'white', {renderer: 'canvas'});
        var option_317fd6b6e1f24d729ee69750b7f14a33 = {
    "animation": true,
    "animationThreshold": 2000,
    "animationDuration": 1000,
    "animationEasing": "cubicOut",
    "animationDelay": 0,
    "animationDurationUpdate": 300,
    "animationEasingUpdate": "cubicOut",
    "animationDelayUpdate": 0,
    "aria": {
        "enabled": false
    },
    "color": [
        "#5470c6",
        "#91cc75",
        "#fac858",
        "#ee6666",
        "#73c0de",
        "#3ba272",
        "#fc8452",
        "#9a60b4",
        "#ea7ccc"
    ],
    "series": [
        {
            "type": "pie",
            "colorBy": "data",
            "legendHoverLink": true,
            "selectedMode": false,
            "selectedOffset": 10,
            "clockwise": true,
            "startAngle": 90,
            "minAngle": 0,
            "minShowLabelAngle": 0,
            "avoidLabelOverlap": true,
            "stillShowZeroSum": true,
            "percentPrecision": 2,
            "showEmptyCircle": true,
            "emptyCircleStyle": {
                "color": "lightgray",
                "borderColor": "#000",
                "borderWidth": 0,
                "borderType": "solid",
                "borderDashOffset": 0,
                "borderCap": "butt",
                "borderJoin": "bevel",
                "borderMiterLimit": 10,
                "opacity": 1
            },
            "data": [
                {
                    "name": "\u4e1c",
                    "value": 934
                },
                {
                    "name": "\u4e1c\u5317",
                    "value": 681
                },
                {
                    "name": "\u4e1c\u5357",
                    "value": 2096
                },
                {
                    "name": "\u4e1c\u897f",
                    "value": 1559
                },
                {
                    "name": "\u5317",
                    "value": 612
                },
                {
                    "name": "\u5357",
                    "value": 2847
                },
                {
                    "name": "\u5357\u5317",
                    "value": 11431
                },
                {
                    "name": "\u897f",
                    "value": 888
                },
                {
                    "name": "\u897f\u5317",
                    "value": 781
                },
                {
                    "name": "\u897f\u5357",
                    "value": 1845
                }
            ],
            "radius": [
                "20%",
                "60%"
            ],
            "center": [
                "50%",
                "50%"
            ],
            "label": {
                "show": true,
                "margin": 8,
                "formatter": "{b}:{c} ({d}%)"
            },
            "labelLine": {
                "show": true,
                "showAbove": false,
                "length": 15,
                "length2": 15,
                "smooth": false,
                "minTurnAngle": 90,
                "maxSurfaceAngle": 90
            },
            "rippleEffect": {
                "show": true,
                "brushType": "stroke",
                "scale": 2.5,
                "period": 4
            },
            "position": "outside"
        }
    ],
    "legend": [
        {
            "data": [
                "\u4e1c",
                "\u4e1c\u5317",
                "\u4e1c\u5357",
                "\u4e1c\u897f",
                "\u5317",
                "\u5357",
                "\u5357\u5317",
                "\u897f",
                "\u897f\u5317",
                "\u897f\u5357"
            ],
            "selected": {},
            "type": "scroll",
            "show": true,
            "left": "90%",
            "top": "25%",
            "orient": "vertical",
            "padding": 5,
            "itemGap": 10,
            "itemWidth": 25,
            "itemHeight": 14,
            "backgroundColor": "transparent",
            "borderColor": "#ccc",
            "borderWidth": 1,
            "borderRadius": 0,
            "pageButtonItemGap": 5,
            "pageButtonPosition": "end",
            "pageFormatter": "{current}/{total}",
            "pageIconColor": "#2f4554",
            "pageIconInactiveColor": "#aaa",
            "pageIconSize": 15,
            "animationDurationUpdate": 800,
            "selector": false,
            "selectorPosition": "auto",
            "selectorItemGap": 7,
            "selectorButtonGap": 10
        }
    ],
    "tooltip": {
        "show": true,
        "trigger": "item",
        "triggerOn": "mousemove|click",
        "axisPointer": {
            "type": "line"
        },
        "showContent": true,
        "alwaysShowContent": false,
        "showDelay": 0,
        "hideDelay": 100,
        "enterable": false,
        "confine": false,
        "appendToBody": false,
        "transitionDuration": 0.4,
        "textStyle": {
            "fontSize": 14
        },
        "borderWidth": 0,
        "padding": 5,
        "order": "seriesAsc"
    },
    "title": [
        {
            "show": true,
            "text": "\u623f\u5c4b\u671d\u5411\u5360\u6bd4",
            "target": "blank",
            "subtarget": "blank",
            "left": "33%",
            "top": "5%",
            "padding": 5,
            "itemGap": 10,
            "textAlign": "auto",
            "textVerticalAlign": "auto",
            "triggerEvent": false
        }
    ]
};
        chart_317fd6b6e1f24d729ee69750b7f14a33.setOption(option_317fd6b6e1f24d729ee69750b7f14a33);
    </script>
</body>
</html>
- 查看
案例4
from pyecharts import options as opts
from pyecharts.charts import Map
from pyecharts.faker import Faker
import os
# 基础数据
# 省和直辖市
province_distribution = {'河南': 45.23, '北京': 37.56, '河北': 21, '辽宁': 12, '江西': 6, '上海': 20, '安徽': 10, '江苏': 16, '湖南': 9,
                         '浙江': 13, '海南': 2, '广东': 22, '湖北': 8, '黑龙江': 11, '澳门': 1, '陕西': 11, '四川': 7, '内蒙古': 3, '重庆': 3,
                         '云南': 6, '贵州': 2, '吉林': 3, '山西': 12, '山东': 11, '福建': 4, '青海': 1, '舵主科技,质量保证': 1, '天津': 1,
                         '其他': 1}

provice = list(province_distribution.keys())
values = list(province_distribution.values())
print( values)
map_chart = (
    Map()
    .add("", [list(z) for z in zip(provice, values)], "china")
    .set_global_opts(title_opts=opts.TitleOpts(title="中国地图"))
    .render()
)
# 生成HTML文件(可选)
os.system("render.html")
查看详情
[45.23, 37.56, 21, 12, 6, 20, 10, 16, 9, 13, 2, 22, 8, 11, 1, 11, 7, 3, 3, 6, 2, 3, 12, 11, 4, 1, 1, 1, 1]
<!DOCTYPE html>
<html>
<head>
    <meta charset="UTF-8">
    <title>Awesome-pyecharts</title>
                <script type="text/javascript" src="https://assets.pyecharts.org/assets/v5/echarts.min.js"></script>
            <script type="text/javascript" src="https://assets.pyecharts.org/assets/v5/maps/china.js"></script>

</head>
<body >
    <div id="dae383f7bae94833a2efc95bf5cb41fd" class="chart-container" style="width:900px; height:500px; "></div>
    <script>
        var chart_dae383f7bae94833a2efc95bf5cb41fd = echarts.init(
            document.getElementById('dae383f7bae94833a2efc95bf5cb41fd'), 'white', {renderer: 'canvas'});
        var option_dae383f7bae94833a2efc95bf5cb41fd = {
    "animation": true,
    "animationThreshold": 2000,
    "animationDuration": 1000,
    "animationEasing": "cubicOut",
    "animationDelay": 0,
    "animationDurationUpdate": 300,
    "animationEasingUpdate": "cubicOut",
    "animationDelayUpdate": 0,
    "aria": {
        "enabled": false
    },
    "color": [
        "#5470c6",
        "#91cc75",
        "#fac858",
        "#ee6666",
        "#73c0de",
        "#3ba272",
        "#fc8452",
        "#9a60b4",
        "#ea7ccc"
    ],
    "series": [
        {
            "type": "map",
            "label": {
                "show": true,
                "margin": 8
            },
            "map": "china",
            "data": [
                {
                    "name": "\u6cb3\u5357",
                    "value": 45.23
                },
                {
                    "name": "\u5317\u4eac",
                    "value": 37.56
                },
                {
                    "name": "\u6cb3\u5317",
                    "value": 21
                },
                {
                    "name": "\u8fbd\u5b81",
                    "value": 12
                },
                {
                    "name": "\u6c5f\u897f",
                    "value": 6
                },
                {
                    "name": "\u4e0a\u6d77",
                    "value": 20
                },
                {
                    "name": "\u5b89\u5fbd",
                    "value": 10
                },
                {
                    "name": "\u6c5f\u82cf",
                    "value": 16
                },
                {
                    "name": "\u6e56\u5357",
                    "value": 9
                },
                {
                    "name": "\u6d59\u6c5f",
                    "value": 13
                },
                {
                    "name": "\u6d77\u5357",
                    "value": 2
                },
                {
                    "name": "\u5e7f\u4e1c",
                    "value": 22
                },
                {
                    "name": "\u6e56\u5317",
                    "value": 8
                },
                {
                    "name": "\u9ed1\u9f99\u6c5f",
                    "value": 11
                },
                {
                    "name": "\u6fb3\u95e8",
                    "value": 1
                },
                {
                    "name": "\u9655\u897f",
                    "value": 11
                },
                {
                    "name": "\u56db\u5ddd",
                    "value": 7
                },
                {
                    "name": "\u5185\u8499\u53e4",
                    "value": 3
                },
                {
                    "name": "\u91cd\u5e86",
                    "value": 3
                },
                {
                    "name": "\u4e91\u5357",
                    "value": 6
                },
                {
                    "name": "\u8d35\u5dde",
                    "value": 2
                },
                {
                    "name": "\u5409\u6797",
                    "value": 3
                },
                {
                    "name": "\u5c71\u897f",
                    "value": 12
                },
                {
                    "name": "\u5c71\u4e1c",
                    "value": 11
                },
                {
                    "name": "\u798f\u5efa",
                    "value": 4
                },
                {
                    "name": "\u9752\u6d77",
                    "value": 1
                },
                {
                    "name": "\u8235\u4e3b\u79d1\u6280\uff0c\u8d28\u91cf\u4fdd\u8bc1",
                    "value": 1
                },
                {
                    "name": "\u5929\u6d25",
                    "value": 1
                },
                {
                    "name": "\u5176\u4ed6",
                    "value": 1
                }
            ],
            "roam": true,
            "aspectScale": 0.75,
            "nameProperty": "name",
            "selectedMode": false,
            "zoom": 1,
            "zlevel": 0,
            "z": 2,
            "seriesLayoutBy": "column",
            "datasetIndex": 0,
            "mapValueCalculation": "sum",
            "showLegendSymbol": true,
            "emphasis": {}
        }
    ],
    "legend": [
        {
            "data": [
                ""
            ],
            "selected": {},
            "show": true,
            "padding": 5,
            "itemGap": 10,
            "itemWidth": 25,
            "itemHeight": 14,
            "backgroundColor": "transparent",
            "borderColor": "#ccc",
            "borderWidth": 1,
            "borderRadius": 0,
            "pageButtonItemGap": 5,
            "pageButtonPosition": "end",
            "pageFormatter": "{current}/{total}",
            "pageIconColor": "#2f4554",
            "pageIconInactiveColor": "#aaa",
            "pageIconSize": 15,
            "animationDurationUpdate": 800,
            "selector": false,
            "selectorPosition": "auto",
            "selectorItemGap": 7,
            "selectorButtonGap": 10
        }
    ],
    "tooltip": {
        "show": true,
        "trigger": "item",
        "triggerOn": "mousemove|click",
        "axisPointer": {
            "type": "line"
        },
        "showContent": true,
        "alwaysShowContent": false,
        "showDelay": 0,
        "hideDelay": 100,
        "enterable": false,
        "confine": false,
        "appendToBody": false,
        "transitionDuration": 0.4,
        "textStyle": {
            "fontSize": 14
        },
        "borderWidth": 0,
        "padding": 5,
        "order": "seriesAsc"
    },
    "title": [
        {
            "show": true,
            "text": "\u4e2d\u56fd\u5730\u56fe",
            "target": "blank",
            "subtarget": "blank",
            "padding": 5,
            "itemGap": 10,
            "textAlign": "auto",
            "textVerticalAlign": "auto",
            "triggerEvent": false
        }
    ]
};
        chart_dae383f7bae94833a2efc95bf5cb41fd.setOption(option_dae383f7bae94833a2efc95bf5cb41fd);
    </script>
</body>
</html>
- 查看

案例5
from pyecharts.charts import Geo
from pyecharts import options as opts
import random
# 方式1
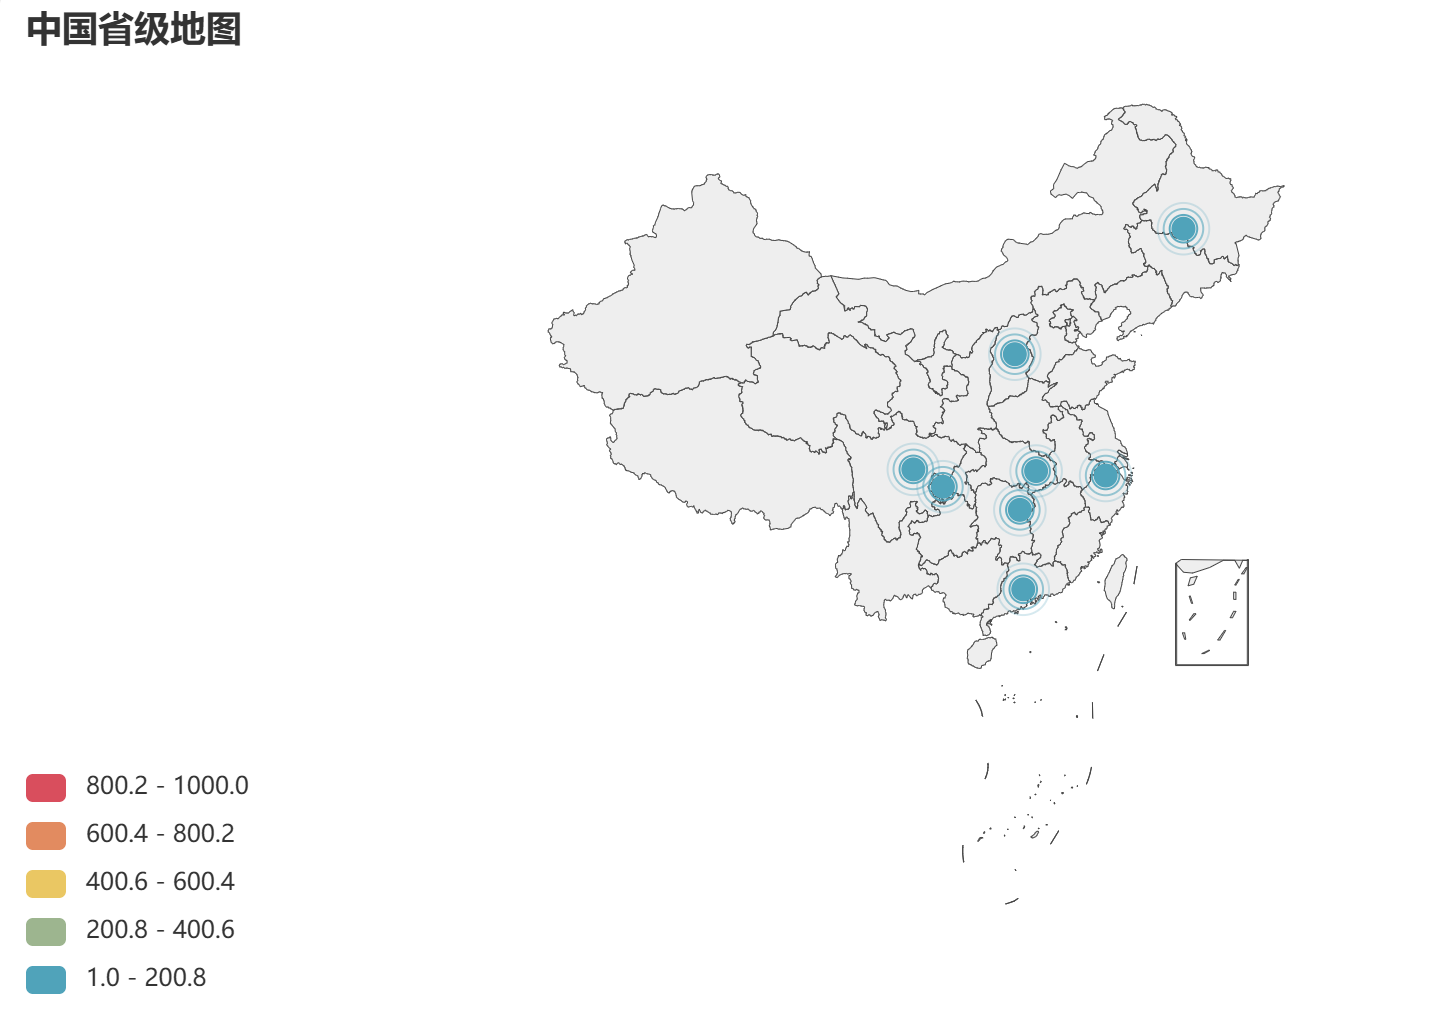
province = ['广东', '湖北', '湖南', '四川', '重庆', '黑龙江', '浙江', '山西']
data_province = [(i, random.randint(100, 200)) for i in province]
# 方式2,直接写成如下
# data_province = [('重庆', 383), ('浙江', 927), ('甘肃', 91)]
init_opts=opts.InitOpts(width="400px", height="600px") # 设置初始化选项
# 创建一个 Geo 对象,并设置初始化选项(包括图表大小)
china_province = (
Geo()
.add_schema(maptype="china") # 指定地图类型为'china'
.add("", data_province, type_="effectScatter") # 使用 effectScatter 类型显示数据点
.set_series_opts(label_opts=opts.LabelOpts(is_show=False)) # 这里设置是否显示数据点标签,默认为不显示
.set_global_opts(
title_opts=opts.TitleOpts(title='中国省级地图'),
visualmap_opts=opts.VisualMapOpts(
min_=1,
max_=1000,
is_piecewise=True
),
)
.render(path='中国省级地图.html')
)
点击查看详情
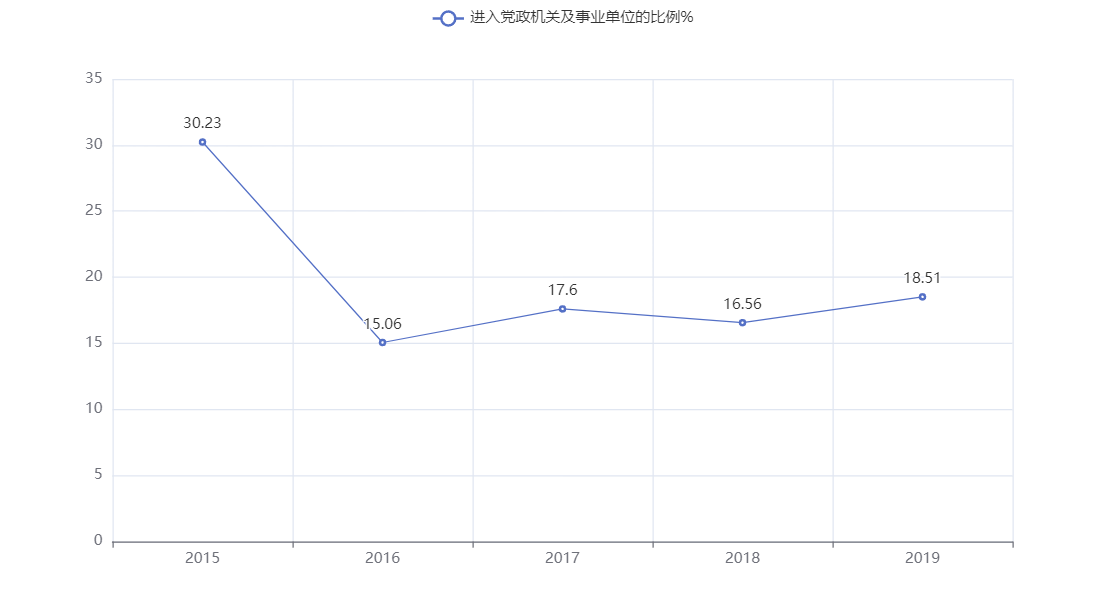
案例6
from pyecharts.charts import Line, Bar, Funnel
from pyecharts.faker import Faker
import pyecharts.options as opts
from pyecharts.commons.utils import JsCode
import os
line1 = (
 Line()
 .add_xaxis(['2015', '2016', '2017', '2018', '2019'])
 .add_yaxis('进入党政机关及事业单位的比例%', [30.23, 15.06, 17.6, 16.56, 18.51])
 .render()
)

# 生成HTML文件(可选)
os.system("render.html")
查看详情
<!DOCTYPE html>
<html>
<head>
    <meta charset="UTF-8">
    <title>Awesome-pyecharts</title>
                <script type="text/javascript" src="https://assets.pyecharts.org/assets/v5/echarts.min.js"></script>

</head>
<body >
    <div id="bcb5363b545d4b02a26c4c15af2d448d" class="chart-container" style="width:900px; height:500px; "></div>
    <script>
        var chart_bcb5363b545d4b02a26c4c15af2d448d = echarts.init(
            document.getElementById('bcb5363b545d4b02a26c4c15af2d448d'), 'white', {renderer: 'canvas'});
        var option_bcb5363b545d4b02a26c4c15af2d448d = {
    "animation": true,
    "animationThreshold": 2000,
    "animationDuration": 1000,
    "animationEasing": "cubicOut",
    "animationDelay": 0,
    "animationDurationUpdate": 300,
    "animationEasingUpdate": "cubicOut",
    "animationDelayUpdate": 0,
    "aria": {
        "enabled": false
    },
    "color": [
        "#5470c6",
        "#91cc75",
        "#fac858",
        "#ee6666",
        "#73c0de",
        "#3ba272",
        "#fc8452",
        "#9a60b4",
        "#ea7ccc"
    ],
    "series": [
        {
            "type": "line",
            "name": "\u8fdb\u5165\u515a\u653f\u673a\u5173\u53ca\u4e8b\u4e1a\u5355\u4f4d\u7684\u6bd4\u4f8b%",
            "connectNulls": false,
            "xAxisIndex": 0,
            "symbolSize": 4,
            "showSymbol": true,
            "smooth": false,
            "clip": true,
            "step": false,
            "data": [
                [
                    "2015",
                    30.23
                ],
                [
                    "2016",
                    15.06
                ],
                [
                    "2017",
                    17.6
                ],
                [
                    "2018",
                    16.56
                ],
                [
                    "2019",
                    18.51
                ]
            ],
            "hoverAnimation": true,
            "label": {
                "show": true,
                "margin": 8
            },
            "logBase": 10,
            "seriesLayoutBy": "column",
            "lineStyle": {
                "show": true,
                "width": 1,
                "opacity": 1,
                "curveness": 0,
                "type": "solid"
            },
            "areaStyle": {
                "opacity": 0
            },
            "zlevel": 0,
            "z": 0
        }
    ],
    "legend": [
        {
            "data": [
                "\u8fdb\u5165\u515a\u653f\u673a\u5173\u53ca\u4e8b\u4e1a\u5355\u4f4d\u7684\u6bd4\u4f8b%"
            ],
            "selected": {}
        }
    ],
    "tooltip": {
        "show": true,
        "trigger": "item",
        "triggerOn": "mousemove|click",
        "axisPointer": {
            "type": "line"
        },
        "showContent": true,
        "alwaysShowContent": false,
        "showDelay": 0,
        "hideDelay": 100,
        "enterable": false,
        "confine": false,
        "appendToBody": false,
        "transitionDuration": 0.4,
        "textStyle": {
            "fontSize": 14
        },
        "borderWidth": 0,
        "padding": 5,
        "order": "seriesAsc"
    },
    "xAxis": [
        {
            "show": true,
            "scale": false,
            "nameLocation": "end",
            "nameGap": 15,
            "gridIndex": 0,
            "inverse": false,
            "offset": 0,
            "splitNumber": 5,
            "minInterval": 0,
            "splitLine": {
                "show": true,
                "lineStyle": {
                    "show": true,
                    "width": 1,
                    "opacity": 1,
                    "curveness": 0,
                    "type": "solid"
                }
            },
            "data": [
                "2015",
                "2016",
                "2017",
                "2018",
                "2019"
            ]
        }
    ],
    "yAxis": [
        {
            "show": true,
            "scale": false,
            "nameLocation": "end",
            "nameGap": 15,
            "gridIndex": 0,
            "inverse": false,
            "offset": 0,
            "splitNumber": 5,
            "minInterval": 0,
            "splitLine": {
                "show": true,
                "lineStyle": {
                    "show": true,
                    "width": 1,
                    "opacity": 1,
                    "curveness": 0,
                    "type": "solid"
                }
            }
        }
    ]
};
        chart_bcb5363b545d4b02a26c4c15af2d448d.setOption(option_bcb5363b545d4b02a26c4c15af2d448d);
    </script>
</body>
</html>
- 查看

 浙公网安备 33010602011771号