| |
| import pandas as pd |
| import numpy as np |
| import seaborn as sns |
| import matplotlib.pyplot as plt |
| from sklearn.preprocessing import StandardScaler |
| from sklearn.cluster import KMeans |
| from sklearn.metrics import silhouette_score |
| from sklearn.model_selection import train_test_split |
| from sklearn.utils import resample |
| from sklearn.ensemble import RandomForestClassifier |
| from sklearn.metrics import classification_report,confusion_matrix |
| |
| |
| plt.rcParams['font.sans-serif'] = ['KaiTi'] |
| |
| new_data = pd.read_csv("./output_new_data_2.csv") |
| data = pd.read_csv("./output_data_2.csv") |
| |
| """ |
| 随机森林模型 |
| 通过构建用户画像后,可以认为客户贷款风险评估得到的结果是比较正确的,因此可以建立随机森林模型来预测客户是否存在高风险,以及探究哪个特征是划分风险的重要因素。 |
| """ |
| |
| x = new_data |
| y = data['Risk Group'] |
| |
| x_train, x_test, y_train, y_test = train_test_split(x, y, test_size=0.3, random_state=10, stratify=y) |
| |
| |
| x_minority = x_train[y_train == 0] |
| y_minority = y_train[y_train == 0] |
| x_majority = x_train[y_train == 1] |
| y_majority = y_train[y_train == 1] |
| |
| x_minority_resampled = resample(x_minority, replace=True, n_samples=len(x_majority), random_state=15) |
| y_minority_resampled = resample(y_minority, replace=True, n_samples=len(y_majority), random_state=15) |
| new_x_train = pd.concat([x_majority, x_minority_resampled]) |
| new_y_train = pd.concat([y_majority, y_minority_resampled]) |
| |
| is_in_train = x_train.apply(lambda row: row.isin(new_x_train).all(), axis=1) |
| duplicates_in_test = x_train[is_in_train] |
| |
| print(f"测试集中包含训练集的行数: {duplicates_in_test.shape[0]}") |
| |
| |
| rf_clf = RandomForestClassifier(random_state=15) |
| rf_clf.fit(new_x_train, new_y_train) |
| |
| RandomForestClassifier(bootstrap=True, class_weight=None, criterion='gini', |
| max_depth=None, max_features='auto', max_leaf_nodes=None, |
| min_impurity_decrease=0.0, min_impurity_split=None, |
| min_samples_leaf=1, min_samples_split=2, |
| min_weight_fraction_leaf=0.0, n_estimators=10, |
| n_jobs=None, oob_score=False, random_state=15, verbose=0, |
| warm_start=False) |
| |
| |
| y_pred_rf = rf_clf.predict(x_test) |
| class_report_rf = classification_report(y_test, y_pred_rf) |
| print(class_report_rf) |
| |
| |
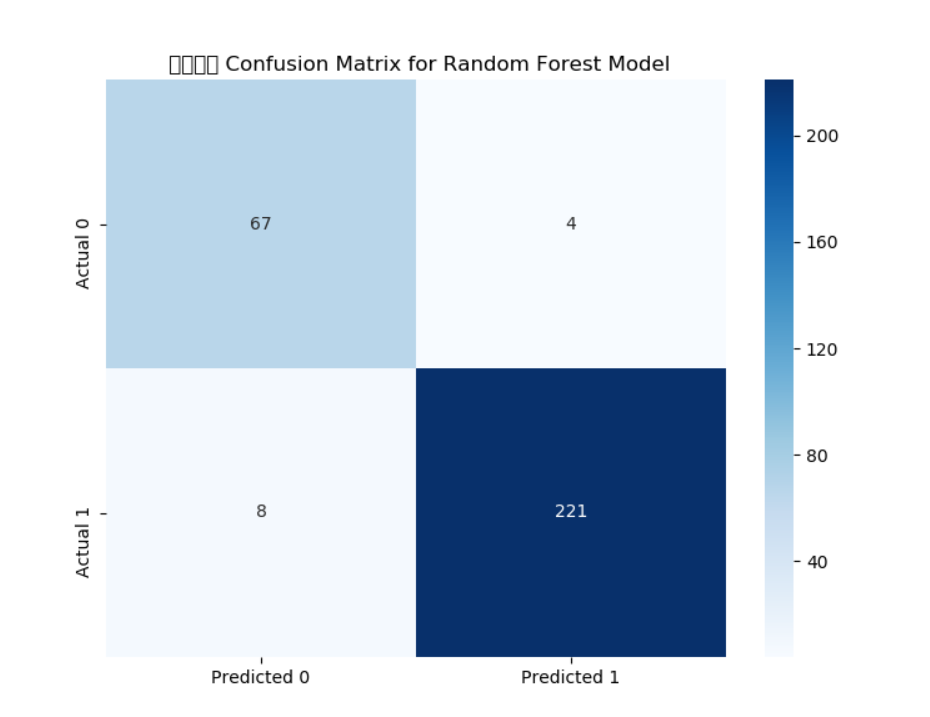
| cm_rf = confusion_matrix(y_test, y_pred_rf) |
| |
| plt.figure(figsize=(8, 6)) |
| sns.heatmap(cm_rf, annot=True, fmt='g', cmap='Blues', |
| xticklabels=['Predicted 0', 'Predicted 1'], |
| yticklabels=['Actual 0', 'Actual 1']) |
| plt.title(' 混淆矩阵 Confusion Matrix for Random Forest Model') |
| |
| """ |
| 模型评分如下: |
| 1.精确度: 对于类别0,精确度为0.92,对于类别1,精确度为0.99。 |
| 2.召回率: 对于类别0,召回率为0.97,对于类别1,召回率为0.97。 |
| 3.F1得分: 对于类别0,F1得分为0.94,对于类别1,F1得分为0.98。 |
| 4.准确率: 0.97。 |
| 这是相当高的评价,可惜的就是数据中并没有包含客户贷款风险性这个特征,这个特征是通过聚类划分出来的,可能与实际有偏差,我们进一步探究哪个因素是划分的重要依据。 |
| """ |
| |
| |
| |
| rf_feature_importance = rf_clf.feature_importances_ |
| feature_names = new_x_train.columns |
| rf_feature_df = pd.DataFrame({ |
| 'Feature': feature_names, |
| 'Importance': rf_feature_importance |
| }) |
| sorted_rf_feature_df = rf_feature_df.sort_values(by='Importance', ascending=False).head() |
| |
| print( "4模型重要特征度",sorted_rf_feature_df ) |
| "可以看出来,聚类划分高风险和低风险主要取决于贷款金额和贷款期限。" |
| |
| plt.show() |
| 测试集中包含训练集的行数: 0 |
| precision recall f1-score support |
| |
| 0 0.89 0.94 0.92 71 |
| 1 0.98 0.97 0.97 229 |
| |
| avg / total 0.96 0.96 0.96 300 |
| |
| 4模型重要特征度 Feature Importance |
| 6 Credit amount 0.424202 |
| 7 Duration 0.404099 |
| 3 Housing 0.045750 |
| 0 Age 0.037464 |
| 2 Job 0.035660 |
-
输出

-
结论
| 本项目通过可视化分析对数据进行初步探索,并利用聚类分析将客户分为不同的风险群体,由于数据集中缺乏直接的客户贷款风险标签,我们无法直接评估风险分类的准确性,因此,再次采用聚类分析(不考虑客户贷款风险特征),将数据分为四个类别,分别描述如下: |
| 类0:中高等额度需求和中长期贷款倾向的高职业人群,被认为是高风险群体。 |
| 类1:具有较高储蓄能力和短期贷款倾向的客户,属于低风险群体。 |
| 类2:年轻群体,倾向于短期贷款且储蓄能力有限,为低风险群体。 |
| 类3:高龄客户,偏好短期贷款,也是低风险群体。 |
| 可以发现,分类结果与实际相符,可以构建随机森林模型来识别风险分类的关键因素。分析结果显示,贷款金额和贷款期限是划分风险的主要依据。虽然无法准确评估模型的精度,但该模型仍可作为初步风险评估的有效工具,从而提高风险识别的效率。 |
| |
| 本次项目遇到最大的难点就是如何划分风险客户,因为这个关乎后面能否建立一个准确的预测模型,如果划分的效果不好,可能会导致模型预测不准确,但是根据聚类的结果,以及现实情况,还是可以认为划分的比较准确,但是与实际还是有出入,毕竟贷款金额高、贷款期限长的不一定就是高风险。 |


· 阿里巴巴 QwQ-32B真的超越了 DeepSeek R-1吗?
· 10年+ .NET Coder 心语 ── 封装的思维:从隐藏、稳定开始理解其本质意义
· 【设计模式】告别冗长if-else语句:使用策略模式优化代码结构
· 字符编码:从基础到乱码解决
· 提示词工程——AI应用必不可少的技术