import numpy as np
import matplotlib.pyplot as mp
import sklearn.naive_bayes as nb
import sklearn.model_selection as ms
import sklearn.metrics as sm
# 整理样本
data = np.loadtxt('./multiple1.txt', delimiter=',')
x = data[:, :2]
y = data[:, -1]
print(x.shape, y.shape)
# 训练模型
train_x, test_x, train_y, test_y = ms.train_test_split(x, y, test_size=0.25, random_state=7)
model = nb.GaussianNB()
model.fit(train_x, train_y)
# 使用测试集,检测预测结果正确率
pred_test_y = model.predict(test_x)
# 输出混淆矩阵 实际输出, 预测输出)->混淆矩阵
cm = sm.confusion_matrix(test_y, pred_test_y)
print(cm ,"输出混淆矩阵==========")
# 输出分类报告
cr = sm.classification_report(test_y, pred_test_y)
print(cr ," 输出分类报告")
# support 样本个数
# 画图
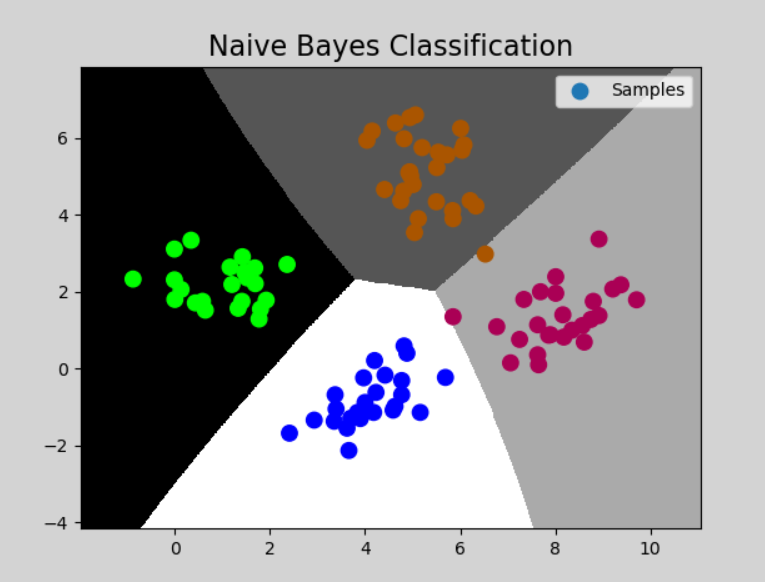
mp.figure('Naive Bayes Classification', facecolor='lightgray')
mp.title('Naive Bayes Classification', fontsize=16)
# 绘制分类边界线
n = 500
l, r = x[:,0].min()-1, x[:,0].max()+1
b, t = x[:,1].min()-1, x[:,1].max()+1
grid_x, grid_y = np.meshgrid(np.linspace(l, r, n),
np.linspace(b, t, n))
# 根据业务,模拟预测
mesh_x = np.column_stack( (grid_x.ravel(), grid_y.ravel()))
grid_z = model.predict(mesh_x)
# 把grid_z 变维:(500,500)
grid_z = grid_z.reshape(grid_x.shape)
mp.pcolormesh(grid_x, grid_y, grid_z, cmap='gray')
mp.scatter(test_x[:,0], test_x[:,1], s=80, c=test_y, cmap='brg_r', label='Samples')
mp.legend()
mp.show()
(400, 2) (400,)
[[22  0  0  0]
 [ 0 27  1  0]
 [ 0  0 25  0]
 [ 0  0  0 25]] 输出混淆矩阵==========
             precision    recall  f1-score   support

        0.0       1.00      1.00      1.00        22
        1.0       1.00      0.96      0.98        28
        2.0       0.96      1.00      0.98        25
        3.0       1.00      1.00      1.00        25

avg / total       0.99      0.99      0.99       100
  输出分类报告
- 输出

 浙公网安备 33010602011771号