交叉验证-准确率
-
查看

-
案例1
import numpy as np
import matplotlib.pyplot as mp
import sklearn.naive_bayes as nb
import sklearn.model_selection as ms

# 整理样本
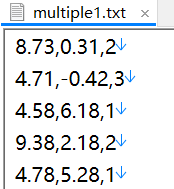
data = np.loadtxt(	'./multiple1.txt', delimiter=',')
x = data[:, :2]
y = data[:, -1]
print(x.shape, y.shape)

# 训练模型
train_x, test_x, train_y, test_y = 	ms.train_test_split(x, y, test_size=0.25, random_state=7)
model = nb.GaussianNB()

#  5交叉验证 ,看下准确度指标如何  需要先把模型对象创建出来。。 自动拆成5段。对每一段做预测。
acc = ms.cross_val_score(model, 	train_x, train_y, cv=5, scoring='accuracy')
print(acc,"accuracy socre 5次交叉验证每次得分。 # 精确度")
print(acc.mean()  ,"accuracy socre 5次交叉验证 的平均得分。。 # 精确度")

pw = ms.cross_val_score(model, 	train_x, train_y, cv=5, scoring='precision_weighted')
print(acc.mean()  ,"查准率")

rw = ms.cross_val_score(model, 	train_x, train_y, cv=5, scoring='recall_weighted')
print(rw.mean() ,"召回率")

f1 = ms.cross_val_score(model, 	train_x, train_y, cv=5, scoring='f1_weighted')
print(f1.mean() ,"f1 得分")

model.fit(train_x, train_y)
# 使用测试集,检测预测结果正确率
pred_test_y = model.predict(test_x)
acc = (test_y == pred_test_y).sum() / test_y.size
print(acc)

# 画图
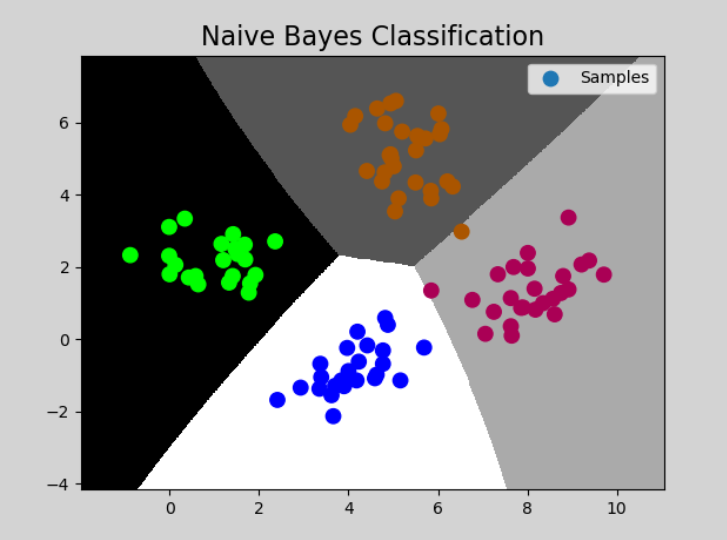
mp.figure('Naive Bayes Classification', facecolor='lightgray')
mp.title('Naive Bayes Classification', fontsize=16)
# 绘制分类边界线
n = 500
l, r = x[:,0].min()-1, x[:,0].max()+1
b, t = x[:,1].min()-1, x[:,1].max()+1
grid_x, grid_y = np.meshgrid(np.linspace(l, r, n),  np.linspace(b, t, n))
# 根据业务,模拟预测
mesh_x = np.column_stack((grid_x.ravel(), grid_y.ravel()))
grid_z = model.predict(mesh_x)
# 把grid_z 变维:(500,500)
grid_z = grid_z.reshape(grid_x.shape)

mp.pcolormesh(grid_x, grid_y, grid_z, cmap='gray')
mp.scatter(test_x[:,0], test_x[:,1], s=80, c=test_y, cmap='brg_r', label='Samples')
mp.legend()
mp.show()
- 控制台打印
(400, 2) (400,)
[1.         1.         1.         1.         0.98305085] accuracy socre 5次交叉验证每次得分。 # 精确度
0.9966101694915255 accuracy socre 5次交叉验证 的平均得分。。 # 精确度
0.9966101694915255 查准率
0.9966101694915255 召回率
0.9966063988235516 f1 得分
0.99
- 输出


 浙公网安备 33010602011771号