磁场的绘制
详见如下python代码
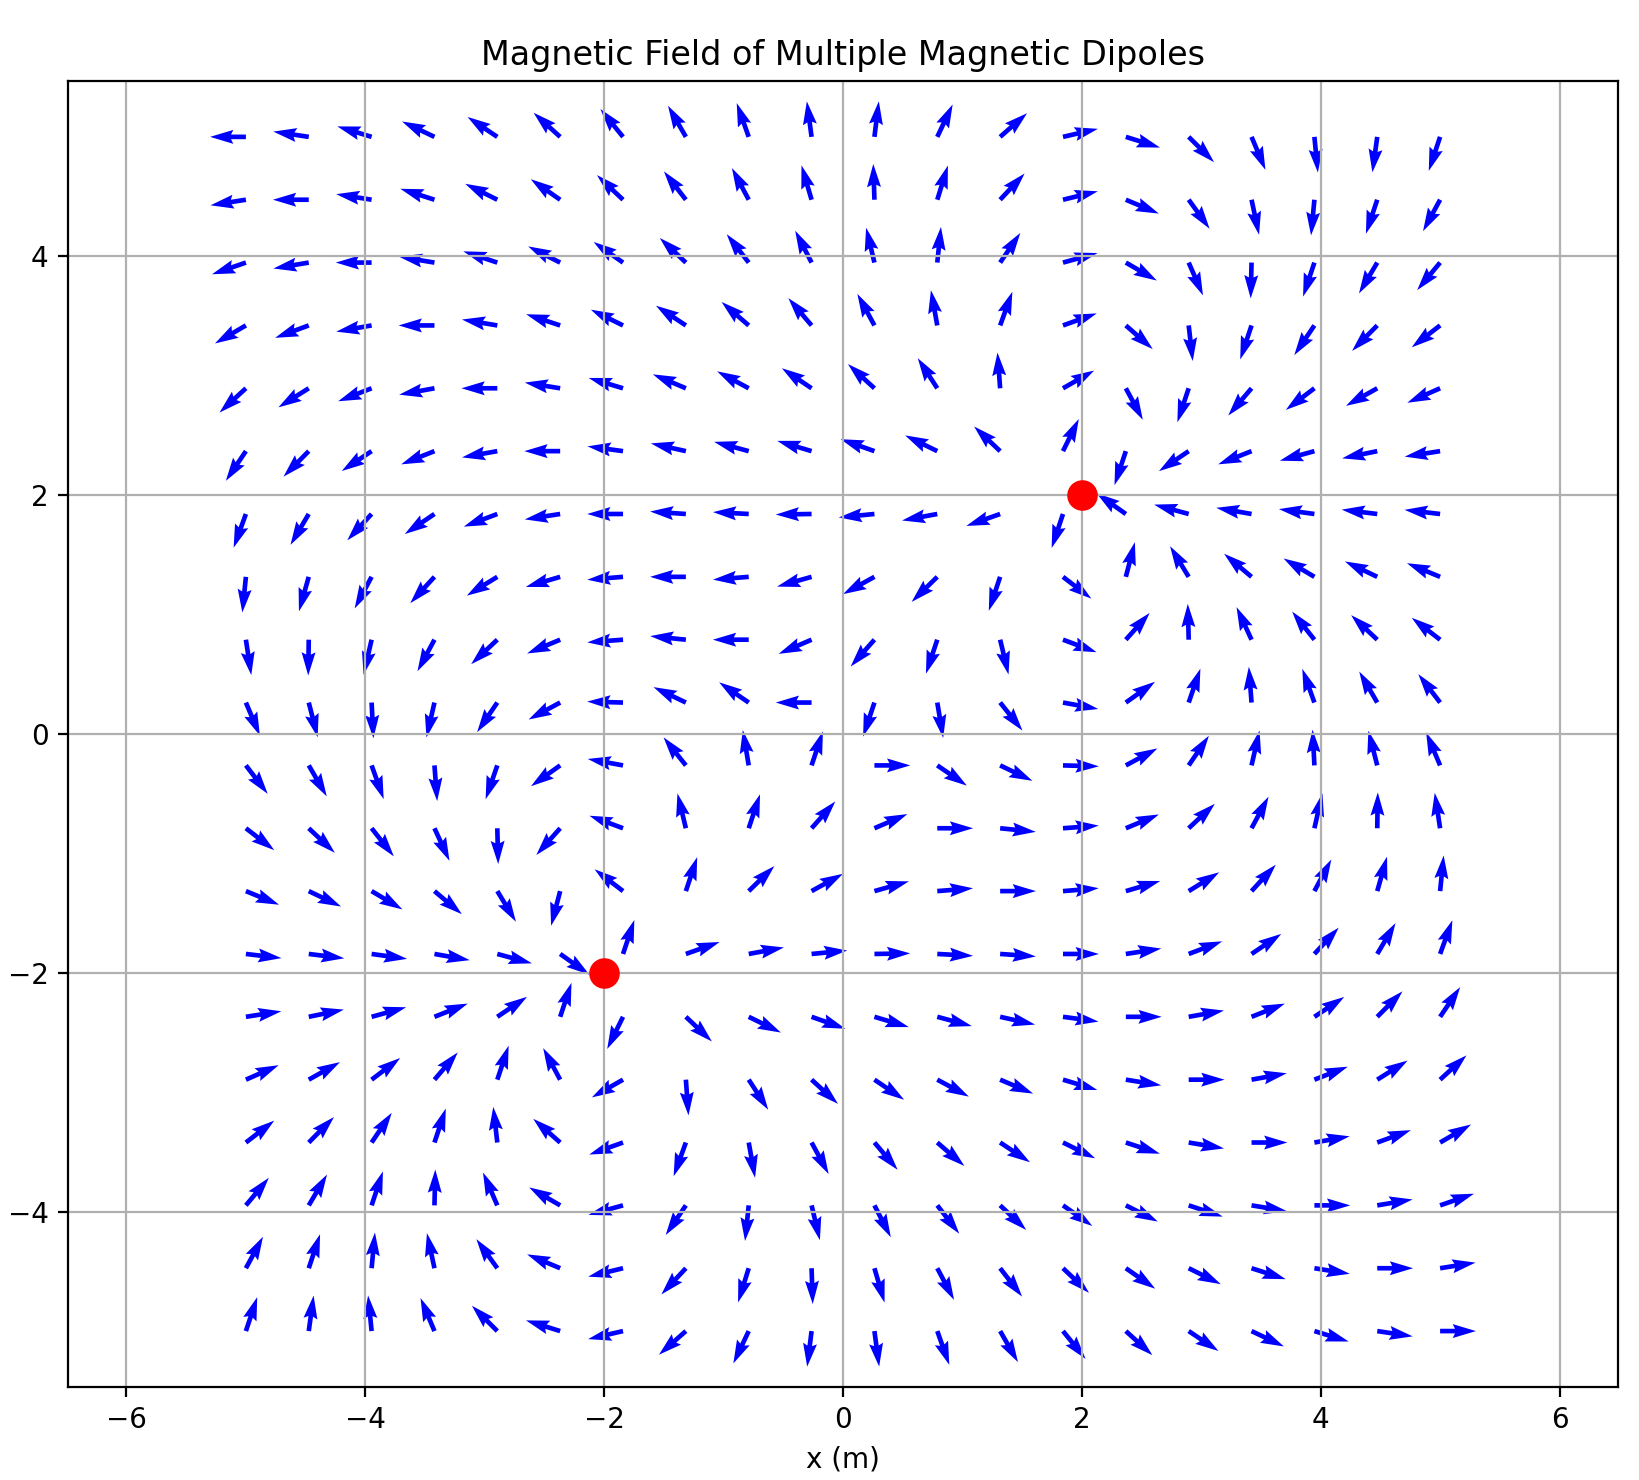
import matplotlib.pyplot as plt
import numpy as np

# 定义常量
mu_0 = 4 * np.pi * 1e-7  # 真空的磁导率 (T m/A)

# 定义磁偶极子类
class MagneticDipole:
    def __init__(self, magnetic_moment, position):
        self.magnetic_moment = np.array(magnetic_moment)  # 磁偶极矩 (二维)
        self.position = np.array(position)  # 偶极子位置

    def magnetic_field(self, X, Y):
        # 计算磁场
        r_vector = np.dstack((X, Y)) - self.position
        r_magnitude = np.linalg.norm(r_vector, axis=2)
        r_magnitude[r_magnitude == 0] = np.inf  # 防止除以零

        # 计算单位向量
        r_hat = r_vector / r_magnitude[:, :, np.newaxis]

        # 磁场公式(只考虑二维分量)
        B_magnitude = (mu_0 / (4 * np.pi)) * (3 * (r_hat[:,:,0] * self.magnetic_moment[0] + r_hat[:,:,1] * self.magnetic_moment[1])[:, :, np.newaxis] * r_hat - self.magnetic_moment) / r_magnitude[:, :, np.newaxis]**3

        return B_magnitude

    @staticmethod
    def calculate_magnetic_field(dipoles, X, Y):
        # 初始化磁场
        B_field = np.zeros((X.shape[0], X.shape[1], 2))

        # 计算每个磁偶极子的磁场并叠加
        for dipole in dipoles:
            dipole_field = dipole.magnetic_field(X, Y)
            B_field[:, :, 0] += dipole_field[:, :, 0]  # 添加 x 分量
            B_field[:, :, 1] += dipole_field[:, :, 1]  # 添加 y 分量

        # 计算磁场的分量
        Bx = B_field[:, :, 0]
        By = B_field[:, :, 1]
        return Bx, By

    @staticmethod
    def plot_magnetic_field(X, Y, Bx, By):
        plt.figure(figsize=(10, 10))

        # 使用 streamplot 绘制磁场线
        # plt.streamplot(X, Y, Bx, By, color='b', linewidth=1.5, density=1.5)
        # 归一化箭头长度
        arrow_length = 0.3  # 设置箭头的标准长度
        B_magnitude = np.sqrt(Bx**2 + By**2)  # 计算每个点的磁场大小
        Bx_normalized = Bx / B_magnitude * arrow_length  # 归一化并调整箭头长度
        By_normalized = By / B_magnitude * arrow_length

        # 使用 quiver 绘制箭头
        plt.quiver(X, Y, Bx_normalized, By_normalized, color='b', angles='xy', scale_units='xy', scale=1)

        # 绘制磁偶极子位置
        for dipole in dipoles:
            plt.plot(dipole.position[0], dipole.position[1], 'ro', markersize=10)

        plt.xlim(-5, 5)
        plt.ylim(-5, 5)
        plt.title('Magnetic Field of Multiple Magnetic Dipoles')
        plt.xlabel('x (m)')
        plt.ylabel('y (m)')
        plt.grid()
        plt.axis('equal')
        plt.show()

if __name__ == '__main__':
    # 创建多个磁偶极子
    dipoles = [
        MagneticDipole([1, 0], (-2, -2)),  # 磁偶极矩指向正x方向
        MagneticDipole([-1, 0], (2, 2)),   # 磁偶极矩指向负x方向
    ]

    # 定义网格
    x = np.linspace(-5, 5, 20)
    y = np.linspace(-5, 5, 20)
    X, Y = np.meshgrid(x, y)

    Bx, By = MagneticDipole.calculate_magnetic_field(dipoles, X, Y)

    # 绘制磁场线
    MagneticDipole.plot_magnetic_field(X, Y, Bx, By)


 浙公网安备 33010602011771号