

ISLR—第三章 Linear Regression
Linear Regression
-
几种常见的线性模型
1 简单的线性模型
2 多元线性回归
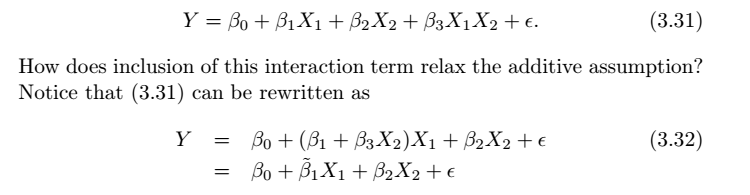
3 扩展线性回归
克服了多元线性模型 X1 与 X2 不协同作用的假设。
-
线性模型的评价指标
估计系数 ——最小二乘估计
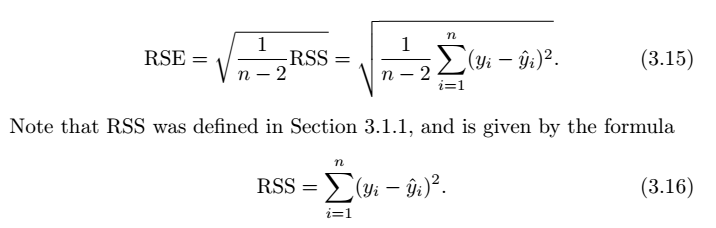
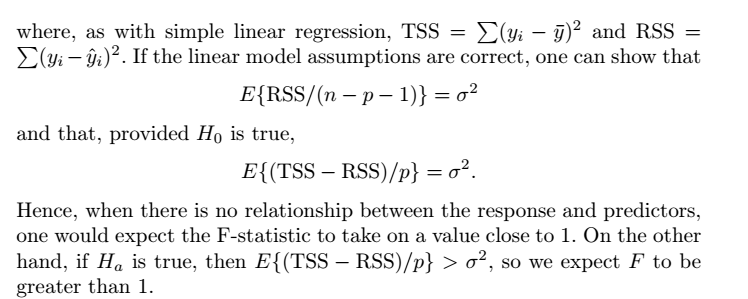
残差平方和(residual sum of squares,RSS)
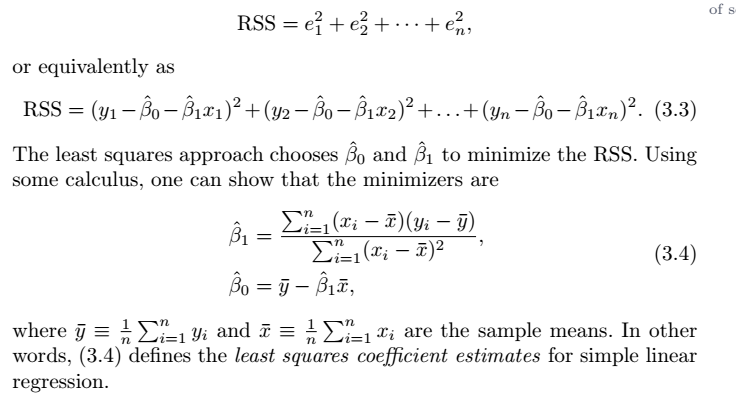
估计系数
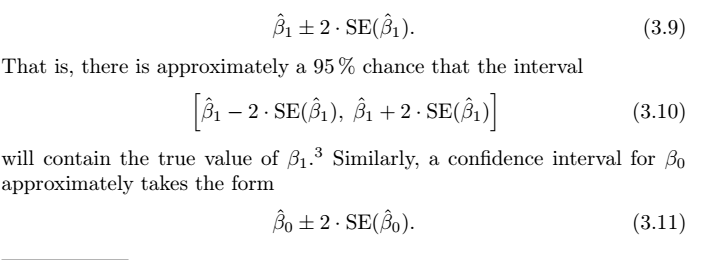
(1) SE(标准误差,standard error)
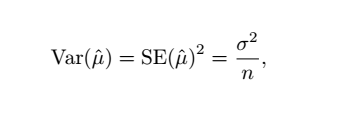
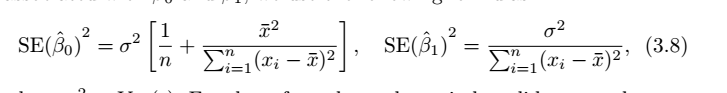
SE是用来计算置信区间的
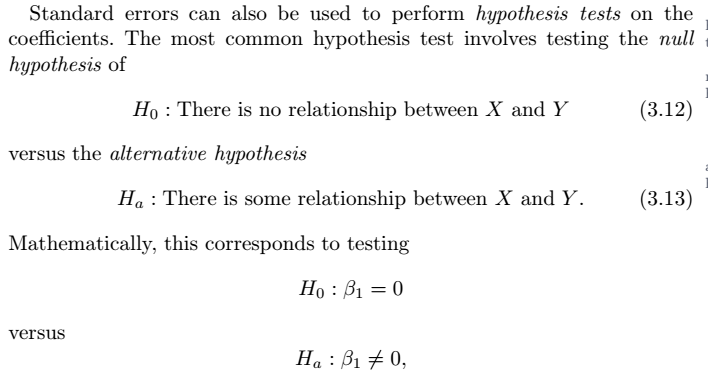
SE也可以用来进行假设检验
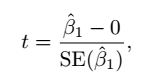
(2)t统计量 ( t-statistic )
t-statistic 有正负,比较时应取绝对值,绝对值大说明该变量X与Y有相关关系,这里,newspaper的t-statistic 参数为-0.18,明显newspaper变量与sales无明显的相关关系
(3)P值(p-value)
p-value 越小,越说明该X与Y相关,这个模型中,明显newspaper变量与sales无明显的相关关系,在之后的模型优化上应该舍弃这一变量(p81).
不能通过系数大小来判断变量是否和模型的相关关系(p134 3.c).
Consequently, it is a simple matter to compute the probability of observing any value equal to |t| or larger, assuming β1 = 0. We call this probability the p-value. Roughly speaking, we interpret the p-value as follows: a small p-value indicates that it is unlikely to observe such a substantial association between the predictor and the response due to chance, in the absence of any real association between the predictor and the response.
(4) RSE(残差标准误,Residual Standard Error)
RSE越小,说明训练模型越准确。
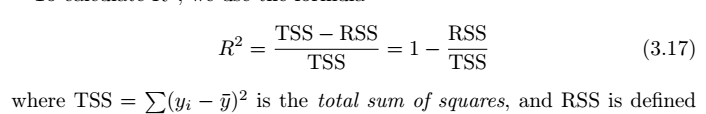
(5) R2-statistic(R^2统计量)
相比于RSE,R2 在0到1之间, R2 越大,越说明模型中Y与X相关
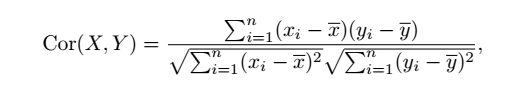
衡量了X和Y之间的线性
相关性(correlation)
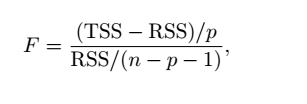
(6)F-statistic(F统计量)
可以评价sales与几个变量是否有关系。F-statistic是大于1的,相同数量的样本下F-statistic越大,越说明sales与几个变量越相关,至于比较小的值究竟是否相关,可以查询F-statistic表。这里,F-statistic为570,所以我们认为他们有关系。
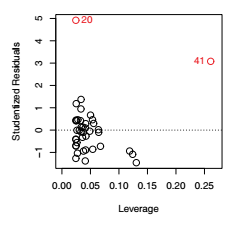
(7) studentized residuals(学生化残差)
studentized residuals是用来检测数据中的异常值的,一般某数据的studentized residuals的绝对值超过3就定性为异常值,需要进行处理如舍弃等。
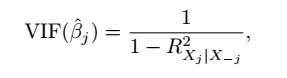
(8) VIF(方差膨胀因子)
VIF用来检测变量之间是否存在线性相关关系,VIF越大,越说明变量与其他变量存在线性相关关系,建议舍弃,或者与相关变量结合成为一个新的变量。
(9)TSS
-
Some important questions
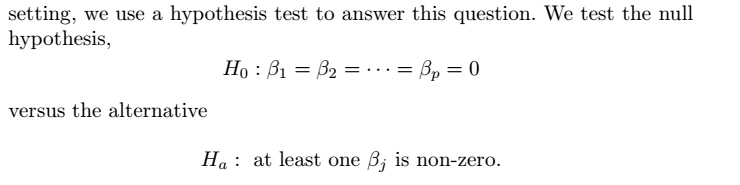
1. Is There a Relationship Between the Response and Predictors?
(1)在一元回归中只要判断系数是否为0
多元回归要判断所有的系数为0,只要有一个不为0假设则不成立
(2)F的判定条件和n,p的大小有关,可以查F分布表
When n is large, an F-statistic that is just a little larger than 1 might still provide evidence against H0. In contrast, a larger F-statistic is needed to reject H0 if n is small
(3) 对单独变量测试时,需要注意:
it seems likely that if any one of the p-values for the individual variables is very small, then at least one of the predictors is related to the response. However, this logic is flawed, especially when the number of predictors p is large
(4)不适用的情况:
sometimes we have a very large number of variables. If p > n then there are more coefficients βj to estimate than observations from which to estimate them. In this case we cannot even fit the multiple linear regression model using least squares, so the F-statistic cannot be used, and neither can most of the other concepts that we have seen so far in this chapter.
2. Deciding on Important Variables
所有p个变量的组合情况有 2^p 种,每一个都测试是不现实的
主要方法:
- Forward selection
从null model开始一个一个添加,到一定条件停止
这种增加法有一定的缺点,主要是,它不能反映后来变化的情况。因为对于某个自变量,它可能开始是显著的,即将其引入到回归方程,但是,随着以后其他自变量的引入,它也可能又变为不显著了,但是,并没有将其及时从回归方程中剔除掉。也就是增加变量法,只考虑引入而不考虑剔除。 - Backward selection (cannot be used if p > n)
这种减少法也有一个明显的缺点,就是一开始把全部变量都引入回归方程,这样计算量比较大。若对一些不重要的变量,一开始就不引入,这样就可以减少一些计算。 - Mixed selection
前面的两种方法各有其特点,若自变量X1,X2,...,Xk 完全是独立的,则可结合这两种方法,但是,在实际的数据中,自变量X1,X2,...,Xk之间往往并不是独立的,而是有一定的相关性存在的,这就会使得随着回归方程中变量的增加和减少,某些自变量对回归方程的贡献也会发生变化。因此一种很自然的想法是将前两种方法综合起来,也就是对每一个自变量,随着其对回归方程贡献的变化,它随时可能被引入回归方程或被剔除出去,最终的回归模型是在回归方程中的自变量均为显著,不在回归方程中的自变量均不显著。
3. Model Fit
An R2 value close to 1 indicates that the model explains a large portion
of the variance in the response variable-
R2An R2 value close to 1 indicates that the model explains a large portionof the variance in the response variable
-
RSEmodels with more variables can have higher RSE if the decrease in RSS is small relative to the increase in p.
- 图形 Graphical summaries can reveal problems with a model that are not visible from numerical statistics
4. Predictions
其中的不确定性:
- 预测时要考虑置信区间
- model bias
- Prediction intervals are always wider than confidence intervals
-
Potential Problems
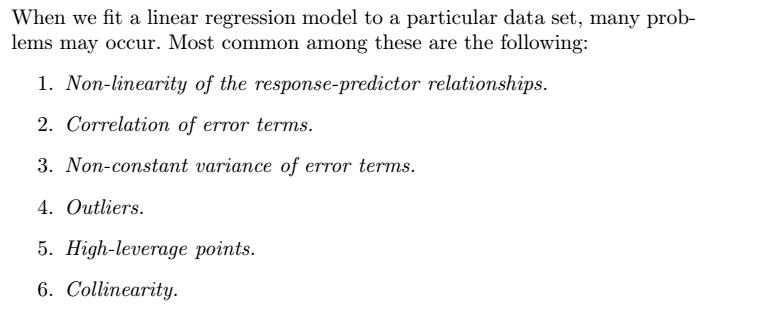
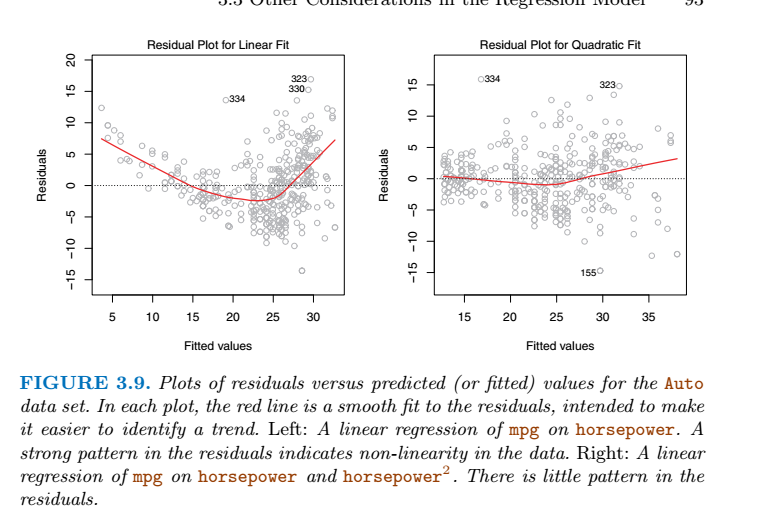
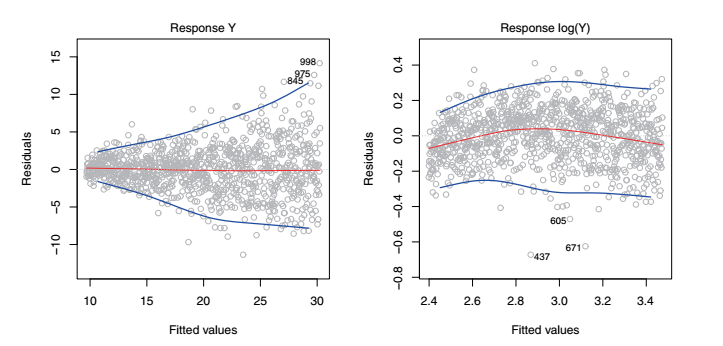
残差图
Correlation of error terms (误差项自相关)

Outliers 离群点
绘制学生化残差可以解决

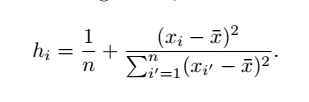
High-leverage points(高杠杆点)
In order to quantify an observation’s leverage, we compute the leverage
statistic.

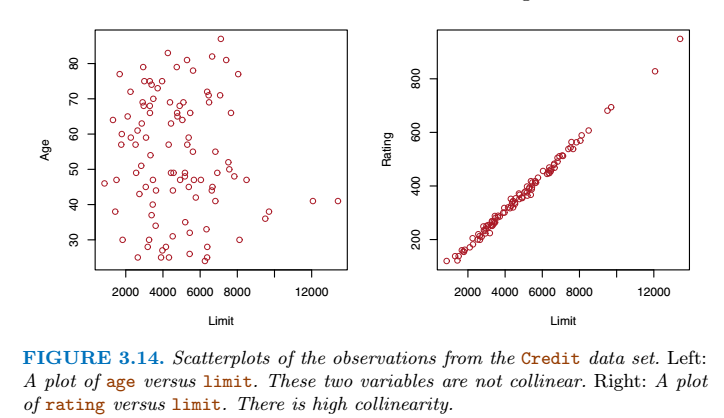
Collinearity(共线性)

-
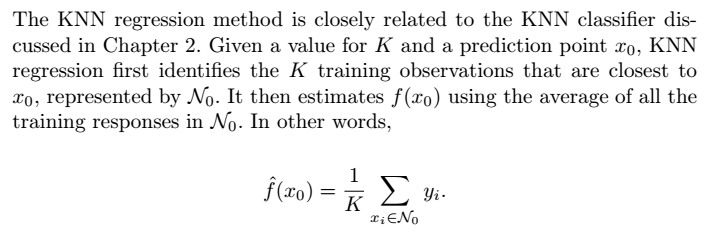
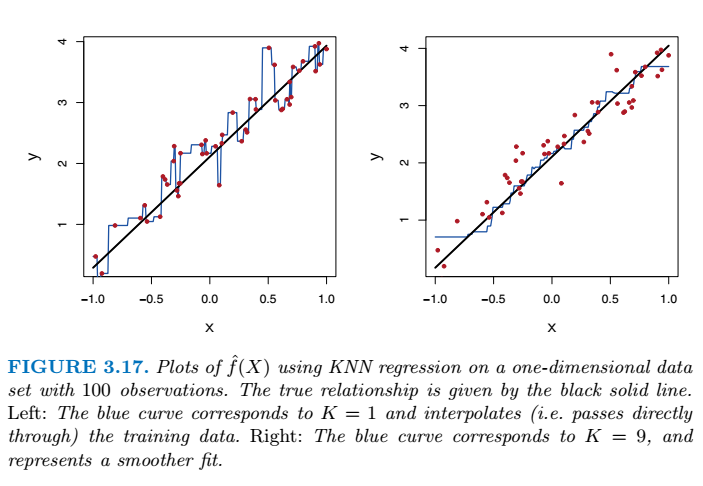
KNN回归
实验 线性回归
