
1)简介
edgeR作用对象是count文件,rows 代表基因,行代表文库,count代表的是比对到每个基因的reads数目。它主要关注的是差异表达分析,而不是定量基因表达水平。
edgeR works on a table of integer read counts, with rows corresponding to genes and columns to independent libraries. The counts represent the total number of reads aligning to each gene (or other genomic locus).edgeR is concerned with differential expression analysis rather than with the quantification of expression levels. It is concerned with relative changes in expression levels between conditions,but not directly with estimating absolute expression levels.
edgeR作用的是真实的比对统计,因此不建议用预测的转录本
Note that edgeR is designed to work with actual read counts. We not recommend that predicted transcript abundances are input the edgeR in place of actual counts.
归一化原因:
技术原因影响差异表达分析:
1)Sequencing depth:统计测序深度(即代表的是library size);
2)RNA composition:个别异常高表达基因导致其它基因采样不足
3)GC content: sample-specific effects for GC-content can be detected
4)sample-specific effects for gene length have been detected
注意:edgeR必须是原始表达量,而不能是rpkm等矫正过的。
Note that normalization in edgeR is model-based, and the original read counts are not themselves transformed. This means that users should not transform the read counts in any way before inputing them to edgeR. For example, users should not enter RPKM or FPKM values to edgeR in place of read counts. Such quantities will prevent edgeR from correctly estimating the mean-variance relationship in the data, which is a crucial to the statistical strategies underlying edgeR.Similarly, users should not add artificial values to the counts before inputing them to edgeR.
2)安装
if("edgeR" %in% rownames(installed.packages()) == FALSE) {source("http://bioconductor.org/biocLite.R");biocLite("edgeR")}
suppressMessages(library(edgeR))
ls('package:edgeR')
3)矩阵构建及差异分析
需要构建2个矩阵:1、表达矩阵;2、分组矩阵( 实验设计);
-------------------------------------------------------表达矩阵-----------------------------------------
3.1、读取表达矩阵文件(Reading in the data)
#读取文件
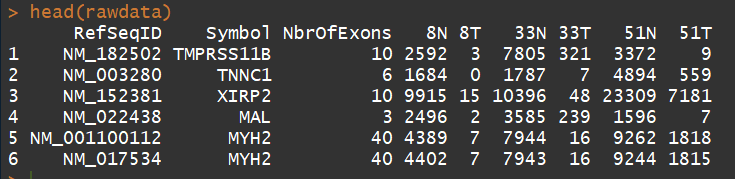
rawdata <- read.delim("E:/software/R/R-3.5.0/library/edgeR/Meta/TableS1.txt", check.names=FALSE, stringsAsFactors=FALSE)
head(rawdata)
3.2 、构建DGEList对象
这里因为已经有rawdata的count文件,因此直接用DGEList()函数就行了,否则要用readDGE()函数
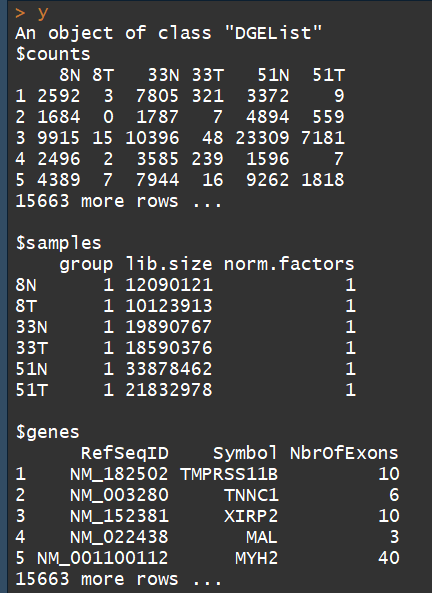
y <- DGEList(counts=rawdata[,4:9], genes=rawdata[,1:3])##构建DGEList对象
DGEList对象主要有三部分:
1、counts矩阵:包含的是整数counts;
2、samples数据框:包含的是文库(sample)信息。包含 lib.size列 :for the library size (sequencing depth) for each sample,如果不自定义, the library sizes will be computed from the column sums of the counts。其中还有一个group列,用于指定每个sample组信息
3、一个可选的数据框genes:gene的注释信息
3.3)数据注释( Annotation)
这里主要是因为该文章数据是前好多年的,因此需要过滤,symbol更新等。
1)The study was undertaken a few years ago, so not all of the RefSeq IDs provided by match RefSeq IDs currently in use. We retain only those transcripts with IDs in the current NCBI annotation, which is provided by the org.HS.eg.db package
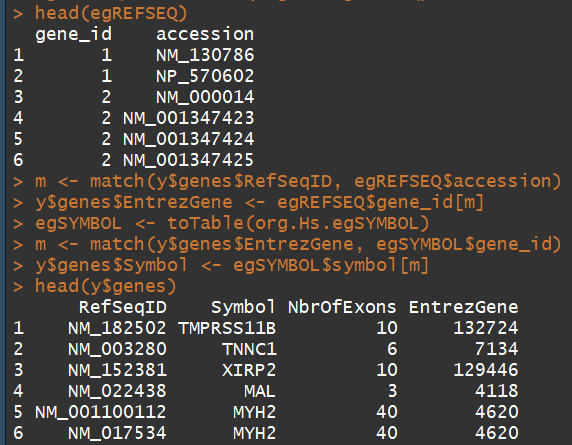
2)因为edgeR默认使用NCBI中refSeq的ID,所以通过refseq Id 找到entrezID,然后通过entrezID对symbol更新
#######retain only those transcripts with IDs in the current NCBI annotation provided by the org.HS.eg.db######
library(org.Hs.eg.db)
idfound <- y$genes$RefSeqID %in% mappedRkeys(org.Hs.egREFSEQ)
y <- y[idfound,]
dim(y)  ##15550 6
###################### 在注释中加入  Entrez Gene IDs #########################
egREFSEQ <- toTable(org.Hs.egREFSEQ)
m <- match(y$genes$RefSeqID, egREFSEQ$accession)
y$genes$EntrezGene <- egREFSEQ$gene_id[m]
#####################用Entrez Gene IDs更新gene symbols##########################
egSYMBOL <- toTable(org.Hs.egSYMBOL)
m <- match(y$genes$EntrezGene, egSYMBOL$gene_id)
y$genes$Symbol <- egSYMBOL$symbol[m]
head(y$genes)
3.4) 过滤和归一化(Filtering and normalization)
过滤一:Different RefSeq transcripts for the same gene symbol count predominantly the same reads. So we keep one transcript for each gene symbol. We choose the transcript with highest overall count:
o <- order(rowSums(y$counts), decreasing=TRUE)
y <- y[o,]
d <- duplicated(y$genes$Symbol)
y <- y[!d,]
nrow(y)
过滤二:Normally we would also filter lowly expressed genes.For this data, all transcripts already have at least 50 reads for all samples of at least one of the tissues types.
y$samples$lib.size <- colSums(y$counts)  #Recompute the library sizes
###############################Use Entrez Gene IDs as row names:#####################
rownames(y$counts) <- rownames(y$genes) <- y$genes$EntrezGene
y$genes$EntrezGene <- NULL
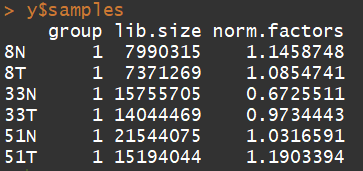
归一化:TMM normalization is applied to this dataset to account for compositional difference between the libraries.
y <- calcNormFactors(y)
y$samples
3.5) 数据的探索(Data exploration)
样本间关系(samples for outliers and for other relationships)
plotMDS(y)
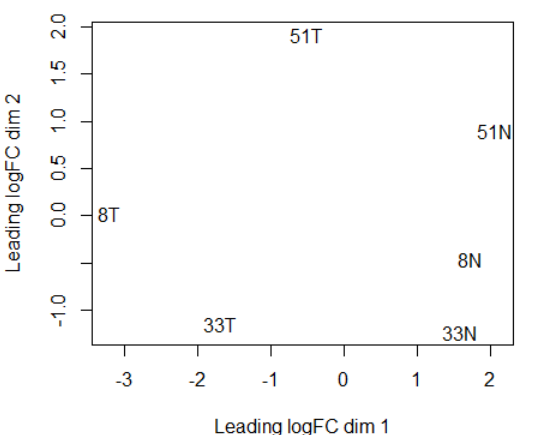
PC1将tumor和nomal组分开,PC2 大略和病号对应。也侧面体现了肿瘤组的异质性
--------------------------分组矩阵(根据实验设计、目的)--------------------------------
Here we want to test for differential expression between tumour and normal tissues within patients, i.e. adjusting for differences between patients.
Patient <- factor(c(8,8,33,33,51,51))
Tissue <- factor(c("N","T","N","T","N","T"))
data.frame(Sample=colnames(y),Patient,Tissue)
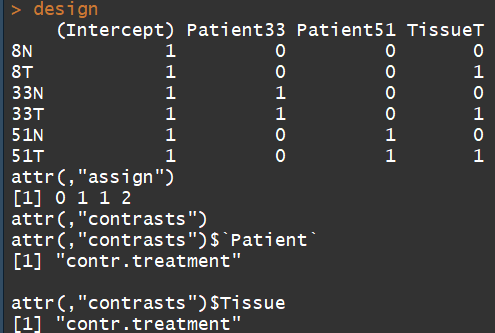
design <- model.matrix(~Patient+Tissue)
rownames(design) <- colnames(y)
design
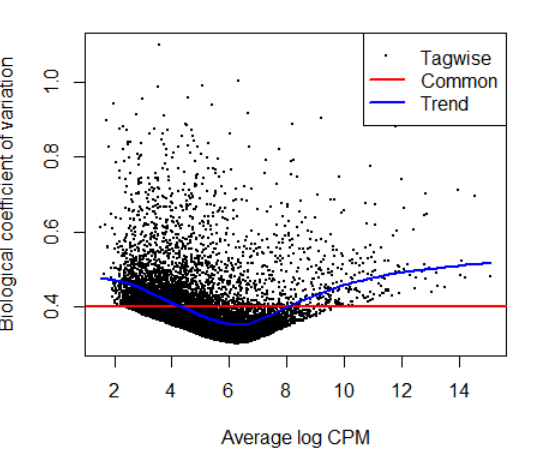
3.4)Estimating the dispersion(estimate the NB dispersion for the dataset.)
y <- estimateDisp(y, design, robust=TRUE)
y$common.dispersion    #0.1594505
plotBCV(y)
-----------------------------------差异分析-----------------------------------------
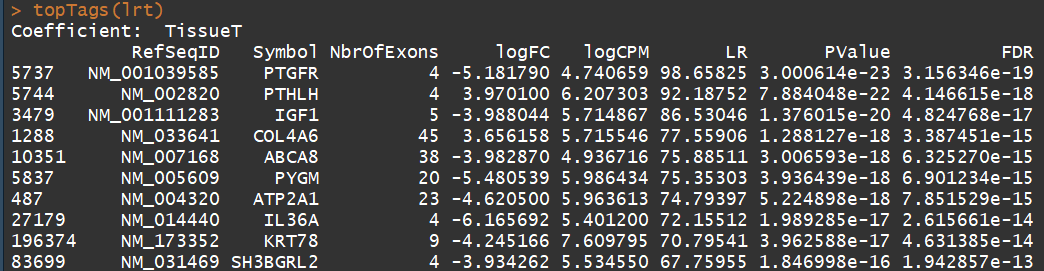
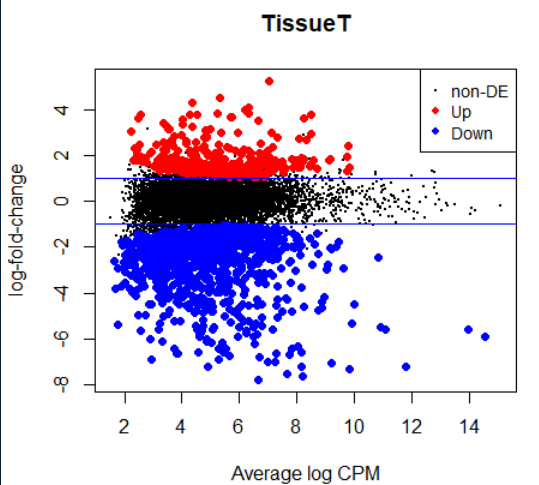
3.5) 差异分析(Differential expression)
fit <- glmFit(y, design)
lrt <- glmLRT(fit)
topTags(lrt)
summary(decideTests(lrt))
plotMD(lrt)
abline(h=c(-1, 1), col="blue")
![]()
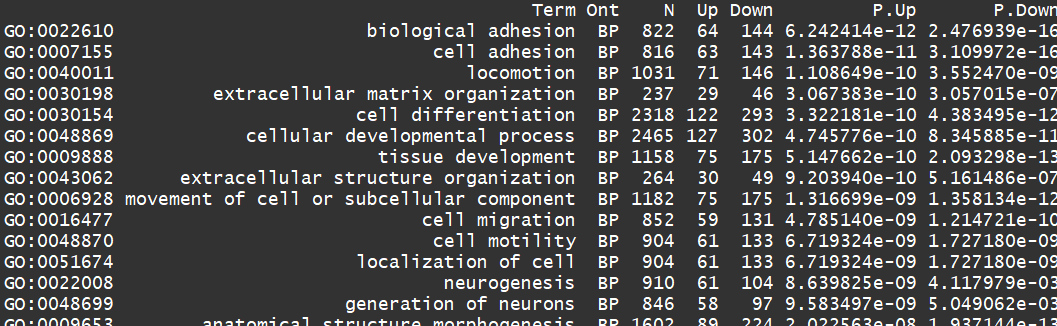
------------------------------- Gene ontology analysis----------------------------------------
对上调的基因进行BP分析
go <- goana(lrt)
topGO(go, ont="BP", sort="Up", n=30)

 浙公网安备 33010602011771号