1、Wilcoxon Signed Rank Test
Wilcoxon有符号秩检验(也称为Wilcoxon有符号秩和检验)是一种非参数检验。当统计数据中使用“非参数”一词时,并不意味着您对总体一无所知。这通常意味着总体数据没有正态分布。如果两个数据样本来自重复观察,那么它们是匹配的。利用Wilcoxon Signed-Rank检验,在不假设数据服从正态分布的前提下,判断出相应的数据总体分布是否相同如果数据对之间的差异是非正态分布的,则应使用Wilcoxon有符号秩检验。
The Wilcoxon signed rank test (also called the Wilcoxon signed rank sum test) is a non-parametric test. When the word “non-parametric” is used in stats, it doesn’t quite mean that you know nothing about the population. It usually means that you know the population data does not have a normal distribution. The Wilcoxon signed rank test should be used if the differences between pairs of data are non-normally distributed.
有两个稍微不同的测试版本:
Wilcoxon符号秩检验将样本中值与假设中值进行比较。
Wilcoxon匹配对有符号秩检验计算每组匹配对之间的差异,然后按照与有符号秩检验相同的步骤将样本与某个中值进行比较。
Two slightly different versions of the test exist:
    The Wilcoxon signed rank test compares your sample median against a hypothetical median.
    The Wilcoxon matched-pairs signed rank test computes the difference between each set of matched pairs, then follows the same procedure as the signed rank test to compare the sample against some median.
这个检验的零假设是两个样本的中位数相等。它通常用于:
作为单样本t检验或配对t检验的非参数替代。
对于没有数字刻度的有序(排序)分类变量。
The null hypothesis for this test is that the medians of two samples are equal. It is generally used:
    As a non-parametric alternative to the one-sample t test or paired t test.
    For ordered (ranked) categorical variables without a numerical scale.
2、How to Run the Test by Hand
运行测试的要求:
必须匹配数据。
因变量必须是连续的(即您必须能够区分小数点后第n位的值)。
你应该没有并列的队伍,以达到最高的准确性。如果等级是相等的,有一个变通方法(见下面步骤5之后)。
Requirements for running the test:
    Data must be matched.
    The dependent variable must be continuous (i.e. you must be able to distinguish between values at the nth decimal place).
    You should have no tied ranks for maximum accuracy. If ranks are tied, there is a workaround (see below, after Step 5).
3、手动计算
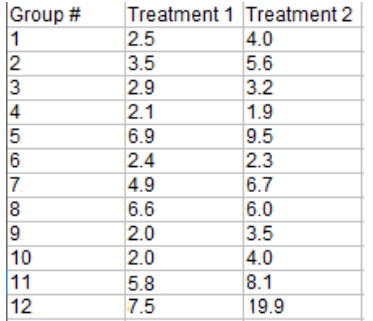
样本问题:以下2组治疗数据的中值是否存在差异?

Step 1: 从治疗1中减去治疗2得到差异

注意:如果你只有一个样本,计算每个变量和0之间的差(假设中值),而不是对之间的差
Note: If you only have one sample, calculate the differences between each variable and zero (the hypothesized median) instead of the difference between pairs.
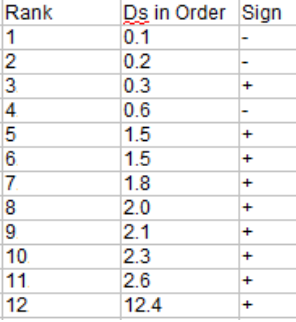
Step 2:将差异按顺序排列(下图第二列),然后进行排序。按顺序排列时忽略这个符号。

Step 3:创建第三列,并注意差异的符号(您在步骤2中忽略的那个)

Step 4: 计算负差的秩和(第3步图中带负号的秩和)。你在这里加起来,而不是实际的差异:
W– = 1 + 2 + 4 = 7
Step 5:计算正差异的秩和(步骤3图中带正号的)。
W+ = 3 + 5.5 + 5.5 + 7 + 8 + 9 + 10 + 11 + 12 = 71
Step 6:使用带有Wilcoxin符号秩的正态逼近
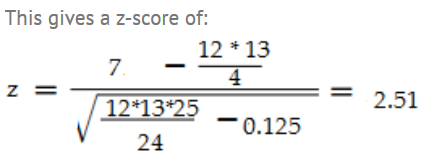
你可以利用以上资料做些什么?如果观测值/对 n(n+1)/2大于20,可以使用正态逼近。这组数据满足这个要求(12(12 + 1)/ 2 = 78。z分数公式有几个修改/注意事项:
使用W+或W-中较小的值作为测试统计量。
使用以下公式的意思是,μ:n(n + 1)/ 4。
使用以下公式σ:√(n(n + 1)(2 n + 1)/ 24)
如果你有tied ranks,你必须减少t3-tσ/ 48 t的行列。有两个并列排名(5.5 + 5.5),所以减少8-2/48σ= 0.125。

在z表中查找这个分数,我们得到面积为0.9880,等于双尾p值为0.012。这是一个很小的p值,这是一个强有力的迹象,表明中位数是显著不同的。
4、用R计算Wilcoxin
在名为immer的内建数据集中,记录了1931年和1932年同一领域的大麦产量。收益率数据显示在数据框的Y1和Y2列中。
问题(problem):在不假设数据为正态分布的情况下,以0.05显著性水平检验数据集immer中1931年和1932年的大麦产量是否具有相同的数据分布。
Solution:
零假设是两个样本年的大麦产量是相同的。为了验证这个假设,我们使用wilcox。测试函数对匹配的样本进行比较。对于配对测试,我们将“配对”参数设置为TRUE。由于p值为0.005318,小于0.05的显著性水平,我们拒绝原假设。
The null hypothesis is that the barley yields of the two sample years are identical populations. To test the hypothesis, we apply the wilcox.test function to compare the matched samples. For the paired test, we set the "paired" argument as TRUE. As the p-value turns out to be 0.005318, and is less than the .05 significance level, we reject the null hypothesis.

wilcox.test(immer$Y1, immer$Y2, paired=TRUE) ,#其中其它参数如 exact, correct选择不同的话,可能p值结果不同,根据实际情况选择

5、python计算
import scipy.stats
x=[57.07168,46.95301,31.86423,38.27486,77.89309,76.78879,33.29809,58.61569,18.26473,62.92256,50.46951,19.14473,22.58552,24.14309]
y=[8.319966,2.569211,1.306941,8.450002,1.624244,1.887139,1.376355,2.521150,5.940253,1.458392,3.257468,1.574528,2.338976]
scipy.stats.ranksums(x, y)


