1、What are “Parametric Statistics”?
统计中的参数指的是总体的一个方面,而不是统计中的一个方面,后者指的是样本的一个方面。例如,总体均值是一个参数,而样本均值是一个统计量。参数统计检验对总体参数和数据的分布进行假设。这些类型的测试包括学生的T测试和方差分析测试,假设数据来自正态分布。
A parameter in statistics refers to an aspect of a population, as opposed to a statistic, which refers to an aspect about a sample. For example, the population mean is a parameter, while the sample mean is a statistic. A parametric statistical test makes an assumption about the population parameters and the distributions that the data came from. These types of test includes Student’s T tests and ANOVA tests, which assume data is from a normal distribution.
与此相反的是非参数检验,它不假设任何关于总体参数的东西。非参数检验包括卡方检验、Fisher’s exact test和Mann-Whitney检验。
The opposite is a nonparametric test, which doesn’t assume anything about the population parameters. Nonparametric tests include chi-square, Fisher’s exact test and the Mann-Whitney test.
每一个参数检验都一个非参数检验相对应。例如,如果您有来自两个独立组的参数数据,您可以运行一个2样本t检验来比较平均值。如果有非参数数据,可以运行Wilcoxon秩和检验来比较平均值。
Every parametric test has a nonparametric equivalent. For example, if you have parametric data from two independent groups, you can run a 2 sample t test to compare means. If you have nonparametric data, you can run a Wilcoxon rank-sum test to compare means.
2、Parametric Data Definition
假设从某一特定分布中抽取的数据,用于参数检验。
Data that is assumed to have been drawn from a particular distribution, and that is used in a parametric test.
------------------------------------------------------------华丽丽的分割线------------------------------------------
3、What is a Non Parametric Test?
非参数检验(有时称为无分布检验)不假定底层分布的任何内容(例如,数据来自正态分布)。这与参数检验相比,参数检验对总体参数(例如,均值或标准差)进行假设;在stats中使用“非参数”一词并不意味着您对总体一无所知。这通常意味着总体数据没有正态分布。
A non parametric test (sometimes called a distribution free test) does not assume anything about the underlying distribution (for example, that the data comes from a normal distribution). That’s compared to parametric test, which makes assumptions about a population’s parameters (for example, the mean or standard deviation); When the word “non parametric” is used in stats, it doesn’t quite mean that you know nothing about the population. It usually means that you know the population data does not have a normal distribution.
例如,单因素方差分析的一个假设是数据来自正态分布。如果你的数据不是正态分布的,你就不能进行方差分析,但是你可以进行非参数替代——Kruskal-Wallis测试。
For example, one assumption for the one way ANOVA is that the data comes from a normal distribution. If your data isn’t normally distributed, you can’t run an ANOVA, but you can run the nonparametric alternative–the Kruskal-Wallis test.
如果可能的话,你应该给我们参数化测试,因为它们往往更准确。参数化检验具有更大的统计能力,这意味着它们可能会发现一个真正重要的影响。只有在必要时才使用非参数检验(例如,您知道像正态性这样的假设正在被违反)。如果样本量足够大(通常每组15-20个项目),非参数测试可以很好地处理非正态连续数据
If at all possible, you should us parametric tests, as they tend to be more accurate. Parametric tests have greater statistical power, which means they are likely to find a true significant effect. Use nonparametric tests only if you have to (i.e. you know that assumptions like normality are being violated). Nonparametric tests can perform well with non-normal continuous data if you have a sufficiently large sample size (generally 15-20 items in each group).
4、When to use it
当数据时,使不是正态分布的时候用非参数测试。因此关键是找出是否有正态分布的数据。例如,您可以查看数据的分布。如果您的数据接近正态,那么您可以使用参数统计测试
Non parametric tests are used when your data isn’t normal. Therefore the key is to figure out if you have normally distributed data. For example, you could look at the distribution of your data. If your data is approximately normal, then you can use parametric statistical tests.
问:如果没有图,如何判断数据是否正态分布?
答:使用Excel等软件检查分布的偏度和峰度
Q. If you don’t have a graph, how do you figure out if your data is normally distributed?
A. Check the skewness and Kurtosis of the distribution using software like Excel
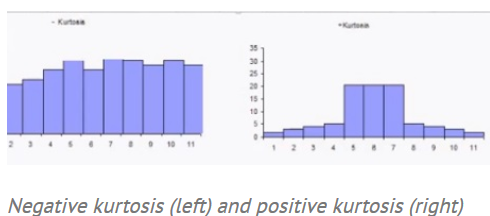
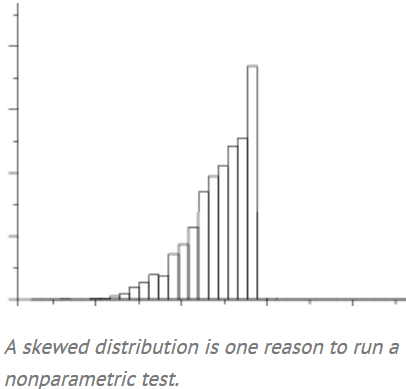
正态分布没有偏态。基本上,它是一个中心对称的形状。峰度是指有多少数据位于尾部和中心。正态分布的偏态和峰度约为1。
A normal distribution has no skew. Basically, it’s a centered and symmetrical in shape. Kurtosis refers to how much of the data is in the tails and the center. The skewness and kurtosis for a normal distribution is about 1.

如果您的分布不是正态分布(换句话说,偏度和峰度与1.0相差很大),则应该使用非参数检验,如卡方检验。否则你将冒着结果毫无意义的风险。
If your distribution is not normal (in other words, the skewness and kurtosis deviate a lot from 1.0), you should use a non parametric test like chi-square test. Otherwise you run the risk that your results will be meaningless.
5、Data Types
您的数据允许进行参数测试,还是必须使用非参数测试,比如卡方测试?经验法则是:
对于标称尺度或序数尺度,使用非参数统计。
对于区间量表或比例量表,使用参数统计。
Does your data allow for a parametric test, or do you have to use a non parametric test like chi-square? The rule of thumb is:

    For nominal scales or ordinal scales, use non parametric statistics.
    For interval scales or ratio scales use parametric statistics.
运行非参数测试的其他原因:
参数检验的一个或多个假设已经被违反。
您的样本量太小,无法进行参数化测试。
您的数据有无法删除的异常值。
你需要测试中值而不是平均值(如果分布非常倾斜,你可能需要这样做)
Other reasons to run nonparametric tests:

    One or more assumptions of a parametric test have been violated.
    Your sample size is too small to run a parametric test.
    Your data has outliers that cannot be removed.
    You want to test for the median rather than the mean (you might want to do this if you have a very skewed distribution)

6、Types of Nonparametric Tests
当在统计中使用“parameter”一词时,它通常指ANOVA或t检验等测试。这些测试都假设总体数据具有正态分布。非参数不假定数据是正态分布的。在基本统计中,您可能遇到的惟一非参数测试是卡方测试。然而,还有其他几个。例如:Kruskal Willis检验是单因素方差分析的非参数选择Mann Whitney是两个样本t检验的非参数选择。
When the word “parametric” is used in stats, it usually means tests like ANOVA or a t test. Those tests both assume that the population data has a normal distribution. Non parametric do not assume that the data is normally distributed. The only non parametric test you are likely to come across in elementary stats is the chi-square test. However, there are several others. For example: the Kruskal Willis test is the non parametric alternative to the One way ANOVA and the Mann Whitney is the non parametric alternative to the two sample t test.
The main nonparamteric tests are:
- 1-sample sign test. Use this test to estimate the median of a population and compare it to a reference value or target value.
- 1-sample Wilcoxon signed rank test. With this test, you also estimate the population median and compare it to a reference/target value. However, the test assumes your data comes from a symmetric distribution (like the Cauchy distribution or uniform distribution).
- Friedman test. This test is used to test for differences between groups with ordinal dependent variables. It can also be used for continuous data if the one-way ANOVA with repeated measures is inappropriate (i.e. some assumption has been violated).
- Goodman Kruska’s Gamma: a test of association for ranked variables.
- Kruskal-Wallis test. Use this test instead of a one-way ANOVA to find out if two or more medians are different. Ranks of the data points are used for the calculations, rather than the data points themselves.
- The Mann-Kendall Trend Test looks for trends in time-series data.
- Mann-Whitney test. Use this test to compare differences between two independent groups when dependent variables are either ordinal or continuous.
- Mood’s Median test. Use this test instead of the sign test when you have two independent samples.
- Spearman Rank Correlation.Use when you want to find a correlation between two sets of data.
7、The following table lists the nonparametric tests and their parametric alternatives.
| Nonparametric test | Parametric Alternative |
|---|---|
| 1-sample sign test | One-sample Z-test, One sample t-test |
| 1-sample Wilcoxon Signed Rank test | One sample Z-test, One sample t-test |
| Friedman test | Two-way ANOVA |
| Kruskal-Wallis test | One-way ANOVA |
| Mann-Whitney test | Independent samples t-test |
| Mood’s Median test | One-way ANOVA |
| Spearman Rank Correlation | Correlation Coefficient |
8、Advantages and Disadvantages
与参数化测试相比,非参数化测试具有以下几个优点:
当参数检验的假设被违反时,统计功率更大。当假设没有被违背时,它们几乎同样强大。
更少的假设(即常态假设不适用)。
样本量小是可以接受的。
它们可以用于所有数据类型,包括标称变量、区间变量或有异常值或测量不精确的数据。
Compared to parametric tests, nonparametric tests have several advantages, including:
    More statistical power when assumptions for the parametric tests have been violated. When assumptions haven’t been violated, they can be almost as powerful.
    Fewer assumptions (i.e. the assumption of normality doesn’t apply).
    Small sample sizes are acceptable.
    They can be used for all data types, including nominal variables, interval variables, or data that has outliers or that has been measured imprecisely.
然而,他们也有他们的缺点。最值得注意的是:
如果假设没有被违背,它的功能就没有参数化测试强大。
手工计算更加劳动密集型(对于计算机计算来说,这不是问题)。
许多测试的临界值表并没有包含在许多计算机软件包中。这与通常包含的参数化测试表(如z表或t表)进行了比较
However, they do have their disadvantages. The most notable ones are:
    Less powerful than parametric tests if assumptions haven’t been violated.
    More labor-intensive to calculate by hand (for computer calculations, this isn’t an issue).
    Critical value tables for many tests aren’t included in many computer software packages. This is compared to tables for parametric tests (like the z-table or t-table) which usually are included.
9、参考文献
https://www.investopedia.com/terms/n/nonparametric-statistics.asp
https://www.statisticshowto.datasciencecentral.com/parametric-and-non-parametric-data/


