1、R和Rstudio下载地址
https://cran.rstudio.com/a
2、Rstudio 的配置
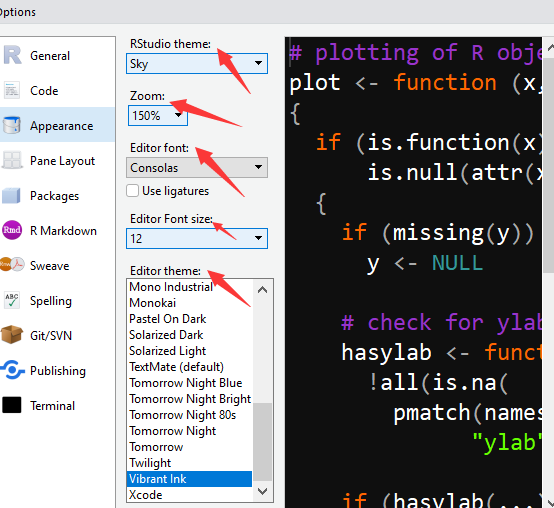
外观、代码显示比例配置
选中tools

选中globle options

选中appearance

选择主题、缩放比例、字体、字体大小

---------------------------------------------华丽丽的分割线----------------------------------------------------
3、R简介
执行特定功能最基本的是R包,在使用前必须先从一些库(repository)中下载,并载入。两个最流行的R库是CRAN和Bioconductor(主要用于处理高通量测序数据)。默认情况下,R从CRAN抓取包,但根据需要你可以更换库,比如Biocondutor,,去获取其它CRAN库中没有的包。更换库不等于更换镜像,镜像是指同一个库(repository) at a different location,一个库可以含有许多镜像。
4、基本使用简介
4.0) 工作环境
>getwd() # 当前工作目录
>setwd('path/to/directory') #更换工作目录
4.1) 安装包
安装几个重要的R包:
install.packages("BiocManager")
BiocManager::install("leaflet")
BiocManager::install("ggmap")
BiocManager::install("spData")
BiocManager::install("spDataLarge")
BiocManager::install("raster")
BiocManager::install("sf")
library("leaflet")
library("raster")
library("spData")
library("ggmap")
library("sf")
>install.packages('packagesname',dependency=TRUE)
>install.packages('path/to/packages.tar.gz',repos=NULL,type='source') ##从本地文件安装4.2)查看包
查看所有的包
>library()

查看默认包
>getOption('defaultPackages')
查看当前环境中所含有的包
print(.packages())
查看包里面所有的函数
>ls("package:GenomicFeatures")
4.3) 帮助文档
help(sum) 或者 ?sum
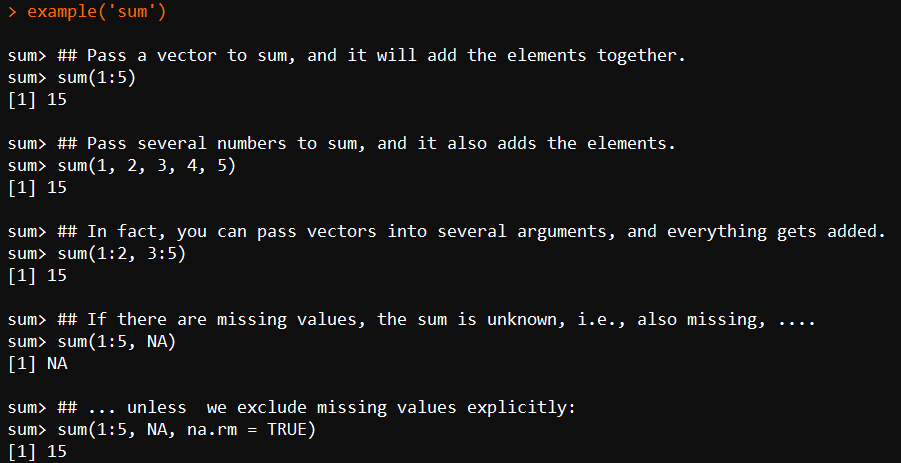
用例子来展示函数:
example(sum)

利用关键字搜素帮助文档:
>help.search('sum')
通过包名收索帮助文档:
>help(package='base')
4.4) 退出
q()
5)读取数据
5.1)对于R内置数据
>data(iris)
>load(file='mydata.RData') #载入数据对象
5.2)读取外部文件
>Mydata <- read.table('file',header='True',sep='\t',rowname=1)
>Mydata <- read.csv('file.csv')
5.3)读取excel文件
>install.packages('xlsx',dependeces=TRUE)
>library(gdata)
>mydata <- read.xlsx('mydata.xlsx')
5.4)数据探索
>class(iris)
>dim(iris)
>head(iris)
>tail(iris)
6) 保存数据
>wirte.table(x,file='myexcel.xls',append=false,quote=true,sep=' ') ##保存为table文件
>write.csv(x,col.names=NA,sep=',') ##保存为csv文件
>save(D,file='mydata.RData') ##保存为数据对象
--------------------------------------------------------------华丽丽的分割线----------------------------------------
7、R中索引方式
在R中,索引体系是[rows, columns]。
数据框$数据框名 :表示该数据框中该列所有的数据。
These functions use R indexing with named columns (the $ sign) or index numbers. The $ sign placed after the data followed by the column name specifies the data in that column. The R indexing system for data frames is very simple, just like other scripting languages, and is represented as [rows, columns].You can represent several indices for rows and columns using the c operator . A minus(减号) sign on the indices for rows/columns removes these parts of the data. The rbind function used earlier combines the data along the rows (row-wise,行向), whereas cbind does the same along the columns (column-wise,列向).
7.1)下面举例来说,首先载入数据
data(iris)    ##载入数据
str(iris)     ##观察数据结构


7.2) 获取特定列数据,组成一个数据框,存放到myiris对象中
myiris <- iris[,c(1,2,5)]  #虽然这种方法在实际应用中最好尽量去避免,这种写法。
View(myiris)
ls()
rm(myiris)
myiris <- iris[,-c(3,4)] #减号表示去除相应的数据,虽然这种方法也行,但在实际应用中最好尽量去避免
View(myiris)
ls()
rm(myiris)
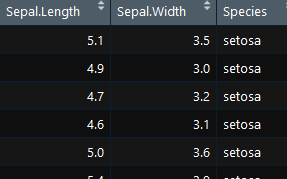
myiris=data.frame(Sepal.Length=iris$Sepal.Length, Sepal.Width=iris$Sepal.Width,
                        Species= iris$Species)#提取指定列,通过datafram函数构建数据框,存放到myiris对象中
View(myiris)

7.3)添加额外列(column)到数据框中
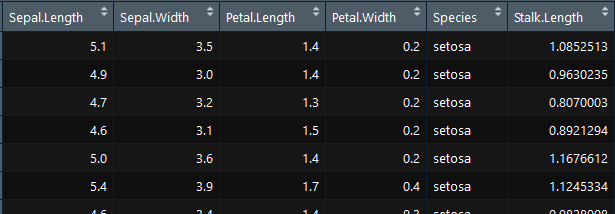
Stalk.Length <-c(rnorm(30,1,0.1),rnorm(30,1.3,0.1), rnorm(30,1.5,0.1),rnorm(30,1.8,0.1), rnorm(30,2,0.1))   #获取150个数据,
myiris <- cbind(iris, Stalk.Length)  #cbind,将Stalk.Length列合并到iris框中

dim(myiris)
colnames(myiris) #获取列名

7.4)添加额外行(raw)到数据框
newdat <- data.frame(Sepal.Length=10.1, Sepal.Width=0.5, Petal.Length=2.5, Petal.Width=0.9, Species="myspecies")
myiris <- rbind(iris, newdat)  #合并行
dim(myiris)
myiris[151,]   #查看最后加入的行
rownames(myiris) #这里相当于行号


7.5) 按照一定规则提取数据子集
mynew.iris <- subset(myiris, Sepal.Length == 5.0) #提取符合Sepal.Length=5.0的数据
rownames(mynewiris) #注意观察rownames是什么,是符合上述条件的数据所在的行号


也可以不用subset函数,用以下方法:
rm(mynew.iris)
mynew.iris <- myiris[myiris$Sepal.Length == 5.0, ]

删除所有数据对象。
rm(list=ls())
另外一种方法是使用%in%方法
data(iris)
mylength <- c(4,5,6,7,7,2)
mynew.iris <- iris[iris[,1] %in% mylength,]


