画图charts库的使用方法
之前装好了charts库,现在可以用来画图了,给出柱状图、折线图、饼图的样例如下:
import charts
#柱状图
series = [
 {'name': '北京二手平板电脑', 'data': [1525], 'type': 'column'},
 {'name': '北京二手手机', 'data': [2822], 'type': 'column'},
 {'name': '北京二手家电', 'data': [18863], 'type': 'column'},
 {'name': '北京二手笔记本', 'data': [2651], 'type': 'column'},
 {'name': '北京其他二手物品', 'data': [1143], 'type': 'column'},
 {'name': '北京二手母婴/儿童用品', 'data': [7819], 'type': 'column'},
 {'name': '北京二手文体/户外/乐器', 'data': [9510], 'type': 'column'},
 {'name': '北京二手台式机/配件', 'data': [4855], 'type': 'column'},
 {'name': '北京二手数码产品', 'data': [7666], 'type': 'column'},
 {'name': '北京二手设备', 'data': [1639], 'type': 'column'},
 {'name': '北京二手图书/音像/软件', 'data': [4221], 'type': 'column'},
 {'name': '北京二手服装/鞋帽/箱包', 'data': [9990], 'type': 'column'},
 {'name': '北京二手美容/保健', 'data': [2794], 'type': 'column'},
 {'name': '北京二手家具', 'data': [4891], 'type': 'column'},
 {'name': '北京二手办公用品/设备', 'data': [6461], 'type': 'column'}
]
charts.plot(series, show='inline', options=dict(title=dict(text='二手物品分类发帖量')))  #show='inline'图片在本页显示

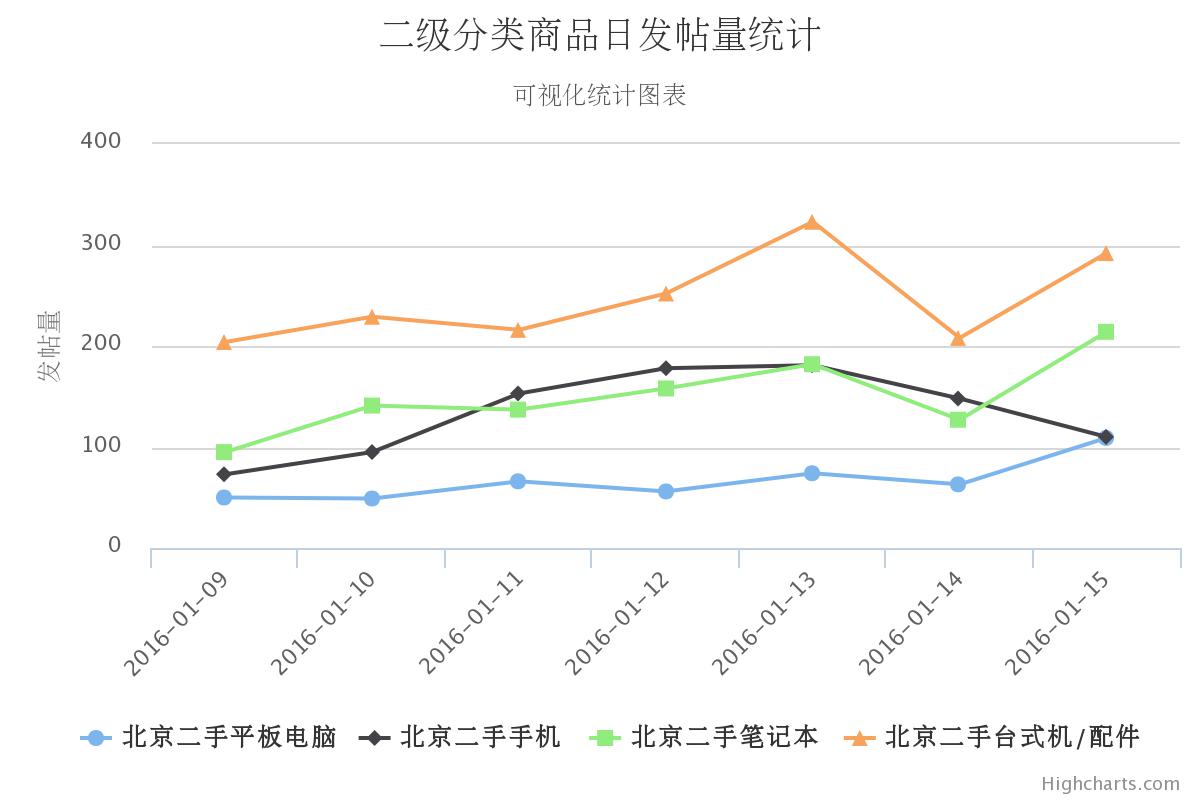
# 折线图
series = [
 {'name': '北京二手平板电脑', 'data': [50, 49, 66, 56, 74, 63, 109], 'type': 'line'},
 {'name': '北京二手手机', 'data': [73, 95, 153, 178, 181, 148, 110], 'type': 'line'},
 {'name': '北京二手笔记本',
  'data': [95, 141, 137, 158, 182, 127, 214],
  'type': 'line'},
 {'name': '北京二手台式机/配件',
  'data': [204, 229, 216, 252, 323, 208, 292],
  'type': 'line'}
]
options = {
    'chart'   : {'zoomType':'xy'},    # 可以放大或缩小
    'title'   : {'text': '二级分类商品日发帖量统计'},
    'subtitle': {'text': '可视化统计图表'},
    'xAxis'   : {'categories': ['2016-01-09','2016-01-10','2016-01-11','2016-01-12','2016-01-13','2016-01-14','2016-01-15']},
    'yAxis'   : {'title': {'text': '发帖量'}}
    }

charts.plot(series, options=options,show='inline')

# 饼图
options = {
    'chart'   : {'zoomType':'xy'},
    'title'   : {'text': '各城区一天成交商品统计'},
    'subtitle': {'text': '可视化统计图表'},
    }
series =  [{
    'type': 'pie',
    'name': '一天成交商品量',
    'data': [
 ['朝阳', 1849],
 ['不明', 1530],
 ['海淀', 1221],
 ['丰台', 857],
 ['大兴', 532],
 ['昌平', 504],
 ['通州', 501],
 ['西城', 340],
 ['东城', 336],
 ['顺义', 200],
 ['石景山', 196],
 ['宣武', 187],
 ['房山', 143],
 ['崇文', 121],
 ['门头沟', 56],
 ['燕郊', 49],
 ['北京周边', 49],
 ['怀柔', 47],
 ['密云', 34],
 ['平谷', 19],
 ['延庆', 12],
 ['无城区信息', 7]
]
        }]

charts.plot(series,options=options,show='inline')


