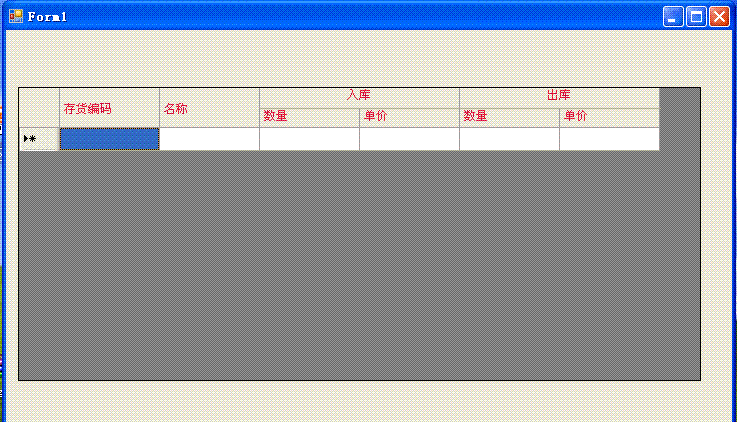
最近把我们的b/s系统,增加智能客户端的功能。确实智能客户端是非常好用的东西。可惜winform的控件功能不怎么强大,相比vb差很多啊。比如DataGridView不支持二维表头,不支持表尾合计,相比之下 web的好办多了(还是喜欢Web的排版、导航,但喜欢Win的操作性,希望WPF早日流行)。
但是 MIS系统没有二维表头确实是客户不能接受的,尝试了com控件flexgrid或者开源的SourceGrid3,但都不怎么好用,于是想改造一下DataGridView。我的做法是在CellPainting做手脚。花了一天时间尝试,只是做出原型,还没有完善,希望有需要的朋友少走弯路。
1,继承DataGridView,添加表头信息类。
2,添加CellPainting,代码如下:
 private void DataGridViewEx_CellPainting(object sender, DataGridViewCellPaintingEventArgs e)
 {
{ if (e.RowIndex == -1)
 {
{ // int w = dataGridView1.HorizontalScrollingOffset + dataGridView1.TopLeftHeaderCell.Size.Width + dataGridView1.Columns[0].Width + 10;

 Rectangle newRect = new Rectangle(e.CellBounds.X + 1,
 e.CellBounds.Y + 1, e.CellBounds.Width - 4,
 e.CellBounds.Height - 4);
 using (
 Brush gridBrush = new SolidBrush(this.GridColor),
 backColorBrush = new SolidBrush(e.CellStyle.BackColor))
 {
{ using (Pen gridLinePen = new Pen(gridBrush))
 {
{ // Erase the cell.
 e.Graphics.FillRectangle(backColorBrush, e.CellBounds);
 // Draw the grid lines (only the right and bottom lines;
 // DataGridView takes care of the others).
 e.Graphics.DrawLine(gridLinePen, e.CellBounds.Left,
 e.CellBounds.Bottom - 1, e.CellBounds.Right - 1,
 e.CellBounds.Bottom - 1);
 if (e.ColumnIndex > -1 && topRow!=null&&topRow.Cells[e.ColumnIndex].ColSpan>1)
 {
{ e.Graphics.DrawLine(gridLinePen, e.CellBounds.Right - 1,
 e.CellBounds.Top + e.ClipBounds.Height / 2, e.CellBounds.Right - 1,
 e.CellBounds.Bottom);
 }
} else
else {
{ e.Graphics.DrawLine(gridLinePen, e.CellBounds.Right - 1,
 e.CellBounds.Top, e.CellBounds.Right - 1,
 e.CellBounds.Bottom);
 }
}
 // Draw the inset highlight box.
 // e.Graphics.DrawRectangle(Pens.Blue, newRect);
 int scale = e.CellBounds.Height/3;
 if (e.ColumnIndex > -1 && topRow.Cells[e.ColumnIndex].Text != null)
 {
{ scale= e.CellBounds.Height / 2;
 e.Graphics.DrawLine(gridLinePen, e.CellBounds.Left, e.CellBounds.Bottom - e.CellBounds.Height / 2, e.CellBounds.Right, e.CellBounds.Bottom - e.CellBounds.Height / 2);
 }
} // Draw the text content of the cell, ignoring alignment.


 if (e.Value != null)
 {
{ e.Graphics.DrawString(e.Value.ToString(), e.CellStyle.Font,
 Brushes.Crimson, e.CellBounds.X + 2,
 e.CellBounds.Y + scale+ 2, StringFormat.GenericDefault);


 }
}


 if (e.ColumnIndex > -1 && topRow.Cells[e.ColumnIndex].RelateIndex > -1 && topRow.Cells[e.ColumnIndex].Text!=null)
 {
{ Rectangle recCell = new Rectangle(e.CellBounds.X - 1 - topRow.Cells[e.ColumnIndex].SpanRowWith,
 e.CellBounds.Y + 1, topRow.Cells[e.ColumnIndex].SpanRowWith,
 e.CellBounds.Height / 2);

 StringFormat sf = new StringFormat();
 sf.Alignment = StringAlignment.Center;

 e.Graphics.DrawString(topRow.Cells[e.ColumnIndex].Text, e.CellStyle.Font, Brushes.Crimson, recCell, sf);
 }
}
 e.Handled = true;
 }
} }
} }
}
 }
}
3,调用方法
 dataGridViewEx1.TopRow.Cells[2].Text = "入库";
 dataGridViewEx1.TopRow.Cells[2].ColSpan = 2;

 dataGridViewEx1.TopRow.Cells[4].Text = "出库";
 dataGridViewEx1.TopRow.Cells[4].ColSpan = 2;
4,效果图
至于表尾合计,也做出了原型。二维表头+表尾合计,基本上满足需求了。


