当使用cmap时批量添加图例legend到plt.scatter
没用cmap时的方法需要循环设置label,例如
for color, i, target_name in zip(colors, [0, 1, 2], target_names):
    plt.scatter(
        X_r2[y == i, 0], X_r2[y == i, 1], alpha=0.8, color=color, label=target_name
)使用cmap时一个plt.scatter()即完成了绘图,此时添加label/legend不能循环,
方法1:按照标签设置label,不能自定义
import matplotlib.pyplot as plt
from matplotlib.colors import ListedColormap

#define data
x = [3, 4, 4, 6, 8, 9]
y = [12, 14, 17, 16, 11, 13]

#define values, classes, and colors to map
values = [0, 0, 1, 2, 2, 2]
classes = ['A', 'B', 'C']
colors = ListedColormap(['red', 'blue', 'purple'])

#create scatterplot
scatter = plt.scatter(x, y, c=values, cmap=colors)

#add legend with values
plt.legend(*scatter.legend_elements())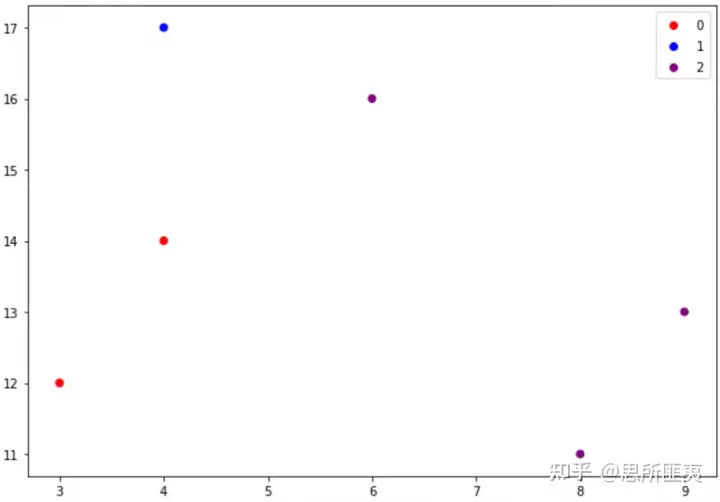
方法2:自定义legend的label,指定的类名(A, B, C),而不是(0,1,2)。
import matplotlib.pyplot as plt
from matplotlib.colors import ListedColormap

#define data
x = [3, 4, 4, 6, 8, 9]
y = [12, 14, 17, 16, 11, 13]

#define values, classes, and colors to map
values = [0, 0, 1, 2, 2, 2]
classes = ['A', 'B', 'C']
colors = ListedColormap(['red', 'blue', 'purple'])

#create scatterplot
scatter = plt.scatter(x, y, c=values, cmap=colors)

#add legend with class names
plt.legend(handles=scatter.legend_elements()[0], labels=classes)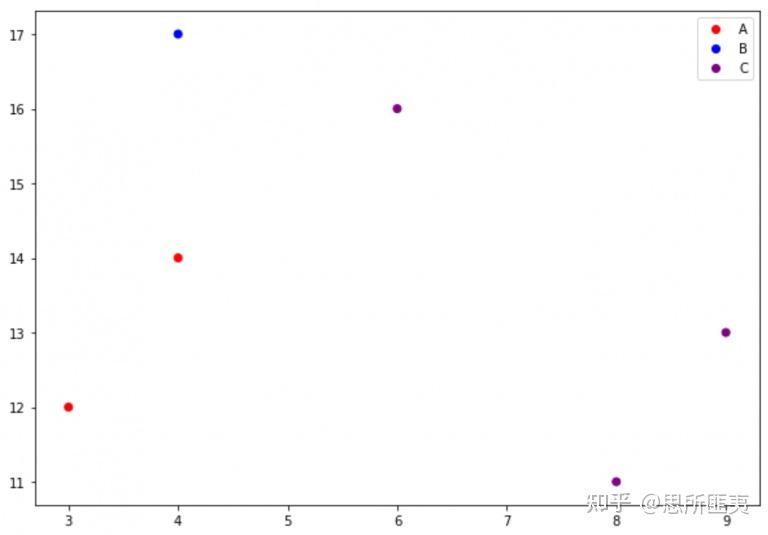

 浙公网安备 33010602011771号