centos7安装ELK6.5.3
简介
Elastic Stack也就是ELK,ELK是三款软件的检查,分别是Elasticsearch,logstas,Kibana组成,在发展过程中,有有了新的成员Beats加入,所以就形成了Elastic Starck.也是就是说ELK是旧的称呼,Elastic Stack是新的名字。
先通过Beats采集一切的数据如日志文件,网络流量,Win事件日志,服务指标,健康检查等,然后把数据发送elasticsearch保存起来,也可以发送给logstas处理然后再发送个elasticsearch,最后通过kibana的组件将数据可视化的展示出来
Elasticsearch
- Elasticsearch基于java,是个开源分布式手术引擎,它的特点有:分布式,零配置,自动发现,索引自动分片,索引副本机制,restful风格接口,多数据源,自动搜索负载等。
Logstash
- 也是基于java,是一个开源的用于收集,分析和存储日志的工具。
Kibana
- Kibana基于nodejs,也是开源和免费的工具,Kibana开源为logsash和Elasticsearch提供日志分析友好的web界面,可以汇总,分析和搜索重要的数据日志。
Beats
- Bests是elastic公司开源的一款采集系统监控数据的代理agent,是在被监控服务器上以客户端形式运行的数据收集器的统称,可以直接把数据发送给Elasticsearch或者通过Logstash发送给Elasticsearch,然后进行后续的数据分析活动
配置jdk
[root@localhost ~]# tar  -xf jdk-8u281-linux-x64.tar.gz
[root@localhost ~]# mv jdk1.8.0_281/ /usr/local/
[root@localhost ~]# vim /etc/profile
.......................
.....................
export JAVA_HOME=/usr/local/jdk1.8.0_281/
export JRE_HOME=/usr/local/jdk1.8.0_281/jre
export PATH=$PATH:$JAVA_HOME/bin:$JRE_HOME/bin
export CLASSPATH=.$CLASSPATH:$JAVA_HOME/lib:$JAVA_HOME/lib/tools.jar:$JRE_HOME/lib

[root@localhost ~]# source /etc/profile
[root@localhost ~]# java -version
java version "1.8.0_281"
Java(TM) SE Runtime Environment (build 1.8.0_281-b09)
Java HotSpot(TM) 64-Bit Server VM (build 25.281-b09, mixed mode)
下载软件包
wget https://artifacts.elastic.co/downloads/elasticsearch/elasticsearch-6.5.3.tar.gz
wget https://artifacts.elastic.co/downloads/logstash/logstash-6.5.3.tar.gz
wget https://artifacts.elastic.co/downloads/kibana/kibana-6.5.3-linux-x86_64.tar.gz
wget https://artifacts.elastic.co/downloads/beats/filebeat/filebeat-6.5.3-linux-x86_64.tar.gz
创建elasticsearch用户,注意elasticsearch不能在root中启动。
[root@localhost ~]# useradd  elasticsearch
[root@localhost ~]# chown -R elasticsearch.elasticsearch  /usr/local/ELK/elasticsearch-6.5.3

#启动elasticsearch
[root@localhost ~]# su elasticsearch
[elasticsearch@localhost ELK]$ nohup  /usr/local/ELK/elasticsearch-6.5.3/bin/elasticsearch &
#查看日志:大概8秒启动完成
[elasticsearch@localhost ELK]$ tail -f /home/elasticsearch/nohup.out
[2021-11-13T02:42:14,294][INFO ][o.e.p.PluginsService     ] [6i241PP] loaded module [x-pack-rollup]
[2021-11-13T02:42:14,294][INFO ][o.e.p.PluginsService     ] [6i241PP] loaded module [x-pack-security]
[2021-11-13T02:42:14,294][INFO ][o.e.p.PluginsService     ] [6i241PP] loaded module [x-pack-sql]
[2021-11-13T02:42:14,294][INFO ][o.e.p.PluginsService     ] [6i241PP] loaded module [x-pack-upgrade]
[2021-11-13T02:42:14,294][INFO ][o.e.p.PluginsService     ] [6i241PP] loaded module [x-pack-watcher]
[2021-11-13T02:42:14,295][INFO ][o.e.p.PluginsService     ] [6i241PP] no plugins loaded
[2021-11-13T02:42:21,566][INFO ][o.e.x.s.a.s.FileRolesStore] [6i241PP] parsed [0] roles from file [/usr/local/ELK/elasticsearch-6.5.3/config/roles.yml]
[2021-11-13T02:42:22,627][INFO ][o.e.x.m.j.p.l.CppLogMessageHandler] [6i241PP] [controller/10948] [Main.cc@109] controller (64 bit): Version 6.5.3 (Build f418a701d70c6e) Copyright (c) 2018 Elasticsearch BV
[2021-11-13T02:42:23,324][DEBUG][o.e.a.ActionModule       ] [6i241PP] Using REST wrapper from plugin org.elasticsearch.xpack.security.Security
[2021-11-13T02:42:23,645][INFO ][o.e.d.DiscoveryModule    ] [6i241PP] using discovery type [zen] and host providers [settings]
[2021-11-13T02:42:24,988][INFO ][o.e.n.Node               ] [6i241PP] initialized
[2021-11-13T02:42:24,988][INFO ][o.e.n.Node               ] [6i241PP] starting ...
[2021-11-13T02:42:25,332][INFO ][o.e.t.TransportService   ] [6i241PP] publish_address {127.0.0.1:9300}, bound_addresses {[::1]:9300}, {127.0.0.1:9300}
........................,
#查看端口是否启动
[elasticsearch@localhost ELK]$ ss -antl
State       Recv-Q Send-Q            Local Address:Port                           Peer Address:Port
LISTEN      0      100                   127.0.0.1:25                                        *:*
LISTEN      0      128                           *:22                                        *:*
LISTEN      0      100                       [::1]:25                                     [::]:*
LISTEN      0      128          [::ffff:127.0.0.1]:9200                                   [::]:*
LISTEN      0      128                       [::1]:9200                                   [::]:*
LISTEN      0      128          [::ffff:127.0.0.1]:9300                                   [::]:*
LISTEN      0      128                       [::1]:9300                                   [::]:*
LISTEN      0      128                        [::]:22                                     [::]:*

#执行curl命令检查服务是否正常响应:curl 127.0.0.1:9200,收到响应如下:
[elasticsearch@localhost ELK]$ curl 127.0.0.1:9200
{
  "name" : "6i241PP",
  "cluster_name" : "elasticsearch",
  "cluster_uuid" : "6YpD7O2vSE-PBCoO-pwiiA",
  "version" : {
    "number" : "6.5.3",
    "build_flavor" : "default",
    "build_type" : "tar",
    "build_hash" : "159a78a",
    "build_date" : "2018-12-06T20:11:28.826501Z",
    "build_snapshot" : false,
    "lucene_version" : "7.5.0",
    "minimum_wire_compatibility_version" : "5.6.0",
    "minimum_index_compatibility_version" : "5.0.0"
  },
  "tagline" : "You Know, for Search"
}
配置和启动Logstash
在logstash目录创建文件default.conf,内容如下:
[elasticsearch@localhost ELK]$ exit
exit
#监听5044端口的数据打印至9200端口
[root@localhost ~]# vim /usr/local/ELK/logstash-6.5.3/default.conf# 监听5044端口作为输入
input {
    beats {
        port => "5044"
    }
}
# 数据过滤
filter {
    grok {
        match => { "message" => "%{COMBINEDAPACHELOG}" }
    }
    geoip {
        source => "clientip"
    }
}
# 输出配置为本机的9200端口,这是ElasticSerach服务的监听端口
output {
    elasticsearch {
        hosts => ["127.0.0.1:9200"]
    }
}

#后台启动logstash
[root@localhost logstash-6.5.3]# nohup /usr/local/ELK/logstash-6.5.3/bin/logstash -f /usr/local/ELK/logstash-6.5.3/default.conf &
#查看日志
[root@localhost logstash-6.5.3]# tail -f nohup.out
............................
...........................
2021-11-13T02:52:44,299][INFO ][logstash.agent           ] Pipelines running {:count=>1, :running_pipelines=>[:main], :non_running_pipelines=>[]}
[2021-11-13T02:52:44,447][INFO ][org.logstash.beats.Server] Starting server on port: 5044
[2021-11-13T02:52:44,948][INFO ][logstash.agent           ] Successfully started Logstash API endpoint {:port=>9600}
#查看端口
[root@localhost logstash-6.5.3]# netstat -tunlp
Active Internet connections (only servers)
Proto Recv-Q Send-Q Local Address           Foreign Address         State       PID/Program name
tcp        0      0 127.0.0.1:25            0.0.0.0:*               LISTEN      1369/master
tcp        0      0 0.0.0.0:22              0.0.0.0:*               LISTEN      1121/sshd
tcp6       0      0 ::1:25                  :::*                    LISTEN      1369/master
tcp6       0      0 127.0.0.1:9600          :::*                    LISTEN      12172/java
tcp6       0      0 127.0.0.1:9200          :::*                    LISTEN      10621/java
tcp6       0      0 ::1:9200                :::*                    LISTEN      10621/java
tcp6       0      0 :::5044                 :::*                    LISTEN      12172/java
tcp6       0      0 127.0.0.1:9300          :::*                    LISTEN      10621/java
tcp6       0      0 ::1:9300                :::*                    LISTEN      10621/java
tcp6       0      0 :::22                   :::*                    LISTEN      1121/sshd
udp        0      0 0.0.0.0:68              0.0.0.0:*                           1963/dhclient
配置和启动Kibana
#1.编辑Kibana的配置文件
[root@localhost logstash-6.5.3]# vim /usr/local/ELK/kibana-6.5.3-linux-x86_64/config/kibana.yml
......

server.host: "0.0.0.0"

pid.file: /var/run/kibana.pid
......

#2.启动服务
[root@localhost logstash-6.5.3]# nohup  /usr/local/ELK/kibana-6.5.3-linux-x86_64/bin/kibana &

#3.查看端口和日志确认是否正常启动
[root@localhost logstash-6.5.3]# netstat -tunlp|grep 5601
tcp        0      0 0.0.0.0:5601            0.0.0.0:*               LISTEN      12248/node
[root@localhost logstash-6.5.3]# tail -f nohup.out
.....................
{"type":"log","@timestamp":"2021-11-12T18:57:58Z","tags":["listening","info"],"pid":12248,"message":"Server running at http://0.0.0.0:5601"}
{"type":"log","@timestamp":"2021-11-12T18:57:58Z","tags":["status","plugin:spaces@6.5.3","info"],"pid":12248,"state":"green","message":"Status changed from red to green - Ready","prevState":"red","prevMsg":"Request Timeout after 3000ms"}

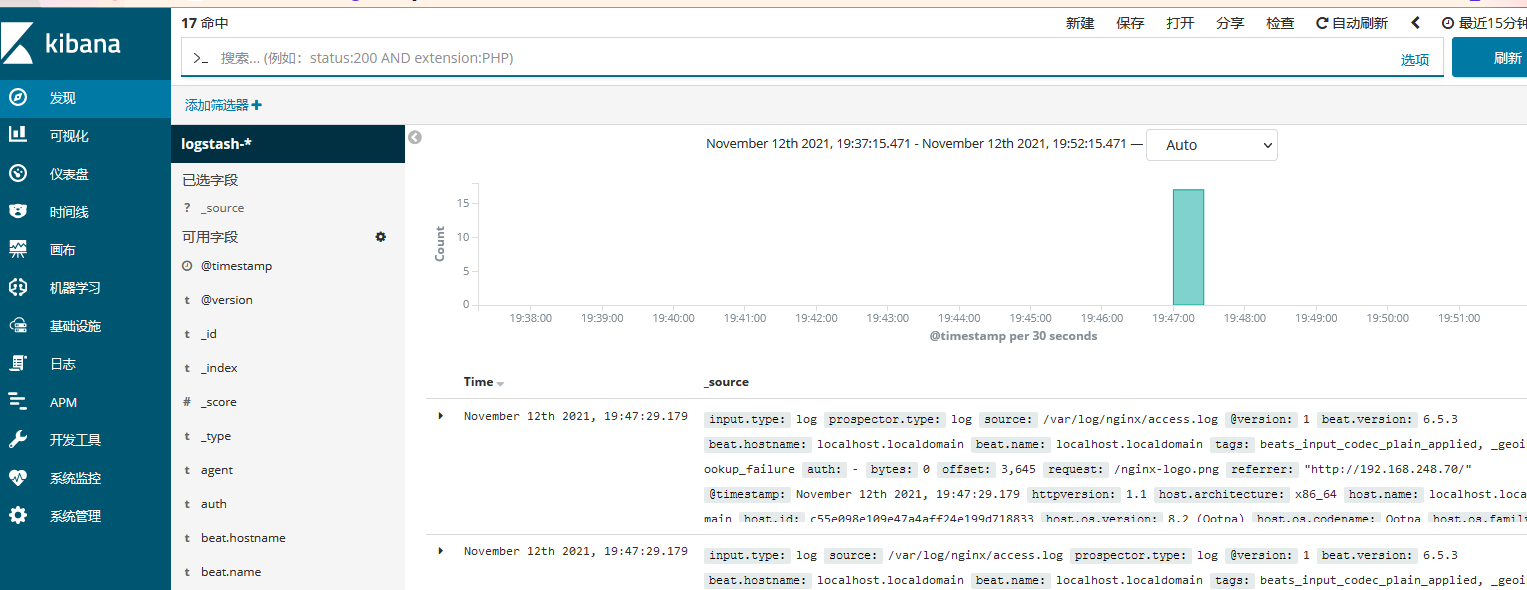
ELK服务启动成功,在另一台上面收集nginx日志
#安装nginx
[root@localhost ~]# yum -y install nginx
[root@localhost ~]# systemctl  enable --now nginx

#在被监控日志的服务器上安装filebeat服务,比如nginx服务器
wget https://artifacts.elastic.co/downloads/beats/filebeat/filebeat-6.5.3-linux-x86_64.tar.gz
[root@localhost src]# tar -xf filebeat-6.5.3-linux-x86_64.tar.gz
[root@localhost src]# cd filebeat-6.5.3-linux-x86_64

#修改配置文件
[root@localhost filebeat-6.5.3-linux-x86_64]# cp filebeat.yml{,.bak}
........
  enabled: true
  paths:
    - /var/log/nginx/*.log
......
#output.elasticsearch:
  # Array of hosts to connect to.
  #  hosts: ["localhost:9200"]
.....
output.logstash:
  # The Logstash hosts
  hosts: ["192.168.248.135:5044"]

#启动filebeat
[root@localhost filebeat-6.5.3-linux-x86_64]# nohup  /usr/local/src/filebeat-6.5.3-linux-x86_64/filebeat -e -c /usr/local/src/filebeat-6.5.3-linux-x86_64/filebeat.yml &
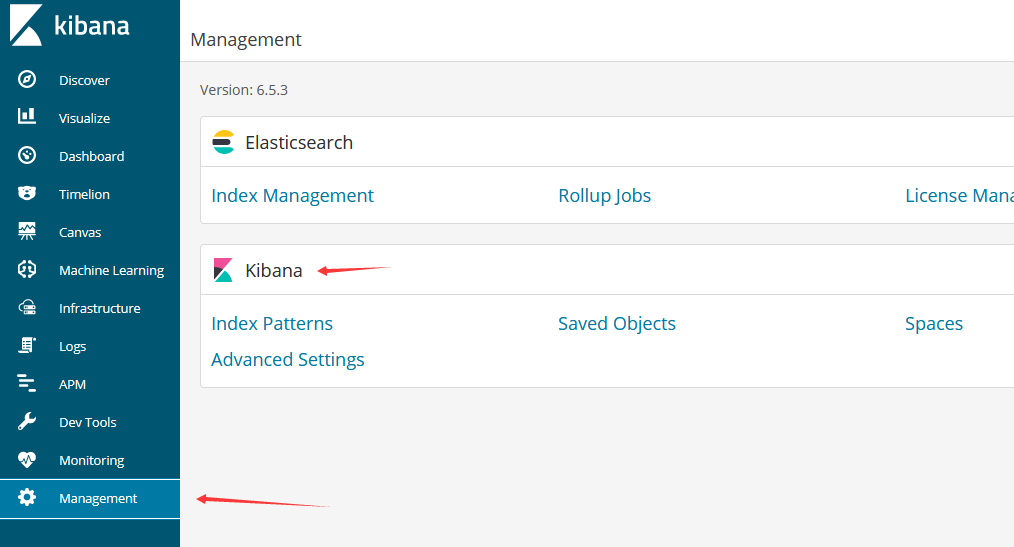
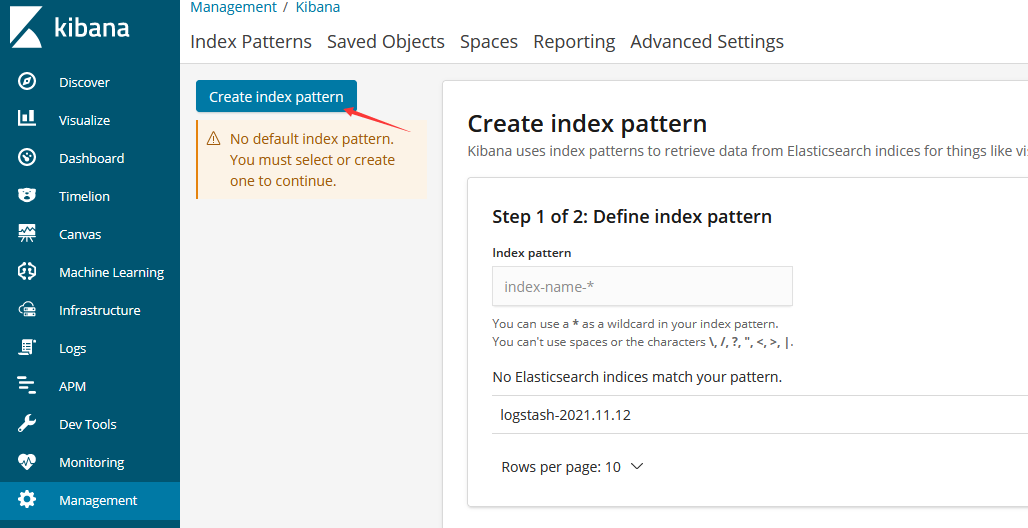
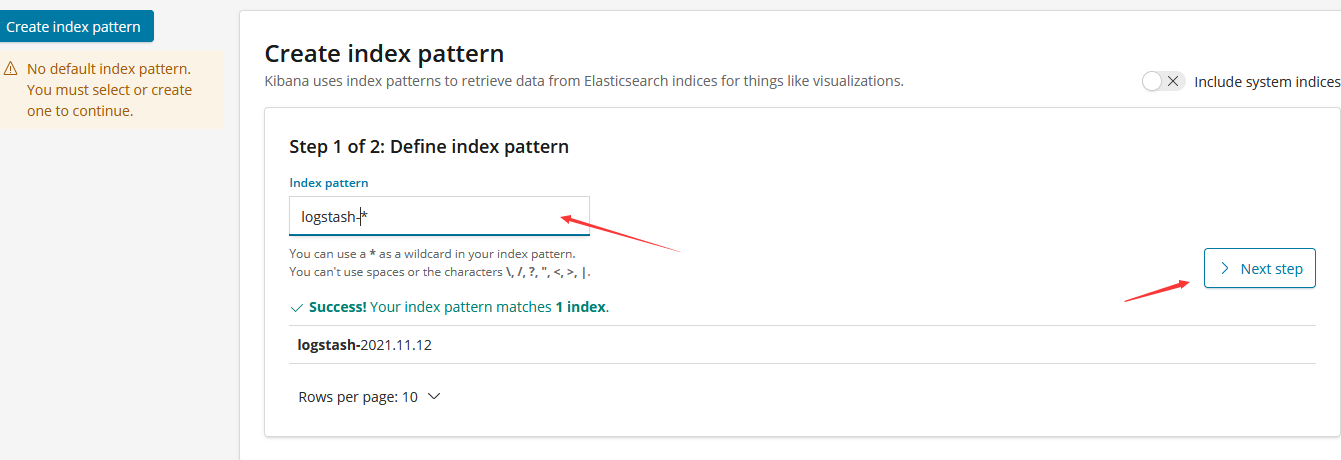
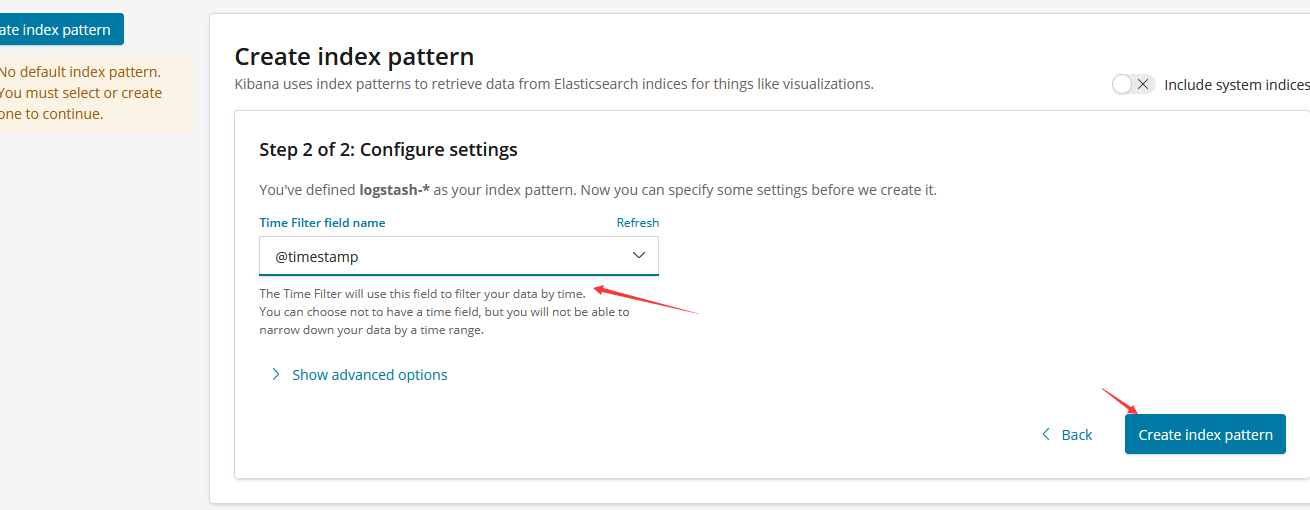
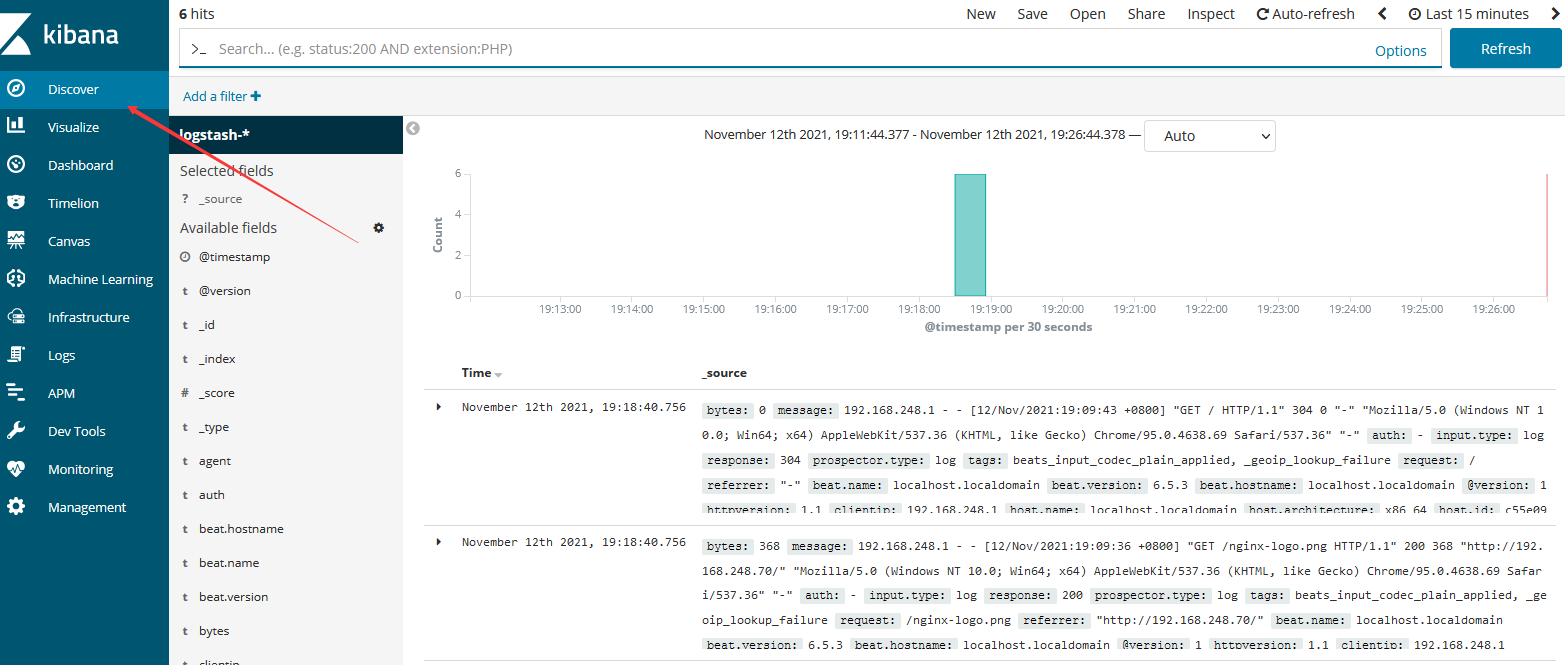
配置kibana
安装supervisor
yum -y install epel-release
yum install -y supervisor

vim /etc/supervisord.conf
[inet_http_server]         ; inet (TCP) server disabled by default
port=192.168.248.135:9001        ; (ip_address:port specifier, *:port for all iface)
username=user              ; (default is no username (open server))
password=123               ; (default is no password (open server))

systemctl start supervisord

systemctl enable supervisord
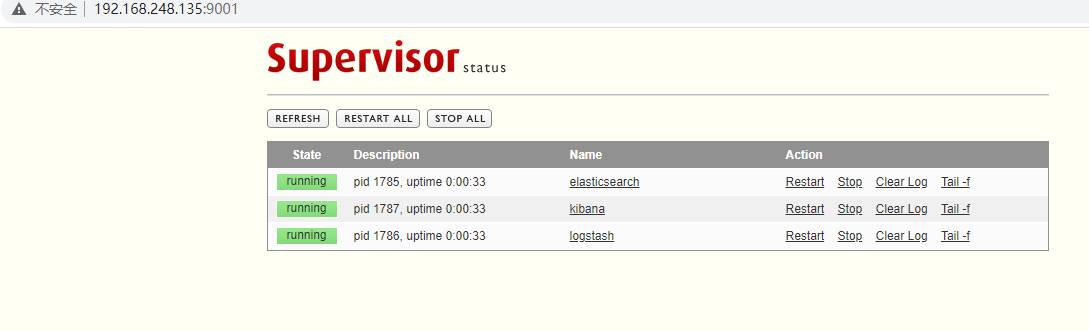
使用网页的形式也能开启关闭服务
输入地址:http://ip:9001/ 输入账号密码
部署守护进程supervisor启动ELK
supervisor配置文件
#elasticsearch配置如下
[root@localhost ~]# vim /etc/supervisord.d/elasticsearch.ini
[program:elasticsearch]
command=/usr/local/ELK/elasticsearch-6.5.3/bin/elasticsearch
directory=/usr/local/ELK/elasticsearch-6.5.3//bin
user=elasticsearch
redirect_stderr=true
stdout_logfile=/usr/local/ELK/elasticsearch.log
autostart=true
autorestart=true
killasgroup=true
environment=JAVA_HOME=/usr/local/jdk1.8.0_281

#logstash配置如下
[root@localhost ~]# vim /etc/supervisord.d/logstash.ini
[program:logstash]
command= /usr/local/ELK/logstash-6.5.3/bin/logstash  -f /usr/local/ELK/logstash-6.5.3/default.conf
directory=/usr/local/ELK/logstash-6.5.3/bin
redirect_stderr=true
stdout_logfile=/usr/local/ELK/logstash.log
autostart=true
autorestart=true
startsecs=10
stopwaitsecs=600
killasgroup=true
environment=JAVA_HOME=/usr/local/jdk1.8.0_281

#kibana配置如下
[root@localhost ~]# vim /etc/supervisord.d/kibana.ini
[program:kibana]
command= /usr/local/ELK/kibana-6.5.3-linux-x86_64/bin/kibana
directory=/usr/local/ELK/kibana-6.5.3-linux-x86_64/bin
redirect_stderr=true
stdout_logfile=/usr/local/ELK/kibana.log
autostart=true
autorestart=true
startsecs=10
stopwaitsecs=600
killasgroup=true
environment=JAVA_HOME=/usr/local/jdk1.8.0_281

#先关掉之前启动的elk进程
#然后使supervisord配置文件生效
[root@localhost ~]# supervisorctl  update
[root@localhost ~]# supervisorctl  status
elasticsearch                    RUNNING   pid 12475, uptime 0:01:30
kibana                           RUNNING   pid 12597, uptime 0:00:18
logstash                         RUNNING   pid 12477, uptime 0:01:30
kibana汉化
请参考https://github.com/wu2700222/Kibana_Hanization
[root@localhost ~]# unzip Kibana_Hanization-master.zip
[root@localhost ~]# cd Kibana_Hanization-master/old/
[root@localhost old]# python main.py  /usr/local/ELK/kibana-6.5.3-linux-x86_64

#重启kibana
[root@localhost old]# supervisorctl  restart kibana