第十三次作业——回归模型与房价预测&第十一次作业——sklearn中朴素贝叶斯模型及其应用&第七次作业——numpy统计分布显示
第十三次作业——回归模型与房价预测
1. 导入boston房价数据集
2. 一元线性回归模型,建立一个变量与房价之间的预测模型,并图形化显示。
3. 多元线性回归模型,建立13个变量与房价之间的预测模型,并检测模型好坏,并图形化显示检查结果。
4. 一元多项式回归模型,建立一个变量与房价之间的预测模型,并图形化显示。
代码:
#导入boston房价数据集
from sklearn.datasets import load_boston
import  pandas as pd

boston = load_boston()
df = pd.DataFrame(boston.data)

#一元线性回归模型,建立一个变量与房价之间的预测模型,并图形化显示。
from sklearn.linear_model import LinearRegression
import  matplotlib.pyplot as plt

x =boston.data[:,5]
y = boston.target
LinR = LinearRegression()
LinR.fit(x.reshape(-1,1),y)
w=LinR.coef_
b=LinR.intercept_
print(w,b)

plt.scatter(x,y)
plt.plot(x,w*x+b,'orange')
plt.show()

#多元线性回归模型,建立13个变量与房价之间的预测模型,并检测模型好坏,并图形化显示检查结果。
x = boston.data[:,12].reshape(-1,1)
y = boston.target
plt.figure(figsize=(10,6))
plt.scatter(x,y)

lineR = LinearRegression()
lineR.fit(x,y)
y_pred = lineR.predict(x)
plt.plot(x,y_pred,'r')
print(lineR.coef_,lineR.intercept_)
plt.show()

#一元多项式回归模型,建立一个变量与房价之间的预测模型,并图形化显示。

from sklearn.preprocessing import PolynomialFeatures
poly = PolynomialFeatures(degree=3)
x_poly = poly.fit_transform(x)
print(x_poly)
lrp = LinearRegression()
lrp.fit(x_poly,y)
y_poly_pred = lrp.predict(x_poly)
plt.scatter(x,y)
plt.scatter(x,y_pred)
plt.scatter(x,y_poly_pred)
plt.show()
运行结果:
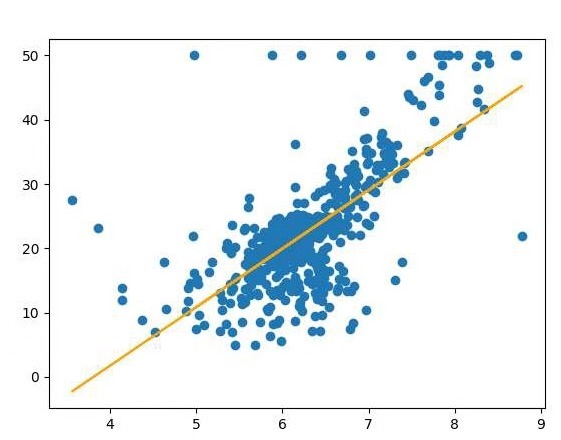
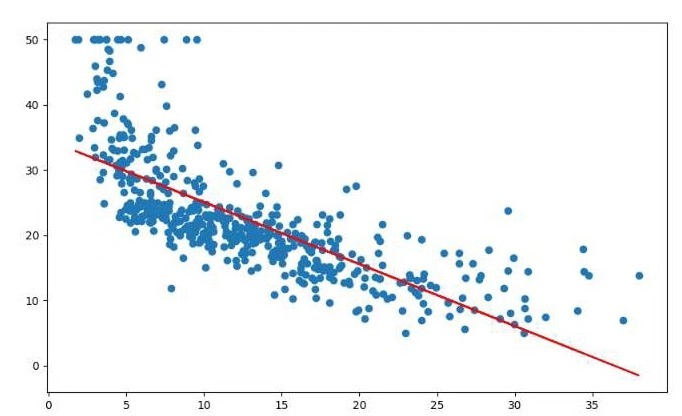

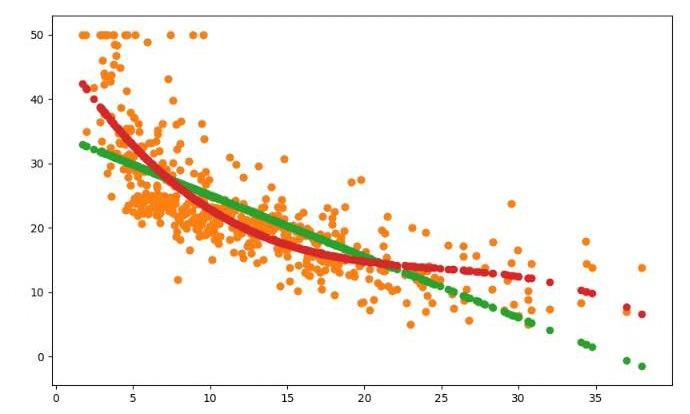
第十一次作业——sklearn中朴素贝叶斯模型及其应用
1.使用朴素贝叶斯模型对iris数据集进行花分类
尝试使用3种不同类型的朴素贝叶斯:
高斯分布型
多项式型
伯努利型
2.使用sklearn.model_selection.cross_val_score(),对模型进行验证。
3. 垃圾邮件分类
数据准备:
- 用csv读取邮件数据,分解出邮件类别及邮件内容。
- 对邮件内容进行预处理:去掉长度小于3的词,去掉没有语义的词等
尝试使用nltk库:
pip install nltk
import nltk
nltk.download
不成功:就使用词频统计的处理方法
训练集和测试集数据划分
- from sklearn.model_selection import train_test_split
代码:
# 导入鸢尾花数据集
from sklearn.datasets import load_iris

# 数据选取
iris_data = load_iris()['data']
iris_target = load_iris()['target']

# 用高斯模型进行预测并评估
from sklearn.naive_bayes import GaussianNB
mol = GaussianNB()
result = mol.fit(iris_data,iris_target)
# 对模型进行评估
from sklearn.model_selection import cross_val_score
scores = cross_val_score(mol,iris_data,iris_target,cv=10)
# 对预测结果的正确个数进行计算
print("高斯模型:")
print("数据总数:",len(iris_data),"  错误个数:",(iris_target != predi).sum())
print("Accuracy:%.3f"%scores.mean())

# 用贝努里模型进行预测和评估
from sklearn.naive_bayes import BernoulliNB
bnb = BernoulliNB()
result2 = bnb.fit(iris_data,iris_target)
pred2 = bnb.predict(iris_data)
# 计算错误个数
print("贝努里模型:")
print("数据总数:",len(iris_data),"  错误个数:",(iris_target != pred2).sum())
#模型评分
scores2 = cross_val_score(bnb,iris_data,iris_target)
print("Accuracy:%.3f"%scores2.mean())

# 用多项式建立模型进行预测和评估
from sklearn.naive_bayes import MultinomialNB
mnb = MultinomialNB()
result3 = mnb.fit(iris_data,iris_target)
# 预测
pred3 = result3.predict(iris_data)
# 计算错误个数
print("多项式模型:")
print("数据总数:",iris_data.shape[0],"  错误个数:",(iris_target != pred3).sum())
# 模型评分
scores3 = cross_val_score(mnb,iris_data,iris_target)
print("Accuracy:%.3f"%scores3.mean())
运行结果:


第七次作业——numpy统计分布显示
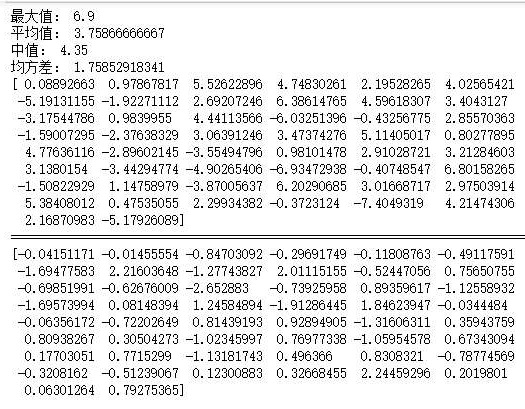
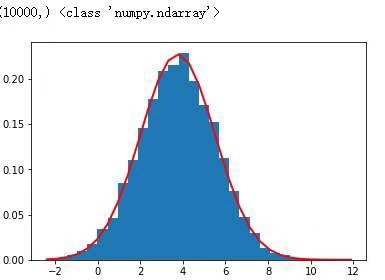
用np.random.normal()产生一个正态分布的随机数组,并显示出来。
np.random.randn()产生一个正态分布的随机数组,并显示出来。
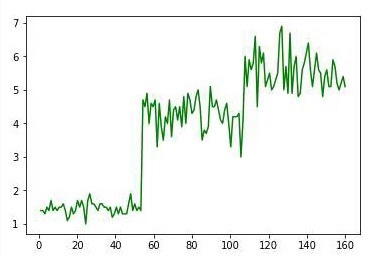
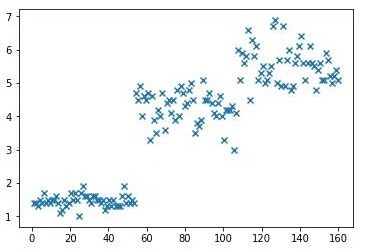
显示鸢尾花花瓣长度的正态分布图,曲线图,散点图。
代码:
import numpy as np

# 导入鸢尾花数据
from sklearn.datasets import load_iris
data = load_iris()
pental_len = data.data[:,2]

# 计算鸢尾花花瓣长度最大值,平均值,中值,均方差
print("最大值:",np.max(pental_len))
print("平均值:",np.mean(pental_len))
print("中值:",np.median(pental_len))
print("均方差:",np.std(pental_len))

# 用np.random.normal()产生一个正态分布的随机数组,并显示出来
print(np.random.normal(1,4,50))
print('============================================================================')

# np.random.randn()产生一个正态分布的随机数组,并显示出来
print(np.random.randn(50))

# 显示鸢尾花花瓣长度的正态分布图
import matplotlib.pyplot as plt
mu = np.mean(pental_len)
sigma = np.std(pental_len)
num = 10000
rand_data=np.random.normal(mu,sigma,num)
count,bins,ignored=plt.hist(rand_data,30,normed=True)
plt.plot(bins,1/(sigma*np.sqrt(2*np.pi))*np.exp(-(bins-mu)**2/(2*sigma**2)),linewidth=2,color="r")
plt.show()

# 显示鸢尾花花瓣长度曲线图
plt.plot(np.linspace(1,160,num=150),pental_len,'g')
plt.show()

# 显示鸢尾花花瓣长度散点图
plt.scatter(np.linspace(1,160,num=150),pental_len,alpha=1,marker='x')
plt.show()
运行结果:


【推荐】编程新体验,更懂你的AI,立即体验豆包MarsCode编程助手
【推荐】凌霞软件回馈社区,博客园 & 1Panel & Halo 联合会员上线
【推荐】抖音旗下AI助手豆包,你的智能百科全书,全免费不限次数
【推荐】轻量又高性能的 SSH 工具 IShell:AI 加持,快人一步
· 深入理解 Mybatis 分库分表执行原理
· 如何打造一个高并发系统?
· .NET Core GC压缩(compact_phase)底层原理浅谈
· 现代计算机视觉入门之:什么是图片特征编码
· .NET 9 new features-C#13新的锁类型和语义
· Sdcb Chats 技术博客:数据库 ID 选型的曲折之路 - 从 Guid 到自增 ID,再到
· 语音处理 开源项目 EchoSharp
· 《HelloGitHub》第 106 期
· Spring AI + Ollama 实现 deepseek-r1 的API服务和调用
· 使用 Dify + LLM 构建精确任务处理应用