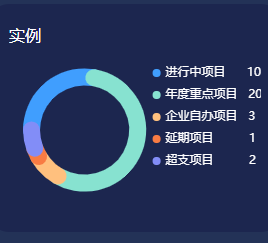
环形图

<template>
<div class="h jobProportion">
<div class="p20">
<div class="flexa">实例</div>
<div class="circle-pic-box">
<div class="w" id="workticket" :style="{ height: '170px' }"></div>
</div>
</div>
</div>
</template>
<script>
export default {
name: "",
components: {},
data () {
return {
type: 1,
BtVal: {
pieList: [
{ collectNum: 10, name: "进行中项目" },
{ collectNum: 20, name: "年度重点项目" },
{ collectNum: 3, name: "企业自办项目" },
{ collectNum: 1, name: "延期项目" },
{ collectNum: 2, name: "超支项目" },
],
colorList: [
//环形图颜色
"#409efe",
"#87E2D0",
"#ffc07e",
"#f87b43",
"#828df7",
"#fb675b",
"#e2a7d5",
"#0075aa",
],
afterSeries: [], //绘制环形饼图的数据
totalNum: 0,
},
listData: [],
};
},
created () { },
mounted () {
this.analysisInit();
},
methods: {
async analysisInit () {
// var res = await projectMessageCollect({
// });
// var res = {};
// this.listData = res.data.collectList;
this.listData = this.BtVal.pieList;
console.log("-------------饼状图-----------------");
let myChartAnalysis = this.$echarts.init(
document.getElementById("workticket")
);
console.log("");
var that = this;
let nameArr = [];
let afterSeriesArr = [];
let totalNum = 0;
this.listData.forEach((item, index) => {
console.log(item);
console.log(`--------------------this.BtVal.item`);
let seriesVal = {
type: "bar",
data: [0, 0, 2],
coordinateSystem: "polar",
barMaxWidth: 25, //圆环的宽度
roundCap: true,
name: "正式员工",
color: "#ffb22b",
stack: "a",
};
seriesVal.data[2] = item.collectNum ? Number(item.collectNum) : 0;
seriesVal.name = item.name;
seriesVal.color = this.BtVal.colorList[index];
totalNum = totalNum + item.collectNum;
nameArr.push(item.name);
afterSeriesArr.push(seriesVal);
});
this.BtVal.afterSeries = afterSeriesArr;
this.BtVal.totalNum = totalNum;
let BtVal = this.BtVal;
myChartAnalysis.setOption({
angleAxis: {
axisLine: {
show: false,
},
axisLabel: {
show: false,
},
splitLine: {
show: false,
},
axisTick: {
show: false,
},
min: 0,
max: BtVal.totalNum, //一圈的刻度值
startAngle: 180, //初始角度
},
radiusAxis: {
type: "category",
axisLine: {
show: false,
},
axisTick: {
show: false,
},
axisLabel: {
show: false,
},
data: ["1", "2", "3", "4"], //代表层级
z: 10,
},
polar: {
center: ["30%", "50%"], //圆环-图形位置
radius: "100%", //图形大小 值可设置超过100%
},
legend: {
//点点的配置
type: "scroll",
orient: "vertical", //竖向,'horizontal'横向
// right: "10%",
left: "55%",
top: "10%",
icon: "circle", // 圆形
itemWidth: 8, // 设置宽度
itemHeight: 8,
textStyle: { color: "#fff" },
// 文字后面的百分比
formatter: function (name) {
console.log(name);
// // 获取legend显示内容
let data = that.listData;
let tarValue = 0;
for (let i = 0; i < data.length; i++) {
if (data[i].name == name) {
tarValue = data[i].collectNum;
}
}
console.log("name------------------------");
if (name == "进行中项目") {
name = name + " " + " " + " " + " " + " " + " " + tarValue;
} else if (name != "年度重点项目" && name != "企业自办项目") {
name =
name +
" " +
" " +
" " +
" " +
" " +
" " +
" " +
" " +
" " +
"" +
" " +
tarValue;
} else {
name = name + " " + " " + " " + tarValue;
}
return name;
},
},
series: BtVal.afterSeries,
});
},
},
};
</script>
<style lang="scss" scoped>
.jobProportion {
//
background-color: rgba(26, 33, 75, 0.7) !important;
border-radius: 20px;
overflow: hidden;
}
.tabs_class {
background-color: #484c6f;
color: #fff;
padding: 10px 20px;
border-radius: 10px;
}
.tabs_class1 {
background-color: #484c6f;
color: #fff;
padding: 10px 20px;
border-radius: 10px;
margin-left: -12px;
}
.tabs_bgc {
background-color: #0088fe;
z-index: 100;
}
.circle-pic-box {
position: relative;
height: 167px;
margin: 0 auto;
box-sizing: border-box;
.pic-bit {
width: 8px;
height: 8px;
border-radius: 50%;
display: inline-block;
}
}
</style>


