

matplotlib python
1、初识
1、1 figure对象
在画图的时候,首先需要设置figure对象,即可理解设置画板大小。
import matplotlib.pyplot as plt
figure = plt.figure(num=None, figsize=None, dpi=None, facecolor=None, edgecolor=None, frameon=True)
其中figure函数的参数如下:
num:设置图像的编号或者名称,数字为编号,字符串为名称。
figsize:设置画板的宽和高,单位为英寸。
dpi:指定绘图对像的像素。
facecolor:背景的颜色。
edgecolor:边框的颜色。
frameon:是否显示边框
1、2 Axes
有了画板,接下来是“轴”,即画图位置基准,所以需要使用Aexs。
一般情况下,个人觉得可以使用下面的方式,并观察加注释两行:
1 2 3 4 5 | fig, axes = plt.subplots(nrows=2, ncols=2)axes[0,1].set(title='Upper Left')#与下面交换axes[0,0].set(title='Upper Right')#位置axes[1,0].set(title='Lower Left')axes[1,1].set(title='Lower Right') |
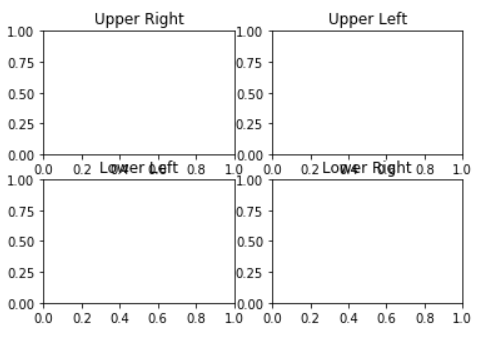
使用Axes,可以进行循环绘图,相对于.pyplot更加方便一些。
2、2D绘图
2、1 线
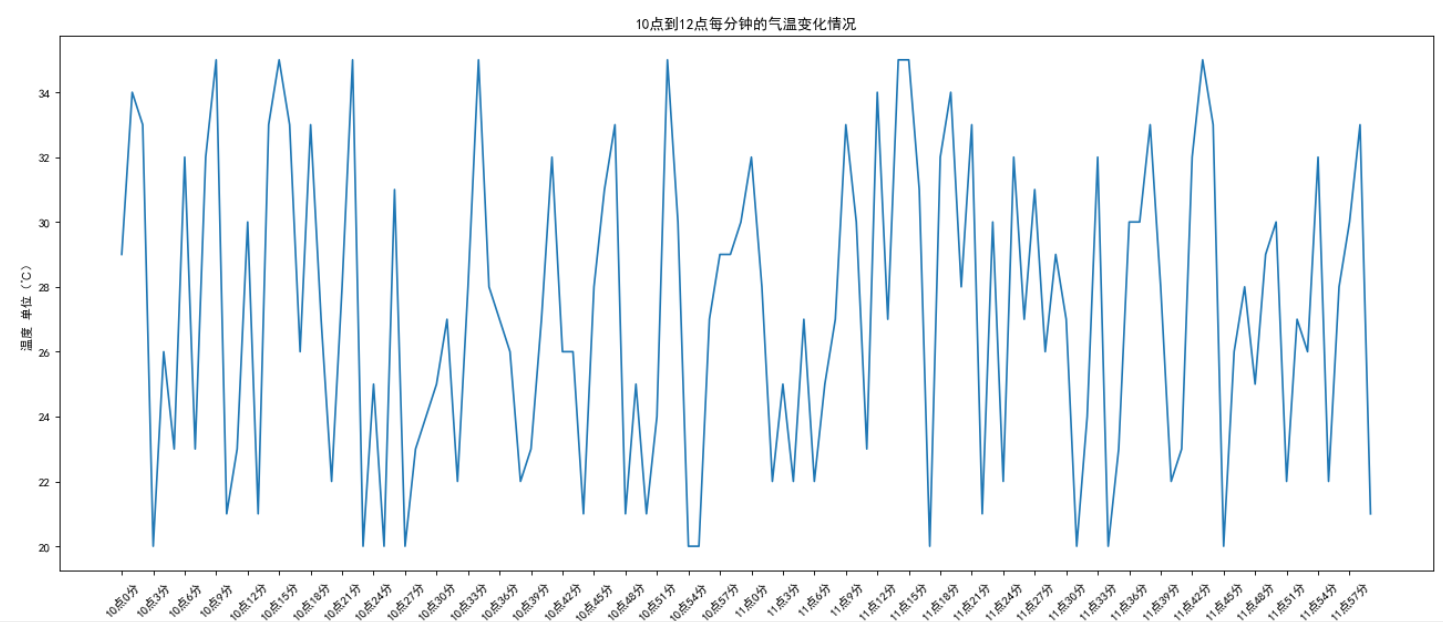
例一:

#设置字体
plt.rcParams['font.sans-serif'] = ['SimHei']  # 用来正常显示中文标签
plt.rcParams['axes.unicode_minus'] = False  # 用来正常显示负号
# 数据加载
x = range(0,120)
y = [random.randint(20,35) for i in range(120)]

# 画板大小
plt.figure(figsize=(20,8),dpi=80)

plt.plot(x,y)
# 规划化数据
_xtick_labels = ["10点{}分".format(i) for i in range(60)]
_xtick_labels += ["11点{}分".format(i) for i in range(60)]
# x轴的设置
plt.xticks(list(x)[::3],_xtick_labels[::3],rotation = 45)
# 名称设置
plt.xlabel("时间")
plt.ylabel("温度 单位(℃)")
plt.title("10点到12点每分钟的气温变化情况")

plt.show()
得出的结果如下:
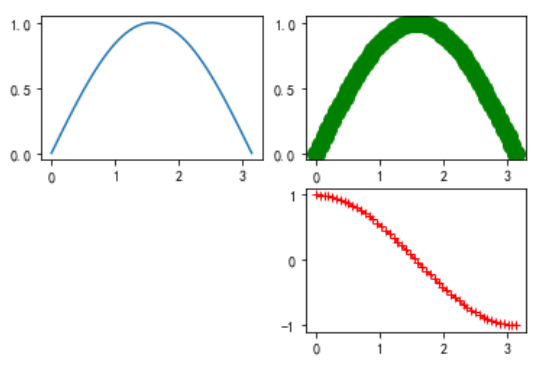
例二:
fig = plt.figure()
# 位置
ax1 = fig.add_subplot(221)
ax2 = fig.add_subplot(222)
ax3 = fig.add_subplot(224)
# 数据
x = np.linspace(0, np.pi)
y_sin = np.sin(x)
y_cos = np.cos(x)

ax1.plot(x, y_sin)
ax2.plot(x, y_sin, 'go--', linewidth=2, markersize=12)
ax3.plot(x, y_cos, color='red', marker='+', linestyle='dashed')
得出的结果如下:
2、2 散点图
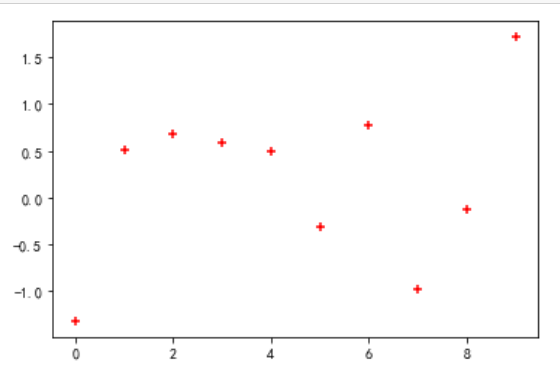
例一:
x = np.arange(10)
y = np.random.randn(10)
#散点图
plt.scatter(x, y, color='red', marker='+')
plt.show()
结果如下:
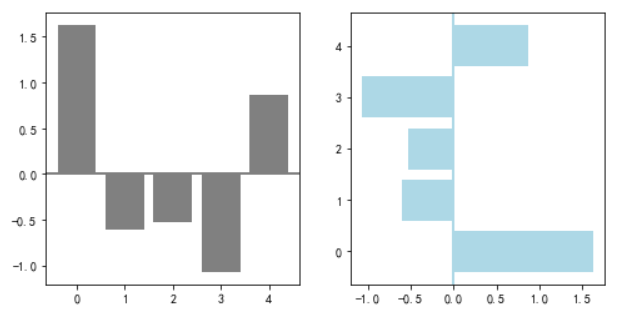
2、3 条形图
# 条形图
# 数据
np.random.seed(1)
x = np.arange(5)
y = np.random.randn(5)
# 画板和位置
fig, axes = plt.subplots(ncols=2, figsize=plt.figaspect(1./2))

vert_bars = axes[0].bar(x, y, color='gray', align='center')
horiz_bars = axes[1].barh(x, y, color='lightblue', align='center')
#在水平或者垂直方向上画线
axes[0].axhline(0, color='gray', linewidth=2)
axes[1].axvline(0, color='lightblue', linewidth=2)
plt.show()
结果如下:
2、4 直方图
例一:
a=[131,  98, 125, 131, 124, 139, 131, 117, 128, 108, 135, 138, 131, 102, 107, 114, 119, 128, 121, 142, 127, 130, 124, 101, 110, 116, 117, 110, 128, 128, 115,  99, 136, 126, 134,  95, 138, 117, 111,78, 132, 124, 113, 150, 110, 117,  86,  95, 144, 105, 126, 130,126, 130, 126, 116, 123, 106, 112, 138, 123,  86, 101,  99, 136,123, 117, 119, 105, 137, 123, 128, 125, 104, 109, 134, 125, 127,105, 120, 107, 129, 116, 108, 132, 103, 136, 118, 102, 120, 114,105, 115, 132, 145, 119, 121, 112, 139, 125, 138, 109, 132, 134,156, 106, 117, 127, 144, 139, 139, 119, 140,  83, 110, 102,123,107, 143, 115, 136, 118, 139, 123, 112, 118, 125, 109, 119, 133,112, 114, 122, 109, 106, 123, 116, 131, 127, 115, 118, 112, 135,115, 146, 137, 116, 103, 144,  83, 123, 111, 110, 111, 100, 154,136, 100, 118, 119, 133, 134, 106, 129, 126, 110, 111, 109, 141,120, 117, 106, 149, 122, 122, 110, 118, 127, 121, 114, 125, 126,114, 140, 103, 130, 141, 117, 106, 114, 121, 114, 133, 137,  92,121, 112, 146,  97, 137, 105,  98, 117, 112,  81,  97, 139, 113,134, 106, 144, 110, 137, 137, 111, 104, 117, 100, 111, 101, 110,105, 129, 137, 112, 120, 113, 133, 112,  83,  94, 146, 133, 101,131, 116, 111,  84, 137, 115, 122, 106, 144, 109, 123, 116, 111,111, 133, 150]

#计算组数
d = 3 #组距
num_bins = (max(a)  - min(a))//d

print(max(a),min(a),max(a)  - min(a))
#设置x轴的刻度
plt.xticks(range(min(a),max(a)+d,d))
plt.hist(a,num_bins,normed=True)
# 设置网格
plt.grid()
未加图
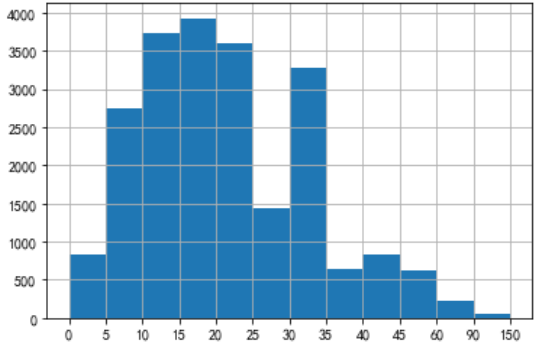
例二:interval = [0,5,10,15,20,25,30,35,40,45,60,90]
width = [5,5,5,5,5,5,5,5,5,15,30,60]
quantity = [836,2737,3723,3926,3596,1438,3273,642,824,613,215,47]

plt.bar(range(12),quantity,width=1)


#设置x轴刻度
_x = [i - 0.5 for i in range(13)]
_xtick_labels = interval+[150]
plt.xticks(_x,_xtick_labels)

plt.grid()
结果如下:


【推荐】国内首个AI IDE,深度理解中文开发场景,立即下载体验Trae
【推荐】编程新体验,更懂你的AI,立即体验豆包MarsCode编程助手
【推荐】抖音旗下AI助手豆包,你的智能百科全书,全免费不限次数
【推荐】轻量又高性能的 SSH 工具 IShell:AI 加持,快人一步
· AI与.NET技术实操系列:基于图像分类模型对图像进行分类
· go语言实现终端里的倒计时
· 如何编写易于单元测试的代码
· 10年+ .NET Coder 心语,封装的思维:从隐藏、稳定开始理解其本质意义
· .NET Core 中如何实现缓存的预热?
· 25岁的心里话
· 闲置电脑爆改个人服务器(超详细) #公网映射 #Vmware虚拟网络编辑器
· 基于 Docker 搭建 FRP 内网穿透开源项目(很简单哒)
· 零经验选手,Compose 一天开发一款小游戏!
· 一起来玩mcp_server_sqlite,让AI帮你做增删改查!!