容器化部署 Prometheus 2.32.1、存储的机制
一、容器部署prometheus
1、下载images
1 2 3 4 | docker pull prom/node-exporterdocker pull google/cadvisordocker pull prom/prometheusdocker pull grafana/grafana |
2、导入images
1 2 3 4 5 | cd images_prometheusfor i in `ls` do docker load -i $idone |
3、启动node-exporter
1 2 3 4 5 6 | docker run -d --name node-exporter \--restart=always -p 9100:9100 \-v "/proc:/host/proc:ro" \-v "/sys:/host/sys:ro" \-v "/:/rootfs:ro" \prom/node-exporter |
ip:9100/metrics
4、启动cadvisor
cadvisor是一个谷歌开发的容器监控工具,cAdvisor(容器顾问)使容器用户了解其运行中的容器的资源使用情况和性能特征。
它是一个正在运行的守护程序,用于收集,聚合,处理和导出有关正在运行的容器的信息
1 2 3 4 5 6 7 | docker run --name=cadvisor \-v /:/rootfs:ro \-v /var/run:/var/run:rw \-v /sys:/sys:ro \-v /var/lib/docker/:/var/lib/docker:ro \-v /dev/disk/:/dev/disk:ro -p 8080:8080 -d \--restart=always google/cadvisor:latest |
ip:8080/metrics
5、启动prometheus
1 2 | mkdir /opt/prometheuscd /opt/prometheus/ |
prometheus 版本
1 2 3 4 5 6 | prometheus --versionprometheus, version 2.32.1 (branch: HEAD, revision: 41f1a8125e664985dd30674e5bdf6b683eff5d32) build user: root@54b6dbd48b97 build date: 20211217-22:08:06 go version: go1.17.5 platform: linux/amd64 |
配置如下
1 2 3 4 5 6 7 8 9 10 11 12 13 14 15 16 17 18 19 20 21 22 23 24 25 26 27 28 29 30 31 32 33 34 35 36 37 | cat prometheus.ymlglobal: scrape_interval: 60s evaluation_interval: 60sscrape_configs: - job_name: prometheus static_configs: - targets: ['localhost:9090'] labels: instance: prometheus - job_name: node_export1 static_configs: - targets: ['10.20.1.145:9100'] labels: instance: jingzhiz - targets: ['10.20.1.18:9100'] # labels: # instance: pve-18 # - targets: ['192.168.1.22:9100'] #这里添加targets,可以使用Prometheus监控其他装有node_exporter的节点,单节点则不需要 # labels: # instance: 192.168.1.22 - job_name: cadvisor static_configs: - targets: ['10.1.1.145:8080'] labels: instance: cAdvisor #- job_name: mysqld # static_configs: # - targets: ['172.17.0.3:9104'] # labels: # instance: mysql-exporter |
启动
1 2 3 4 | docker run -d --name prometheus \--restart=always -p 9090:9090 \-v /opt/prometheus/prometheus.yml:/etc/prometheus/prometheus.yml \ prom/prometheus |
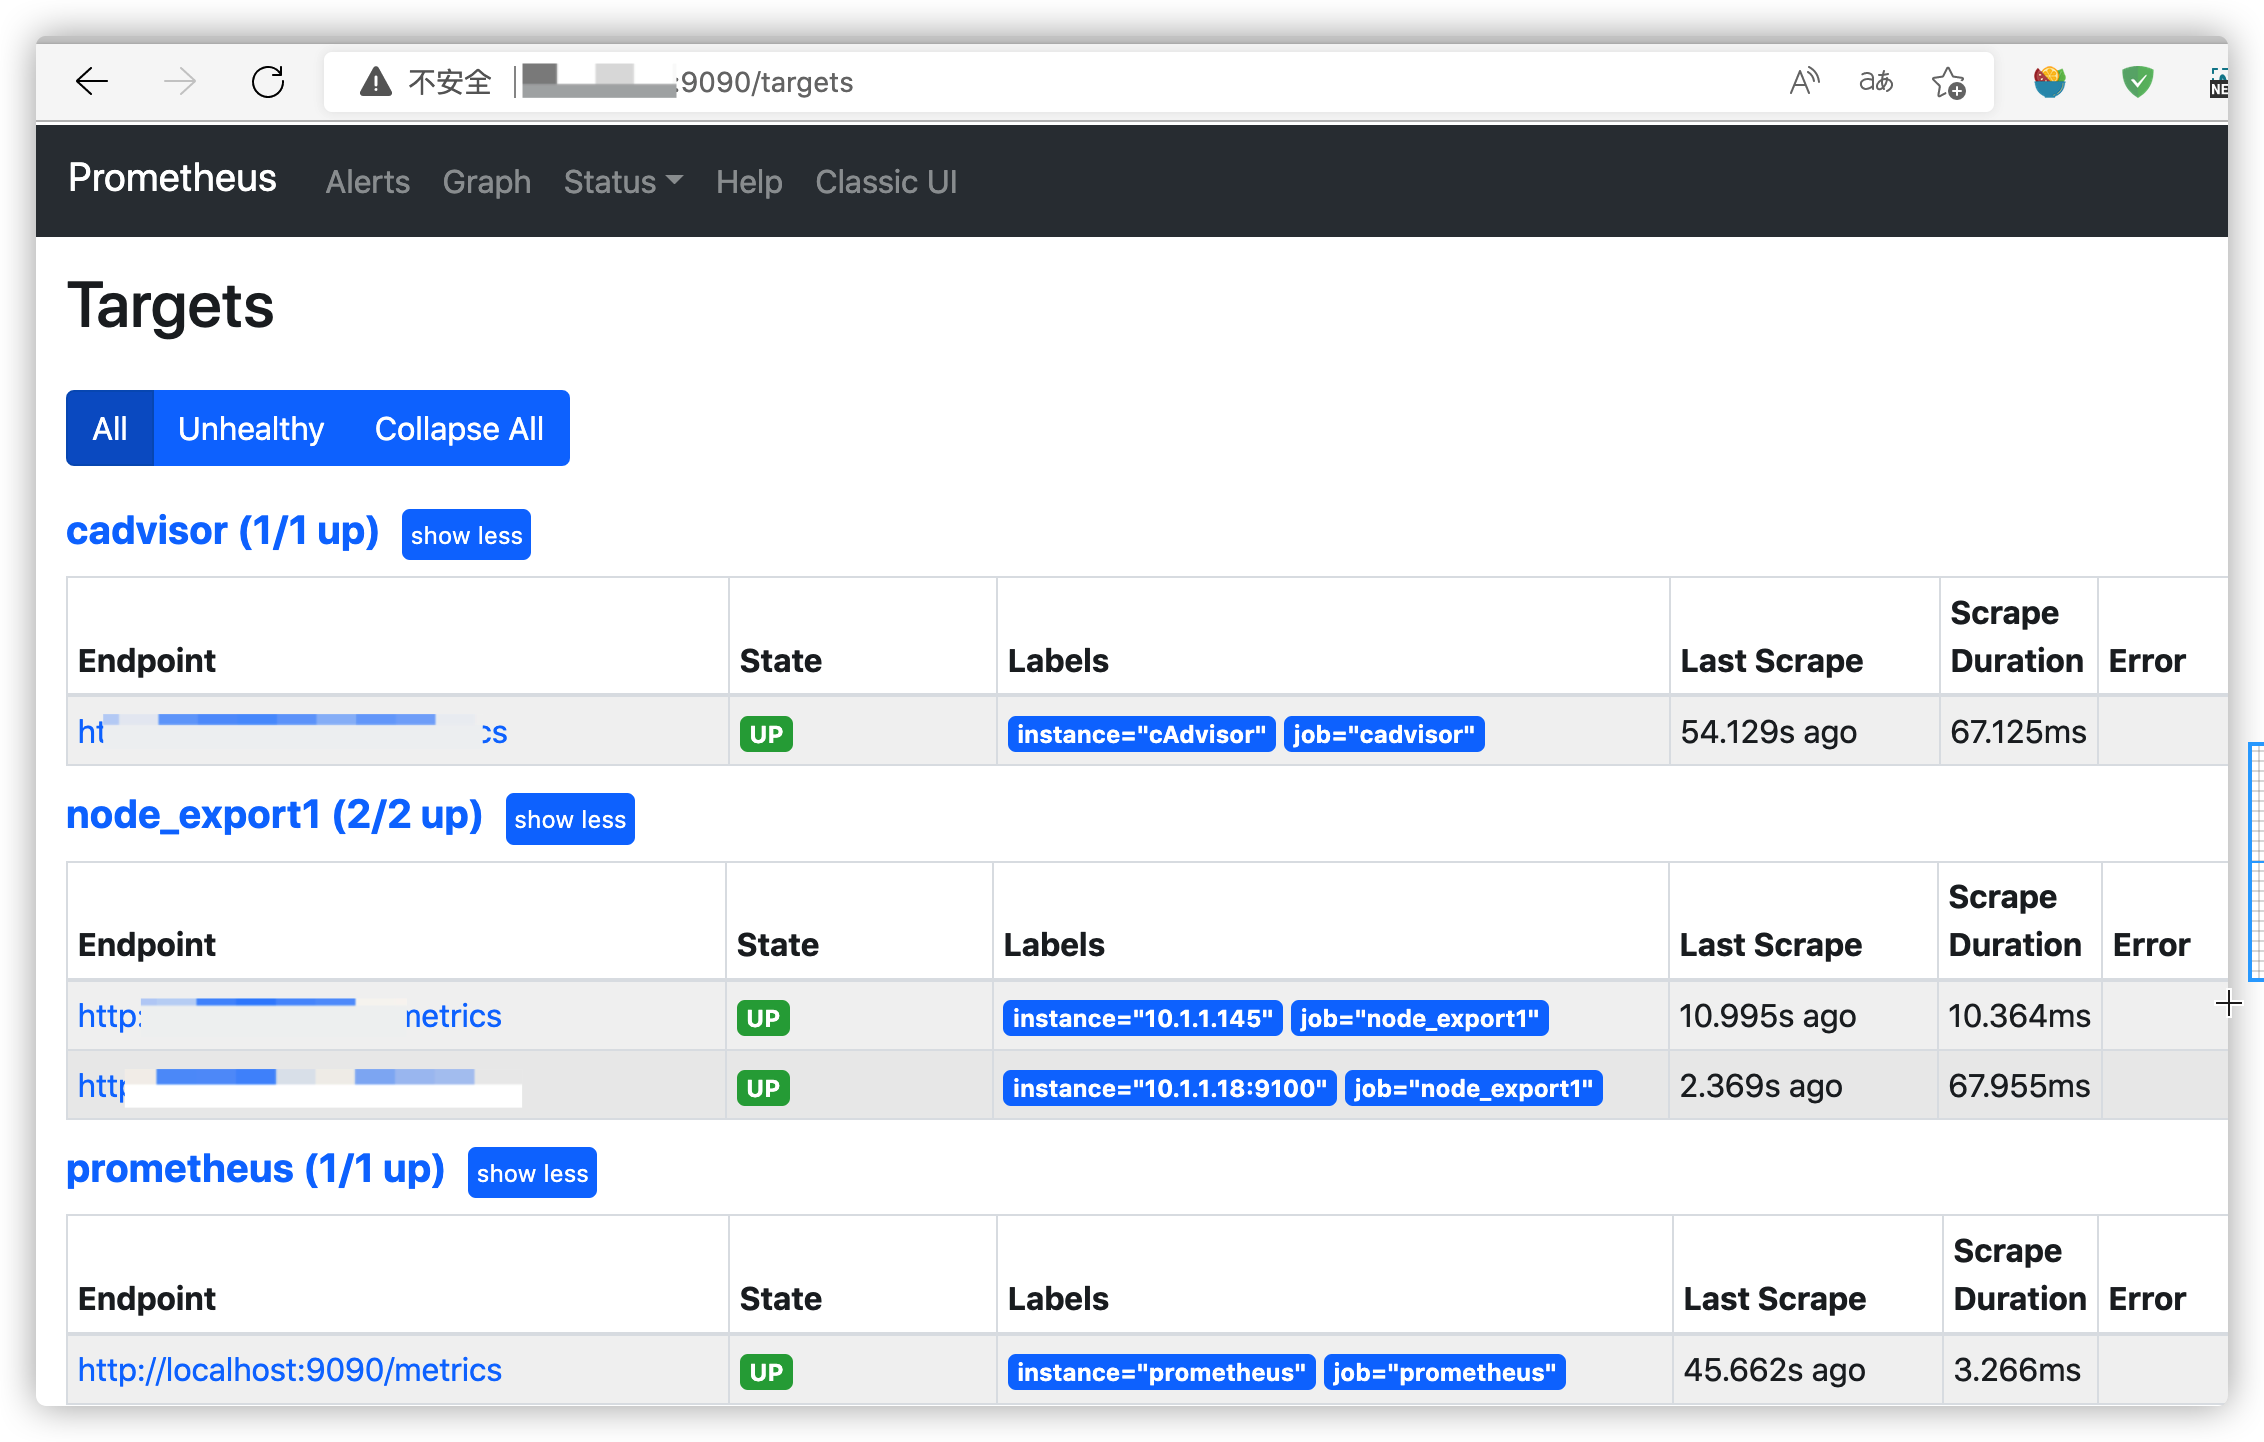
访问
6、blackbox
有这个可以监控web是否200、机器是否能ping通
配置文件见blackbox 黑盒监控随笔
1 2 3 4 5 | docker run --name prometheus-blackbox-exporter \ -p 0.0.0.0:9115:9115 \ -v /etc/blackbox-exporter/blackbox.yml:/opt/bitnami/blackbox-exporter/blackbox.yml \ --restart=always \ -itd bitnami/blackbox-exporter:latest |
7、启动grafana
新建空文件夹grafana-storage,用来存储数据
1 2 | mkdir /opt/grafana-storagechmod 777 -R /opt/grafana-storage |
启动
1 2 3 4 | docker run -d --name grafana \--restart=always -p 3000:3000 -v /opt/grafana-storage:/var/lib/grafana \grafana/grafana |
添加模版
物理机/虚拟机(Linux)监控
1 | 8919、12633 不错 |
域名证书监控
1 | 13230 |
黑盒监控
1 | 7587 9965 |
Dashboards | Grafana Labs 获取更多面板

二、存储机制的理解
1、存储机制
Prometheus按2小时一个block进行存储,每个block由一个目录组成,该目录里包含:一个或者多个chunk文件(保存timeseries数据)、一个metadata文件、一个index文件
(通过metric name和labels查找timeseries数据在chunk文件的位置)。
最新写入的数据保存在内存block中,达到2小时后写入磁盘。为了防止程序崩溃导致数据丢失,实现了WAL(write-ahead-log)机制,启动时会以写入日志(WAL)的方式来实现重播,从而恢复数据。
删除数据时,删除条目会记录在独立的tombstone文件中,而不是立即从chunk文件删除。
通过时间窗口的形式保存所有的样本数据,可以明显提高Prometheus的查询效率,当查询一段时间范围内的所有样本数据时,只需要简单的从落在该范围内的块中查询数据即可。
这些2小时的block会在后台压缩成更大的block,数据压缩合并成更高level的block文件后删除低level的block文件。这个和leveldb、rocksdb等LSM树的思路一致。
1 2 3 4 5 6 7 8 9 10 11 12 13 14 15 16 17 18 19 20 21 | ls -ltotal 24drwxr-xr-x 3 nobody nobody 68 May 17 17:00 01G39FDTYAK5V43XX10G0C9F9Ydrwxr-xr-x 3 nobody nobody 68 May 17 23:00 01G3A410JR2NM964E9YR9ADZQ9drwxr-xr-x 3 nobody nobody 68 May 18 03:00 01G3AHREXK2SBKZRTECJFHPWNDdrwxr-xr-x 3 nobody nobody 68 May 18 05:00 01G3ARK4A6MAWXPC5WHXMKN2NCdrwxr-xr-x 3 nobody nobody 68 May 18 05:00 01G3ARK4J3PSEZJAN1K3YNY5A6drwxr-xr-x 3 nobody nobody 68 May 18 07:00 01G3AZEVJ6948118FYZZXGB5APdrwxr-xr-x 2 nobody nobody 20 May 18 08:00 chunks_head-rw-r--r-- 1 nobody nobody 0 May 18 07:41 lock-rw-r--r-- 1 nobody nobody 20001 May 18 07:45 queries.activedrwxr-xr-x 3 nobody nobody 4096 May 18 07:41 wal/prometheus $/prometheus $ ls wal/00000016 00000018 00000020 00000022 00000024 00000026 checkpoint.0000001500000017 00000019 00000021 00000023 00000025 00000027/prometheus $ ls 01G39FDTYAK5V43XX10G0C9F9Ychunks index meta.json tombstones/prometheus $/prometheus $ ls 01G39FDTYAK5V43XX10G0C9F9Y/chunks/000001 |
2、本地存储
可以通过命令行启动参数的方式修改本地存储的配置
| 启动参数 | 默认值 | 含义 |
|---|---|---|
| --storage.tsdb.path | data/ | Base path for metrics storage |
| --storage.tsdb.retention | 15d | How long to retain samples in the storage |
| --storage.tsdb.min-block-duration | 2h | The timestamp range of head blocks after which they get persisted |
| --storage.tsdb.max-block-duration | 36h | The maximum timestamp range of compacted blocks,It's the minimum duration of any persisted block. |
| --storage.tsdb.no-lockfile | false | Do not create lockfile in data directory |
在一般情况下,Prometheus中存储的每一个样本大概占用1-2字节大小。如果需要对Prometheus Server的本地磁盘空间做容量规划时,可以通过以下公式计算:
1 | needed_disk_space = retention_time_seconds * ingested_samples_per_second * bytes_per_sample |
从上面公式中可以看出在保留时间(retention_time_seconds)和样本大小(bytes_per_sample)不变的情况下,如果想减少本地磁盘的容量需求,只能通过减少每秒获取样本数(ingested_samples_per_second)的方式。因此有两种手段,一是减少时间序列的数量,二是增加采集样本的时间间隔。考虑到Prometheus会对时间序列进行压缩效率,减少时间序列的数量效果更明显
每个版本可能不一致,具体参考help解释
1 2 3 4 5 6 7 8 9 10 11 12 13 14 15 16 17 18 19 20 21 22 23 24 25 | prometheus --help | grep storage --storage.tsdb.path="data/" Base path for metrics storage. Use with server --storage.tsdb.retention=STORAGE.TSDB.RETENTION storage. This flag has been deprecated, use "storage.tsdb.retention.time" instead. Use with --storage.tsdb.retention.time=STORAGE.TSDB.RETENTION.TIME How long to retain samples in storage. When "storage.tsdb.retention". If neither this flag nor "storage.tsdb.retention" nor "storage.tsdb.retention.size" is set, the --storage.tsdb.retention.size=STORAGE.TSDB.RETENTION.SIZE --storage.tsdb.no-lockfile --storage.tsdb.allow-overlapping-blocks --storage.agent.path="data-agent/" Base path for metrics storage. Use with agent --storage.agent.wal-compression --storage.agent.retention.min-time=STORAGE.AGENT.RETENTION.MIN-TIME --storage.agent.retention.max-time=STORAGE.AGENT.RETENTION.MAX-TIME --storage.agent.no-lockfile --storage.remote.flush-deadline=<duration> --storage.remote.read-sample-limit=5e7 --storage.remote.read-concurrent-limit=10 --storage.remote.read-max-bytes-in-frame=1048576 options: agent, exemplar-storage, |
有了上述的理论基础,在做本地存储时就容易多了。
1、在Dockerfile中设置工作目录 :WORKDIR /prometheus。进入容器时,就在WORKDIR
2、--config.file=/etc/prometheus/prometheus.yml 指定配置文件
3、--storage.tsdb.path=/prometheus 指定存储路径,宿主机上 -v 挂载一个目录到该路径
4、--storage.tsdb.retention.time 数据保存时间,默认15天
3、远程存储
Prometheus默认是自己带有存储的,保存的时间为15天。但本地存储也意味着Prometheus无法持久化数据,无法存储大量历史数据,同时也无法灵活扩展。
为了保证Prometheus的简单性,Prometheus并没有从自身集群的维度来解决这些问题,而是定义了两种接口,remote_write/remote_read,将数据抛出去,你自己处理。
prometheus通过下面两种方式来实现与其他的远端存储系统对接:
-
Prometheus 按照标准的格式将metrics写到远端存储
-
Prometheus 按照标准格式从远端的url来读取metrics
4、prometheus设置快照
加上启动参数
1 | --web.enable-admin-api |
调用api生成快照
1 | curl -XPOST http://storage0002:9090/api/v1/admin/tsdb/snapshot |
{"status":"success","data":{"name":"20210421T105410Z-4def1b8d4ac9ad17"}}%
同步结果到目标主机
1 | rsync -pgoav --progress root@x.x.x.x:/data/prometheus/prometheus-data/data/snapshots . |
HTTP API | Prometheus prometheus api
https://blog.51cto.com/msiyuetian/2369130
https://yasongxu.gitbook.io/container-monitor/yi-.-kai-yuan-fang-an/di-1-zhang-cai-ji/kube-state-metrics