Nginx日志监控、网站访问统计
一、nginx log分析工具ngxtop
ngxtop是一个基于python的程序,可以在Python上安装。ngxtop通过实时解析nginx访问日志,并将结果(nginx服务器的有用指标)输出到终端。
ngxtop解析nginx访问日志并输出nginx服务器的有用的顶级度量,可以实时判断服务器发生了什么。
主要的功能
-
当前有效请求
-
总请求计数摘要
-
按状态代码提供的总请求数(2xx,3xx,4xx,5xx)
-
发送平均字节
-
顶级远程地址
不仅能实时监控Nginx日志的访问还可以对以前的日志进行排查整理。
在Linux上安装ngxtop
首先,你需要安装PIP(Python包管理系统)
-
使用root凭据登录你的服务器
-
通过安装以下包启用EPEL存储库
1 2 3 4 5 6 7 8 | wget http://dl.fedoraproject.org/pub/epel/7/x86_64/e/epel-release-7-6.noarch.rpmrpm -ivh epel-release-7-6.noarch.rpm# 然后执行以下命令安装pipyum install python-pip# 最后使用下面安装ngxtoppip install ngxtop |
ngxtop使用详解
1 2 3 4 5 6 7 8 9 10 11 12 13 14 15 16 17 18 19 20 21 22 23 24 25 26 27 28 | Usage: ngxtop [options] ngxtop [options] (print|top|avg|sum) <var> ngxtop infoOptions: -l <file>, --access-log <file> access log file to parse. -f <format>, --log-format <format> log format as specify in log_format directive. --no-follow ngxtop default behavior is to ignore current lines in log and only watch for new lines as they are written to the access log. Use this flag to tell ngxtop to process the current content of the access log instead. -t <seconds>, --interval <seconds> report interval when running in follow mode [default: 2.0] -g <var>, --group-by <var> group by variable [default: request_path] -w <var>, --having <expr> having clause [default: 1] -o <var>, --order-by <var> order of output for default query [default: count] -n <number>, --limit <number> limit the number of records included in report for top command [default: 10] -a <exp> ..., --a <exp> ... add exp (must be aggregation exp: sum, avg, min, max, etc.) into output -v, --verbose more verbose output -d, --debug print every line and parsed record -h, --help print this help message. --version print version information. Advanced / experimental options: -c <file>, --config <file> allow ngxtop to parse nginx config file for log format and location. -i <filter-expression>, --filter <filter-expression> filter in, records satisfied given expression are processed. -p <filter-expression>, --pre-filter <filter-expression> in-filter expression to check in pre-parsing phase. |
ngxtop实践
1.使用ngxtop命令查看请求计数摘要,请求的URI,状态码请求的数量。
1 2 3 4 5 6 7 8 9 10 11 12 13 14 15 16 17 18 19 20 21 | $ ngxtoprunning for 411 seconds, 64332 records processed: 156.60 req/secSummary:| count | avg_bytes_sent | 2xx | 3xx | 4xx | 5xx ||---------+------------------+-------+-------+-------+-------|| 64332 | 2775.251 | 61262 | 2994 | 71 | 5 |Detailed:| request_path | count | avg_bytes_sent | 2xx | 3xx | 4xx | 5xx ||------------------------------------------+---------+------------------+-------+-------+-------+-------|| /abc/xyz/xxxx | 20946 | 434.693 | 20935 | 0 | 11 | 0 || /xxxxx.json | 5633 | 1483.723 | 5633 | 0 | 0 | 0 || /xxxxx/xxx/xxxxxxxxxxxxx | 3629 | 6835.499 | 3626 | 0 | 3 | 0 || /xxxxx/xxx/xxxxxxxx | 3627 | 15971.885 | 3623 | 0 | 4 | 0 || /xxxxx/xxx/xxxxxxx | 3624 | 7830.236 | 3621 | 0 | 3 | 0 || /static/js/minified/utils.min.js | 3031 | 1781.155 | 2104 | 927 | 0 | 0 || /static/js/minified/xxxxxxx.min.v1.js | 2889 | 2210.235 | 2068 | 821 | 0 | 0 || /static/tracking/js/xxxxxxxx.js | 2594 | 1325.681 | 1927 | 667 | 0 | 0 || /xxxxx/xxx.html | 2521 | 573.597 | 2520 | 0 | 1 | 0 || /xxxxx/xxxx.json | 1840 | 800.542 | 1839 | 0 | 1 | 0 | |
2.检查顶级客户端的IP
查看谁向你的Nginx服务器发出大量请求
1 2 3 4 5 6 7 8 9 10 11 12 13 14 15 16 | $ ngxtop top remote_addrrunning for 20 seconds, 3215 records processed: 159.62 req/sectop remote_addr| remote_addr | count ||-----------------+---------|| 118.173.177.161 | 20 || 110.78.145.3 | 16 || 171.7.153.7 | 16 || 180.183.67.155 | 16 || 183.89.65.9 | 16 || 202.28.182.5 | 16 || 1.47.170.12 | 15 || 119.46.184.2 | 15 || 125.26.135.219 | 15 || 125.26.213.203 | 15 | |
3.列出4xx或5xx响应码
1 2 3 4 5 6 7 | $ ngxtop -i 'status >= 400' print request status http_referer<br>running for 2 seconds, 28 records processed: 13.95 req/secrequest, status, http_referer:| request | status | http_referer ||-----------+----------+----------------|| - | 400 | - | |
4.分析access.log
1 | ngxtop -l /path/access.log |
5.使用通用格式从远程服务器解析apache日志
1 2 3 4 5 6 7 8 9 10 11 12 13 14 15 16 17 18 19 20 21 22 23 | ngxtop -f common -l /path/access.log$ ssh user@remote_server tail -f /var/log/apache2/access.log | ngxtop -f commonrunning for 20 seconds, 1068 records processed: 53.01 req/secSummary:| count | avg_bytes_sent | 2xx | 3xx | 4xx | 5xx ||---------+------------------+-------+-------+-------+-------|| 1068 | 28026.763 | 1029 | 20 | 19 | 0 |Detailed:| request_path | count | avg_bytes_sent | 2xx | 3xx | 4xx | 5xx ||------------------------------------------+---------+------------------+-------+-------+-------+-------|| /xxxxxxxxxx | 199 | 55150.402 | 199 | 0 | 0 | 0 || /xxxxxxxx/xxxxx | 167 | 47591.826 | 167 | 0 | 0 | 0 || /xxxxxxxxxxxxx/xxxxxx | 25 | 7432.200 | 25 | 0 | 0 | 0 || /xxxx/xxxxx/x/xxxxxxxxxxxxx/xxxxxxx | 22 | 698.727 | 22 | 0 | 0 | 0 || /xxxx/xxxxx/x/xxxxxxxxxxxxx/xxxxxx | 19 | 7431.632 | 19 | 0 | 0 | 0 || /xxxxx/xxxxx/ | 18 | 7840.889 | 18 | 0 | 0 | 0 || /xxxxxxxx/xxxxxxxxxxxxxxxxx | 15 | 7356.000 | 15 | 0 | 0 | 0 || /xxxxxxxxxxx/xxxxxxxx | 15 | 9978.800 | 15 | 0 | 0 | 0 || /xxxxx/ | 14 | 0.000 | 0 | 14 | 0 | 0 || /xxxxxxxxxx/xxxxxxxx/xxxxx | 13 | 20530.154 | 13 | 0 | 0 | 0 | |
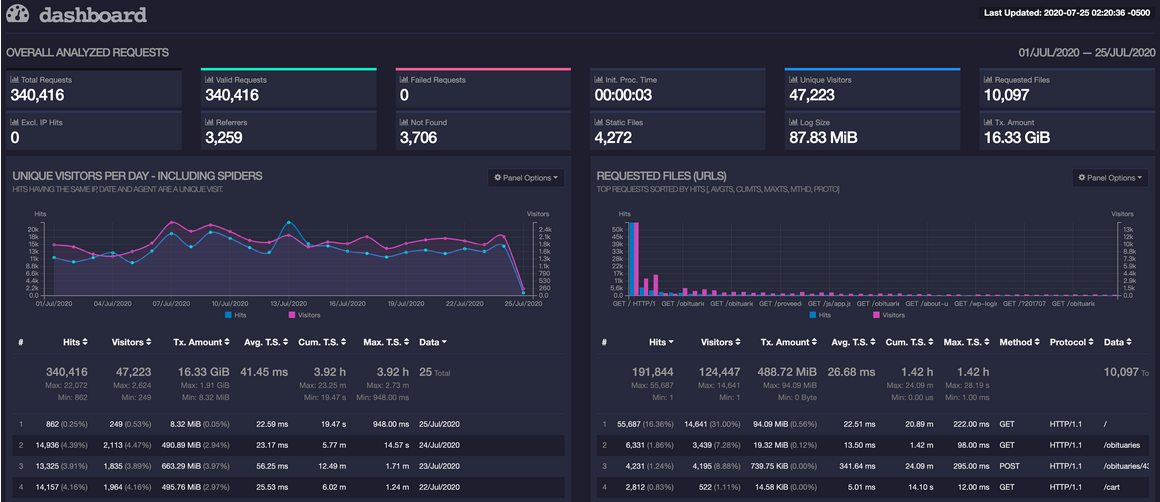
二、GoAccess实时分析绘制访问日志面板
GoAccess使用场景
对于想在短时间内快速的生成小站点访问情况的统计数据,一般会选择使用sed、awk、grep三剑客,但是对于要对数据的展示就需要填充到已有开发面板中,比较耗时费力,当然对于也可以使用ELK/EFK专业日志分析平台来做,但搭建缓慢,服务笨重,不是小站点的首选,这里介绍一个使用Go语言研发的轻量级日志分析工具GoAccess,性能稳定,可作为小站点日志分析统计的首选。
GoAccess功能
GoAccess随着不断地版本迭代,其支持的功能也越来与丰富、越来越能满足基本的需求,下面列举几个基础功能,更多可参见GoAccess Feature
- 可以实时分析几乎所有的web日志格式,并且还支持自定义日志格式
- 满足日常需要关注的基础指标
- 安装和部署简单,只需要依赖一个
ncurses库 - 可以在命令行终端试试显示统计报告,也可以输出到静态html页面展示分析统计数据报告。
- 支持扩展的模块…
实践说明
安装goaccess仅有需要依赖的ncurses库
1 | sudo apt-get install libncursesw5-dev |
当需要把Nginx访问日志中的geoip给统计导入到新的文件中时,需要GeoIP库的支持
1 2 3 4 5 6 | $ wget https://github.com/maxmind/geoip-api-c/releases/download/v1.6.11/GeoIP-1.6.11.tar.gz$ tar -xzvf GeoIP-1.6.11.tar.gz$ cd GeoIP-1.6.11$ ./configure$ make$ make install |
完成Goaccess依赖的环境之后,开始构建goacess工具
1 2 3 4 | wget http://tar.goaccess.io/goaccess-1.2.tar.gztar xf goaccess-1.2.tar.gz && cd goaccess-1.2/./configure --enable-utf8 --enable-geoip=legacy --with-opensslmake && make install |
centos7安装
1 2 3 4 5 6 | #centos7wget -O /etc/yum.repos.d/CentOS-Base.repo http://mirrors.aliyun.com/repo/Centos-7.repowget -O /etc/yum.repos.d/epel.repo http://mirrors.aliyun.com/repo/epel-7.repo #安装依赖包yum -y install glib2 glib2-devel ncurses ncurses-devel GeoIP GeoIP-devel GeoIP-data |
安装Goaccess 由于网络问题,使用abcdocker提供软件包下载
1 2 3 4 5 6 7 8 9 10 11 12 13 14 15 16 | #abcdocker提供软件包下载wget http://down.i4t.com/goaccess-1.3.tar.gztar xf goaccess-1.3.tar.gzcd goaccess-1.3./configure --prefix=/usr/local/goaccess1.3 --enable-utf8 --enable-geoip=legacy --with-opensslmake && make install #官方下载wget https://tar.goaccess.io/goaccess-1.3.tar.gztar xf goaccess-1.3.tar.gzcd goaccess-1.3./configure --prefix=/usr/local/goaccess1.3 --enable-utf8 --enable-geoip=legacy --with-opensslmake && make install #设置软链ln -s /usr/local/goaccess1.3 /usr/local/goaccess |
对goaccess做一些配置
1 2 3 4 5 6 7 8 9 10 11 12 13 14 15 16 17 18 19 20 21 22 23 24 25 26 27 28 29 30 31 32 33 34 | 1.配置环境变量echo "export PATH=/usr/local/goaccess/bin:$PATH" >>/etc/profilesource /etc/profile 2.配置文件修改# vim /usr/local/goaccess/etc/goaccess/goaccess.conftime-format %H:%M:%Sdate-format %d/%b/%Ylog-format %h %^[%d:%t %^] "%r" %s %b "%R" "%u" 3.配置文件参数说明 %x 匹配 time-format 和 date-format 变量的日期和时间字段。用于使用时间戳来代替日期和时间两个独立变量的场景。 %t 匹配 time-format 变量的时间字段。 %d 匹配 date-format 变量的日期字段。 %v 根据 canonical 名称设定的服务器名称(服务区或者虚拟主机)。 %e 请求文档时由 HTTP 验证决定的用户 ID。 %h 主机(客户端IP地址,IPv4 或者 IPv6)。 %r 客户端请求的行数。这些请求使用分隔符(单引号,双引号)引用的部分可以被解析。否则,需要使用由特殊格式说明符(例如:%m, %U, %q 和 %H)组合格式去解析独立的字段。 注意: 既可以使用 %r 获取完整的请求,也可以使用 %m, %U, %q and %H 去组合你的请求,但是不能同时使用。 %m 请求的方法。 %U 请求的 URL。 注意: 如果查询字符串在 %U中,则无需使用 %q。但是,如果 URL 路径中没有包含任何查询字符串,则你可以使用 %q 查询字符串将附加在请求后面。 %q 查询字符串。 %H 请求协议。 %s 服务器回传客户端的状态码。 %b 回传客户端的对象的大小。 %R HTTP 请求的 "Referer" 值。 %u HTTP 请求的 "UserAgent" 值。 %D 处理请求的时间消耗,使用微秒计算。 %T 处理请求的时间消耗,使用带秒和毫秒计算。 %L 处理请求的时间消耗,使用十进制数表示的毫秒计算。 %^ 忽略此字段。 %~ 继续解析日志字符串直到找到一个非空字符(!isspace)。 ~h 在 X-Forwarded-For (XFF) 字段中的主机(客户端 IP 地址,IPv4 或者 IPv6)。 |
我们使用Nginx的日志为例,通过解析nginx访问日志进行数据的展示,为了能准确的获取数据,下面提供一下测试时使用的nginx日志格式,log_format配置在nginx.conf的http配置段中:
1 2 3 4 5 6 7 8 9 10 | #配置1log_format main '$remote_addr - $remote_user [$time_local] "$request" ''$status $body_bytes_sent "$http_referer" ''"$http_user_agent" "$http_x_forwarded_for" "$request_body"';#配置2log_format main '$remote_addr - $remote_user [$time_local] "$request" ' '$status $body_bytes_sent "$http_cookie" "$http_referer" ' '"$http_user_agent" "$http_x_forwarded_for"'; access_log logs/access_web.log main; |
下面配置安装好GoAccess之后的配置文件:
1 2 3 4 5 6 | root@master:/webserver/nginx18# cat /etc/goaccess.conf |egrep -v '^$|^#'time-format %H:%M:%Sdate-format %d/%b/%Ylog-format %h %^[%d:%t %^] "%r" %s %b "%R" "%u"...# 上面的三行添加到配置文件中,其余的位置不需要改动 |
下面对部分的日志格式选项进行说明,更多的选项的使用可以直接参考官方文章自定义日志格式部分
1 2 3 4 5 6 7 8 9 10 11 12 13 14 | %t 匹配time-format格式的时间字段%d 匹配date-format格式的日期字段%h host(客户端ip地址,包括ipv4和ipv6)%r 来自客户端的请求行%m 请求的方法%U URL路径%H 请求协议%s 服务器响应的状态码%b 服务器返回的内容大小%R HTTP请求头的referer字段%u 用户代理的HTTP请求报头%D 请求所花费的时间,单位微秒%T 请求所花费的时间,单位秒%^ 忽略这一字段 |
在配置好之后,我们启动一个使用该nginx日志格式的服务proxy.devopsman.cn,配置文件如下:
1 2 3 4 5 6 7 8 9 10 11 | server { server_name proxy.devopsman.cn; listen 80; access_log logs/proxy.devopsman.cn.log; location / { proxy_set_header Host $host; proxy_set_header X-Real_IP $remote_addr; proxy_set_header X-Forwarded-For $proxy_add_x_forwarded_for; proxy_pass http://192.168.99.1; }} |
通过命令行进行访问该服务,并且启动GoAccess的命令行控制台模式
1 2 3 4 5 6 7 8 | curl http://proxy.devopsman.cngoaccess -a -d -f ./proxy.devopsman.cn.log -p /etc/goaccess.confroot@master:/webserver/nginx18/logs# pwd/webserver/nginx18/logsgoaccess -a -d -f ./proxy.devopsman.cn.log -p /etc/goaccess.conf -o ${proxy.devopsman.cn}/index.html # goaccess分析的文件输出到proxy.devopsman.cn的目录下,通过服务直接访问goaccess -a -d -f ./proxy.devopsman.cn.log -p /etc/goaccess.conf -o ${proxy.devopsman.cn}/index.html --real-time-html --daemonize# 也可以通过以上命令实时分析日志文件,渲染到html页面 |
三、Grafana展示Nginx图表(基于elk)
https://mp.weixin.qq.com/s/klzKThVzJFvApgcBsB-_Sg
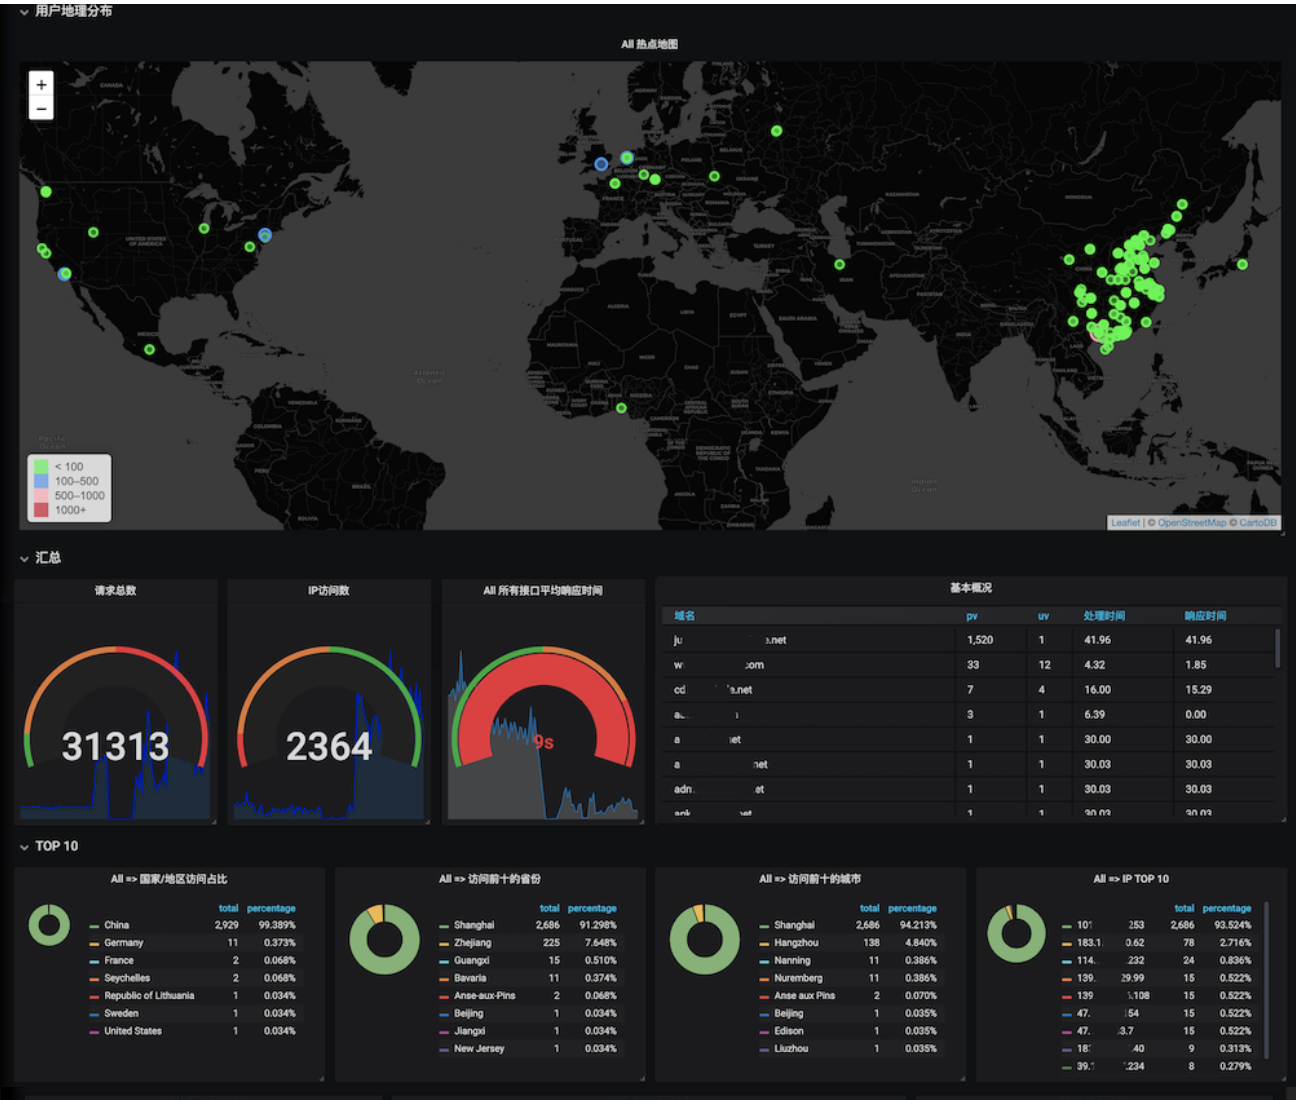
Grafana Loki Dashboard for NGINX Service Mesh | Grafana Labs
Grafana Loki Dashboard for NGINX Service Mesh
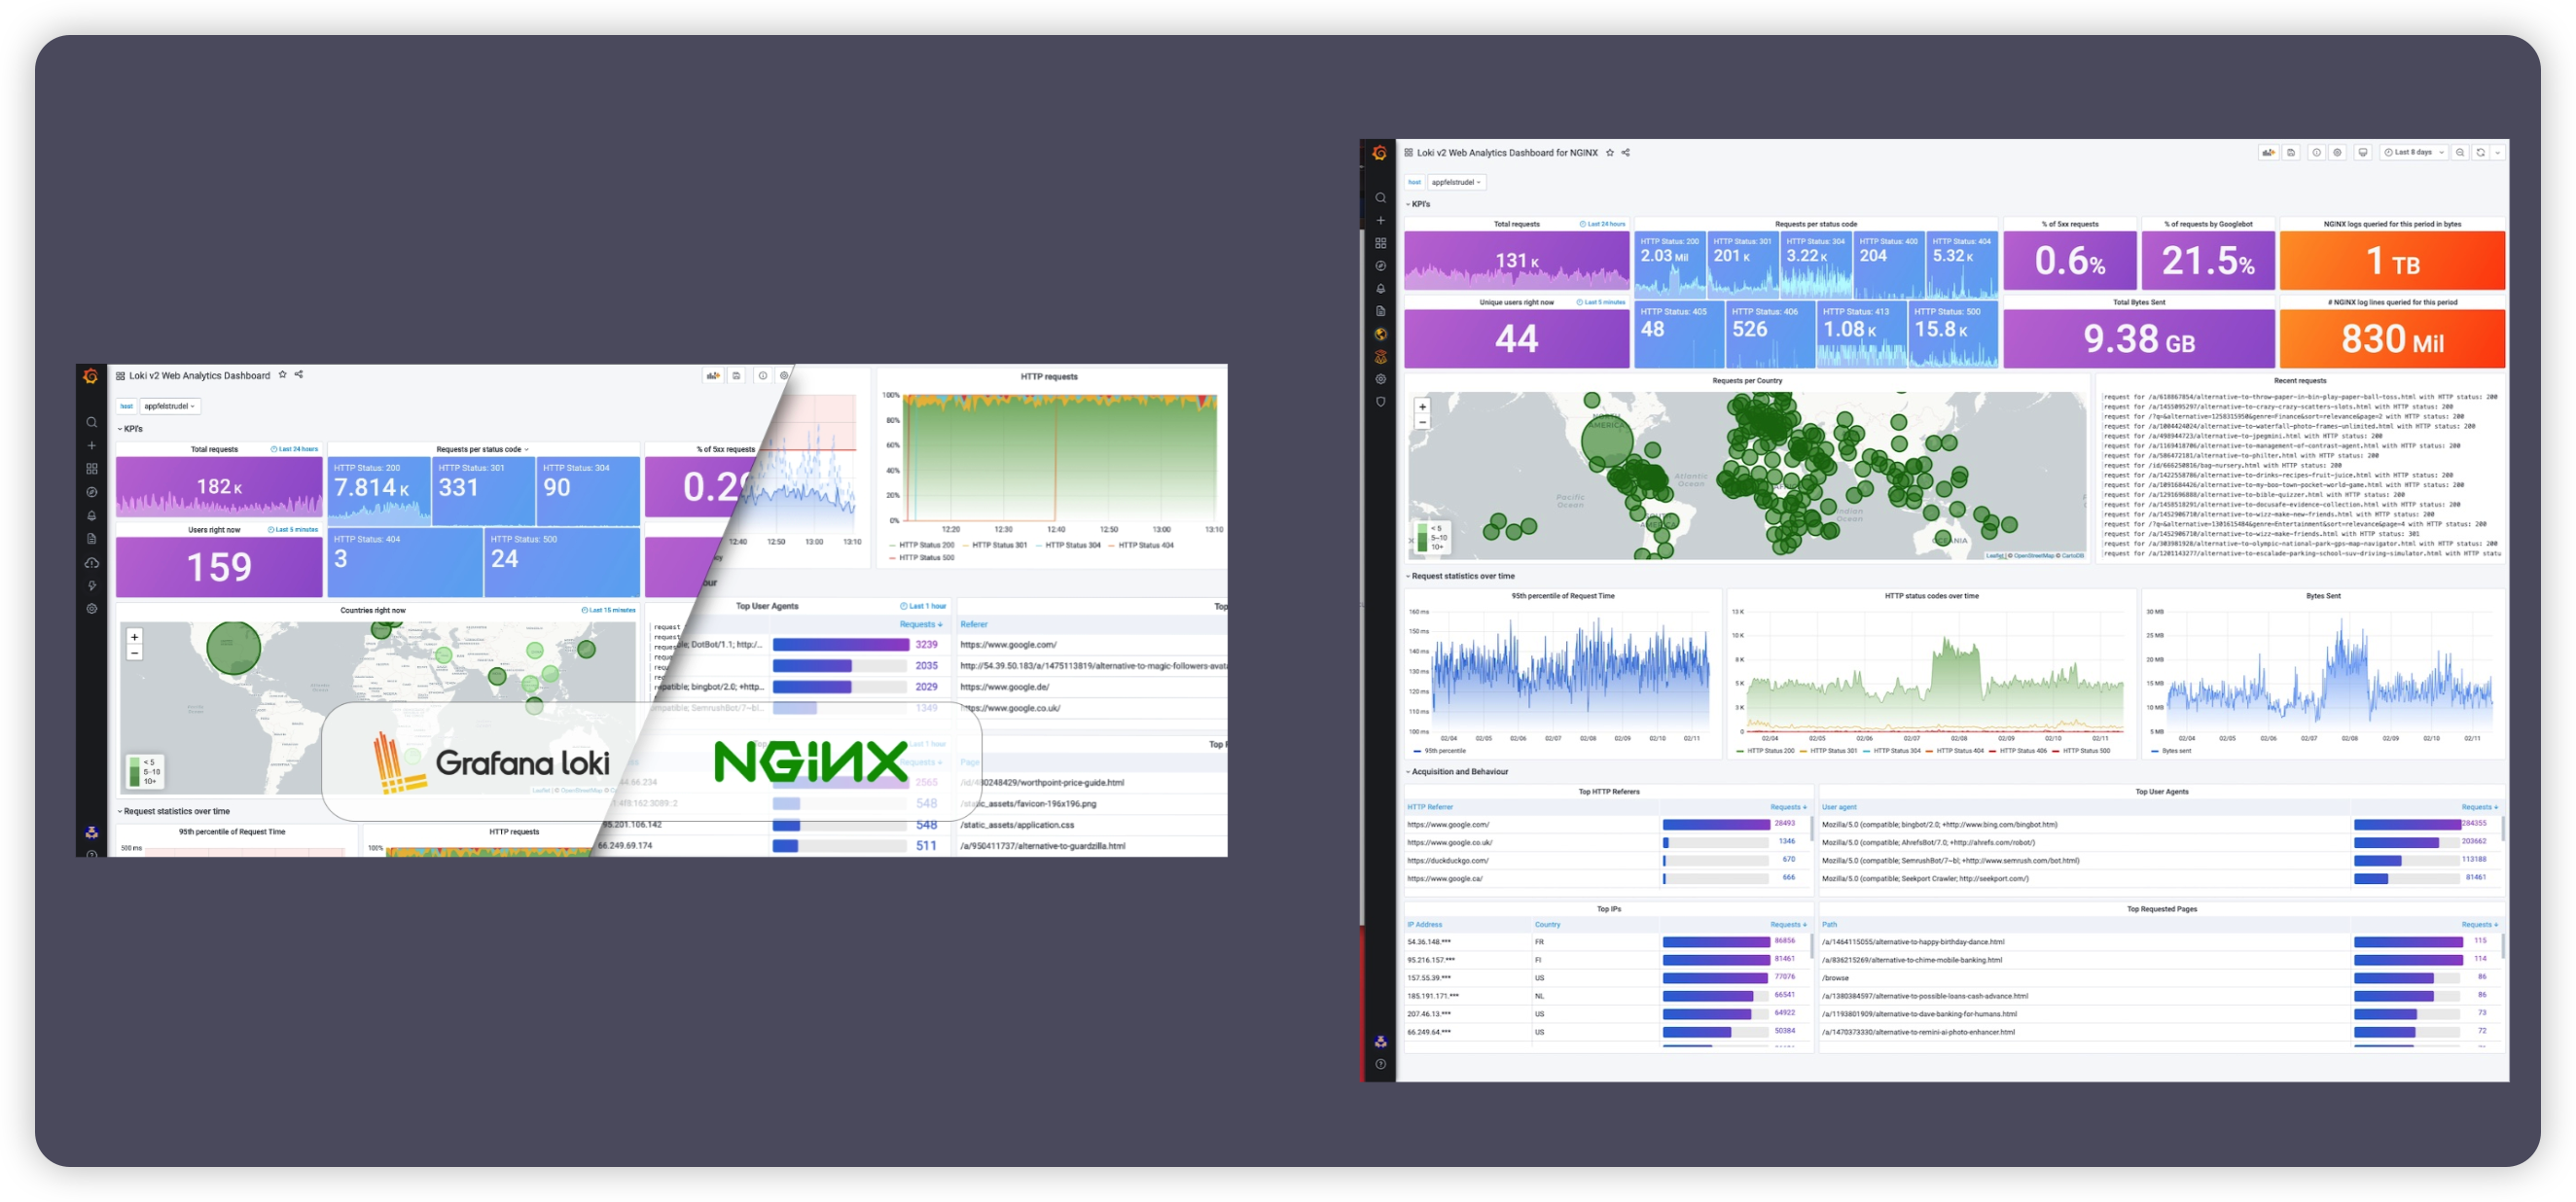
This dashboard is designed for Grafana 8.0 and higher.
Required NGINX json log format configuration below.
1 2 3 4 5 6 7 8 9 10 11 12 13 14 15 16 17 18 19 20 21 22 23 24 25 26 27 28 29 30 31 32 33 34 35 36 37 38 39 40 41 42 | log_format json_analytics escape=json '{' '"msec": "$msec", ' # request unixtime in seconds with a milliseconds resolution '"connection": "$connection", ' # connection serial number '"connection_requests": "$connection_requests", ' # number of requests made in connection '"pid": "$pid", ' # process pid '"request_id": "$request_id", ' # the unique request id '"request_length": "$request_length", ' # request length (including headers and body) '"remote_addr": "$remote_addr", ' # client IP '"remote_user": "$remote_user", ' # client HTTP username '"remote_port": "$remote_port", ' # client port '"time_local": "$time_local", ' '"time_iso8601": "$time_iso8601", ' # local time in the ISO 8601 standard format '"request": "$request", ' # full path no arguments if the request '"request_uri": "$request_uri", ' # full path and arguments if the request '"args": "$args", ' # args '"status": "$status", ' # response status code '"body_bytes_sent": "$body_bytes_sent", ' # the number of body bytes exclude headers sent to a client '"bytes_sent": "$bytes_sent", ' # the number of bytes sent to a client '"http_referer": "$http_referer", ' # HTTP referer '"http_user_agent": "$http_user_agent", ' # user agent '"http_x_forwarded_for": "$http_x_forwarded_for", ' # http_x_forwarded_for '"http_host": "$http_host", ' # the request Host: header '"server_name": "$server_name", ' # the name of the vhost serving the request '"request_time": "$request_time", ' # request processing time in seconds with msec resolution '"upstream": "$upstream_addr", ' # upstream backend server for proxied requests '"upstream_connect_time": "$upstream_connect_time", ' # upstream handshake time incl. TLS '"upstream_header_time": "$upstream_header_time", ' # time spent receiving upstream headers '"upstream_response_time": "$upstream_response_time", ' # time spend receiving upstream body '"upstream_response_length": "$upstream_response_length", ' # upstream response length '"upstream_cache_status": "$upstream_cache_status", ' # cache HIT/MISS where applicable '"ssl_protocol": "$ssl_protocol", ' # TLS protocol '"ssl_cipher": "$ssl_cipher", ' # TLS cipher '"scheme": "$scheme", ' # http or https '"request_method": "$request_method", ' # request method '"server_protocol": "$server_protocol", ' # request protocol, like HTTP/1.1 or HTTP/2.0 '"pipe": "$pipe", ' # "p" if request was pipelined, "." otherwise '"gzip_ratio": "$gzip_ratio", ' '"http_cf_ray": "$http_cf_ray",' '"geoip_country_code": "$geoip_country_code"' '}'; access_log /var/log/nginx/json_access.log json_analytics; |
For IP to country mapping, also enable the Geo_IP module:
1 2 | geoip_country /etc/nginx/GeoIP.dat;geoip_city /etc/nginx/GeoIPCity.dat; |
My promtail configuration:
1 2 3 4 5 6 7 8 9 10 11 12 13 14 15 16 17 18 19 20 21 22 23 24 | server: http_listen_port: 0 grpc_listen_port: 0positions: filename: /tmp/positions.yamlclients: - url: https://USER:PASSWORD@logs-prod-us-central1.grafana.net/api/prom/pushscrape_configs: - job_name: system pipeline_stages: - replace: expression: '(?:[0-9]{1,3}\.){3}([0-9]{1,3})' replace: '***' static_configs: - targets: - localhost labels: job: nginx_access_log host: appfelstrudel agent: promtail __path__: /var/log/nginx/*access.log |
注:
需要Ngin 添加 GeoIP 模块(带 --with-http_geoip_module 即编译成功)
1 2 3 | ./configure --prefix=/usr/local/nginx --with-http_gzip_static_module \ --with-http_stub_status_module --with-http_ssl_module --with-pcre --with-file-aio \ --with-http_realip_module --with-http_geoip_module --add-module=/usr/local/nginx-module-vts-master |
Docker搭建Nginx日志高级监控-基于Loki + Promtail + Grafana - 北青永恒 (kococ.cn)
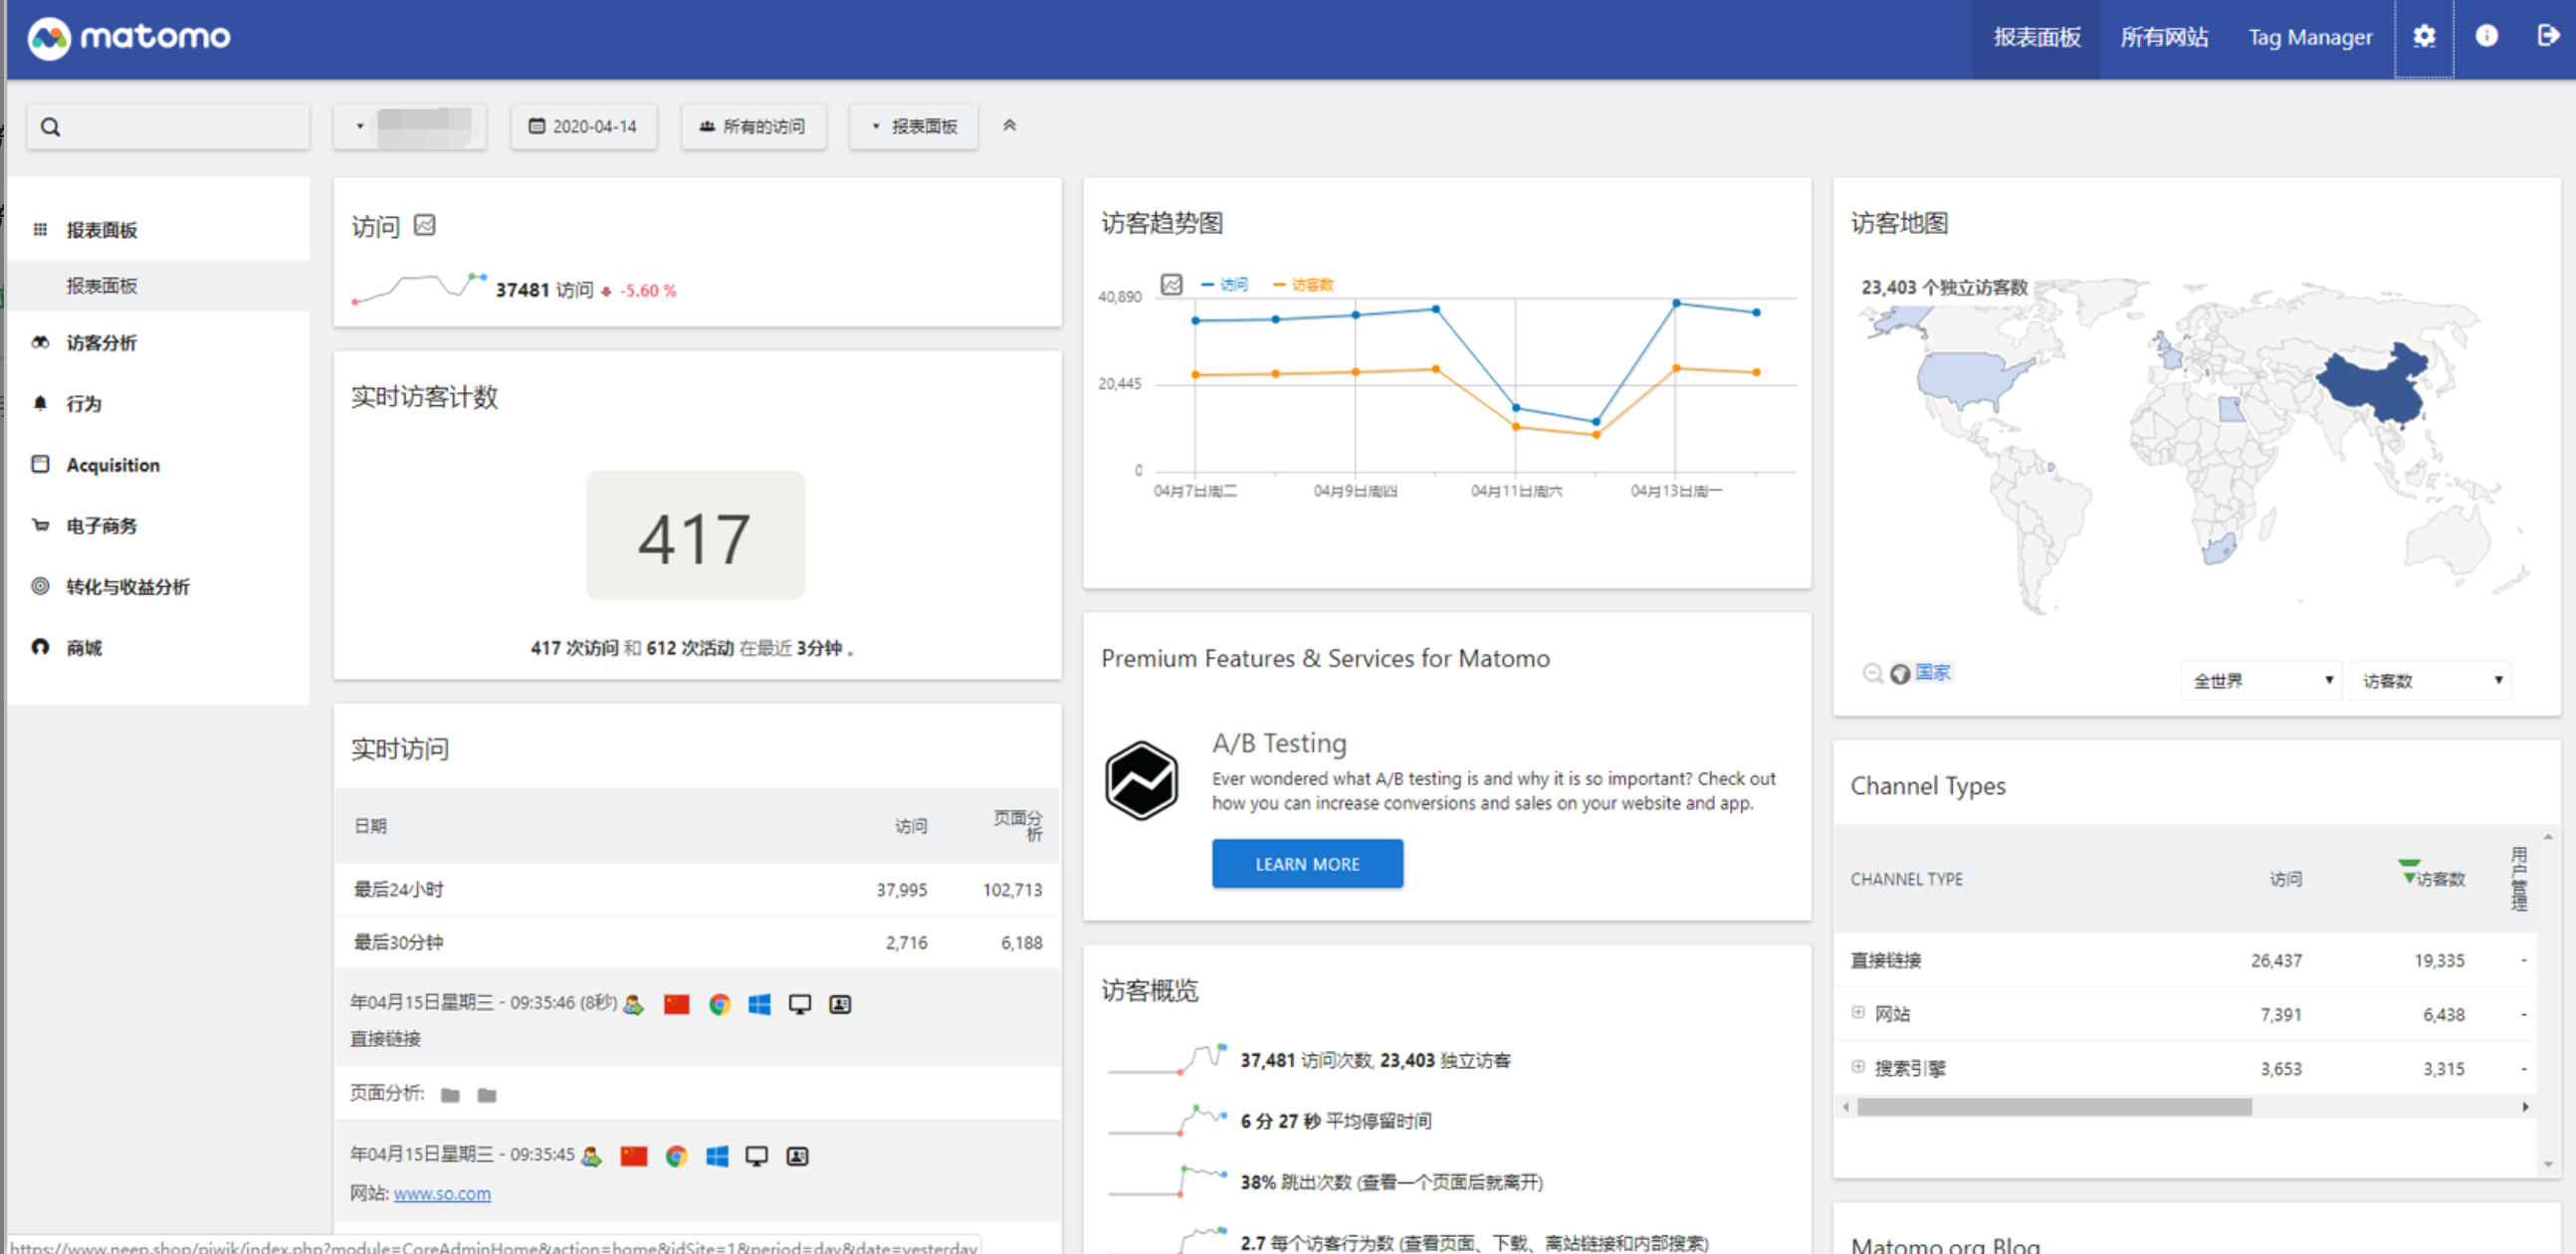
四、网站访问流量统计Matomo(Piwik)
piwik现已改名为Matomo,这是一套国外著名的开源网站统计系统,类似于百度统计、Google Analytics等系统。可以分析流量、访客数、PV、UV等信息。
Matomo相当于将流量复制了一份进行分析,所以对配置的要求比较高,尽量和负载均衡所在机器的配置一样。
部署:https://52wiki.cn/project-46/doc-389/
https://github.com/lebinh/ngxtop ngxtop项目地址
https://goaccess.io/ goaccess项目地址
https://mp.weixin.qq.com/s/hte8fb0C404ABecc1ZGf7w Flask + echarts 轻松搞定 nginx 日志可视化
https://i4t.com/4173.html GoAccess 分析Nginx 日志,整理不错