Google Maps API的使用
之前在学习了简单的API调用后,查看了几个知名网站的API调用方法,发现Google的API调用还是相对比较简单的。下面就从API key的获取、googlemaps的安装,再到实际使用做一下说明。
1.基于Python的Google MAPS服务:
Google目前在Maps方面开放的API有好几个,可以根据不同的需求进行使用:
2.系统需求:
Python 2.7及以上;
Google MAP API key
3.API key的获取方法:
1) 访问Google控制台并登陆;

2) 点击左上角的项目进行选择或者创建新项目:

这里我选择了之前创建过的项目,可以点击+号新建
3) 点击"启用API和服务"开启你需要的API;
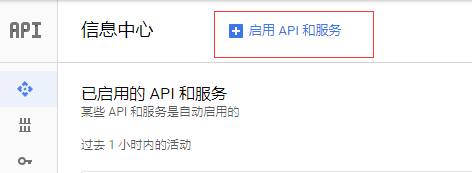

这里选择跟地图相关的API:
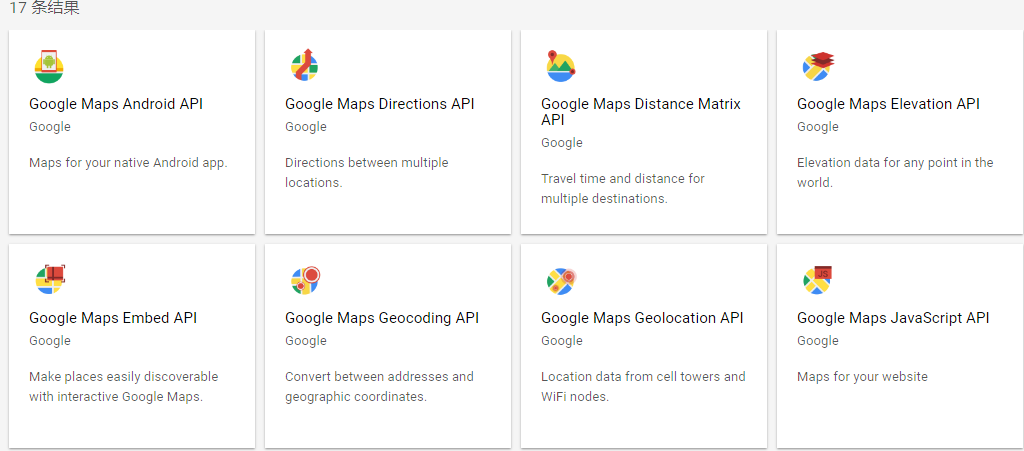
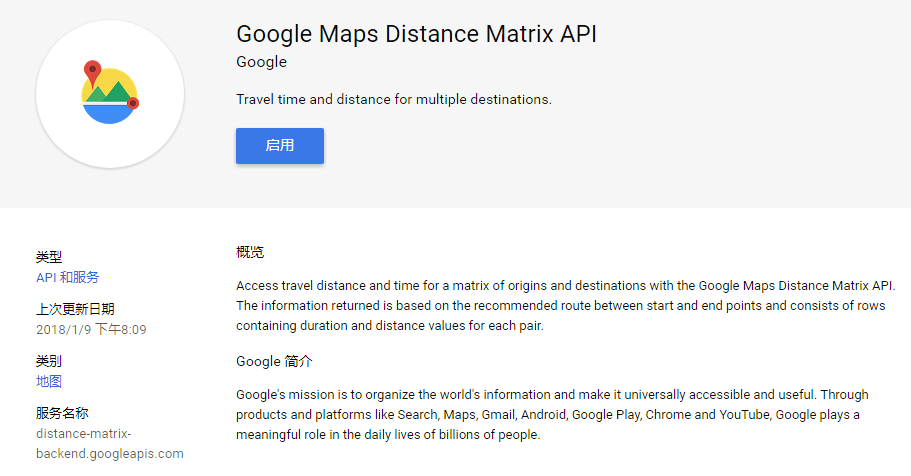
点击启用。

显示此界面就说明启用成功。
4) 创建API key;
点击左侧边栏中的"凭据"进行创建:

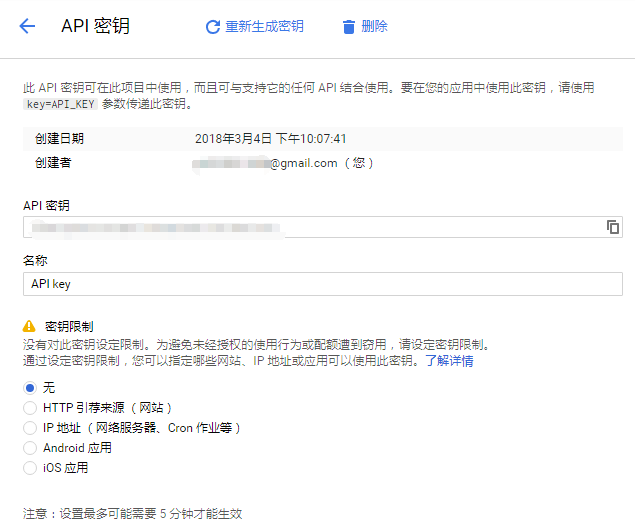
5) 限制访问IP(可选)
点击后面的修改按钮可以对密钥进行IP等设置:
4.安装googlemaps:
C:\Users\DEV>pip install -U googlemaps
Collecting googlemaps
Downloading googlemaps-2.5.1.tar.gz
Collecting requests<3.0,>=2.11.1 (from googlemaps)
Downloading requests-2.18.4-py2.py3-none-any.whl (88kB)
100% |████████████████████████████████| 92kB 112kB/s
Collecting chardet<3.1.0,>=3.0.2 (from requests<3.0,>=2.11.1->googlemaps)
Downloading chardet-3.0.4-py2.py3-none-any.whl (133kB)
100% |████████████████████████████████| 143kB 121kB/s
Collecting idna<2.7,>=2.5 (from requests<3.0,>=2.11.1->googlemaps)
Downloading idna-2.6-py2.py3-none-any.whl (56kB)
100% |████████████████████████████████| 61kB 123kB/s
Collecting certifi>=2017.4.17 (from requests<3.0,>=2.11.1->googlemaps)
Downloading certifi-2018.1.18-py2.py3-none-any.whl (151kB)
100% |████████████████████████████████| 153kB 326kB/s
Collecting urllib3<1.23,>=1.21.1 (from requests<3.0,>=2.11.1->googlemaps)
Downloading urllib3-1.22-py2.py3-none-any.whl (132kB)
100% |████████████████████████████████| 133kB 216kB/s
Building wheels for collected packages: googlemaps
Running setup.py bdist_wheel for googlemaps ... done
Stored in directory: C:\Users\DEV\AppData\Local\pip\Cache\wheels\04\e8\d1\ae5577b5339873e6a5dd55141d56e507cf281b137ef0
9ba924
Successfully built googlemaps
Installing collected packages: chardet, idna, certifi, urllib3, requests, googlemaps
Found existing installation: chardet 3.0.3
Uninstalling chardet-3.0.3:
Successfully uninstalled chardet-3.0.3
Found existing installation: idna 2.5
Uninstalling idna-2.5:
Successfully uninstalled idna-2.5
Found existing installation: requests 2.14.2
Uninstalling requests-2.14.2:
Successfully uninstalled requests-2.14.2
Successfully installed certifi-2018.1.18 chardet-3.0.4 googlemaps-2.5.1 idna-2.6 requests-2.18.4 urllib3-1.22
执行完上述操作后,我们就可以调用这些API来获取我们需要的数据了,先使用文档中的一个例子来调用试试:
import googlemaps
from datetime import datetime

gmaps = googlemaps.Client(key='Add Your Key here')

# Geocoding an address
geocode_result = gmaps.geocode('1600 Amphitheatre Parkway, Mountain View, CA')
print(geocode_result[0]['geometry']['location'])

# Look up an address with reverse geocoding
reverse_geocode_result = gmaps.reverse_geocode((40.714224, -73.961452))
print(reverse_geocode_result[0]['address_components'][1]['long_name'])
上述例子调用了geocode API,并分别打印各自的返回值。
geocode()即地理编码,根据地址以json格式返回经纬度。
reverse_geocode()即反向地理编码,根据经纬度返回具体地址。
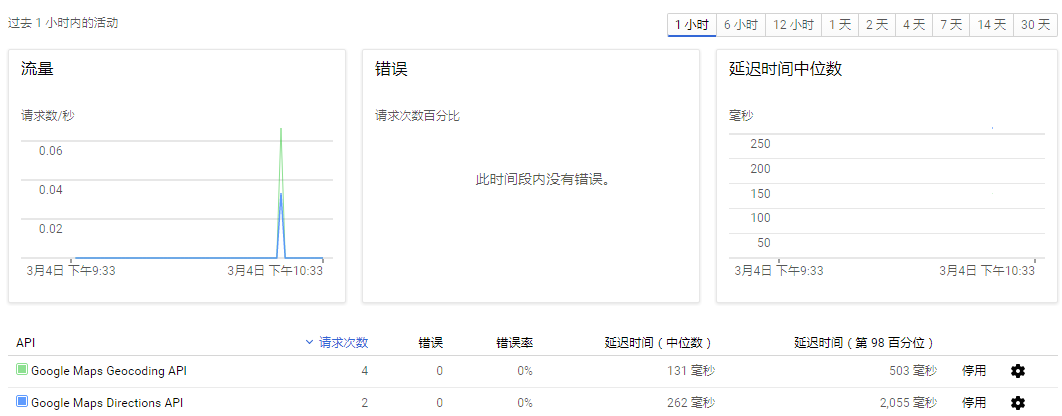
实际调用后,在API首页便可以看到调用的具体情况。
下面针对directions API进行进一步研究。
Directions API
Directions API可以用来计算两地点之间的路线,并可设置路径点及出行模式(公交、驾车、骑行、步行等)
先来看一个简单的调用例子,并分析返回的json数据的具体内容。
import googlemaps
from datetime import datetime

gmaps = googlemaps.Client(key='Add Your Key here')
# Request directions via public transit
now = datetime.now()
directions_result = gmaps.directions("Sydney Town Hall",
                                     "Parramatta, NSW",
                                     mode="transit",
                                     departure_time=now)
print(directions_result)
例子中gmaps.directions()函数的形参分别为:
起始地点(Sydney Town Hall), 目标地点(Parramatta, NSW), 出行模式(公交), 出发时间(即刻触发)
然后再来看看根据这个请求返回的数据:
第一次看时有点发晕,这么多数据啊,怎么这么复杂,该怎么搞?其实像这样将数据格式化后再分析,就比较清楚了。
'legs'中为具体的路径信息,总体结构如下:
legs: [{
'arrival_time': {}, # 到达时间
'departure_time': {}, # 出发时间(这两个时间在调用时只能指定一个,另一个通过路线规划进行预估)
'distance': {}, # 两个地点之间基于路线的距离
'duration': {}, # 需要花费的时间
'end_address': '', # 目的地地址
'end_location': {}, # 目的地经纬度
'start_address': {}, # 出发地地址
'start_location': {}, # 出发地经纬度
'steps': {}, # 具体的规划路线
'traffic_speed_entry': [],
'via_waypoint': []
}]
而在'steps'中,又细分为几段详细的路线(每一段的信息都在列表的字典元素中),并在每一步中给出了'html_instructions'指示信息,内容非常全:
steps: [
{
'distance': # 第一段路线数据
'duration':
'end_location':
'html_instructions':
'polyline':
'start_location':
'steps': [ # 第一段路线的详细路径
{
'distance': {}, #
'duration':
'end_location':
'html_instructions':
'polyline':
'start_location':
'travel_mode':
},
{
'distance': {},
... ...
},
... ...
],
'travel_mode': ''
},
{
'distance': # 第二段路线数据
... ...
},
... ...
]
可以看到实际返回的数据还是挺复杂的,但是也是非常详细,想要的数据基本上都在里面了。
单纯的获取这些零散数据是没有什么实际意义的,如果我们能基于现有的数据,或者用爬取的数据与API相结合,就能进行数据分析,并进一步得到一些结论。
根据经纬度值,让我联想到可以利用已有的出租车数据集,使用经纬度获取出租车的位置,并进行分析。
几个可用的数据集:
下面的数据使用的是Microsoft的T-Drive trajectory data数据(该数据集是由很多个.txt文件组成的,我在使用前先转换成了csv格式的文件)。
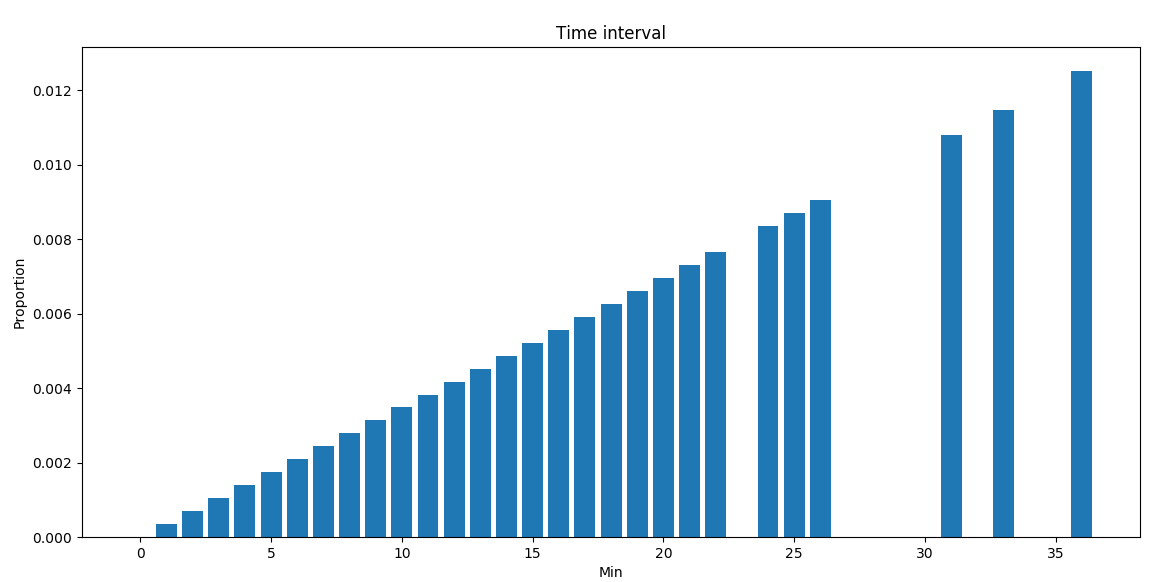
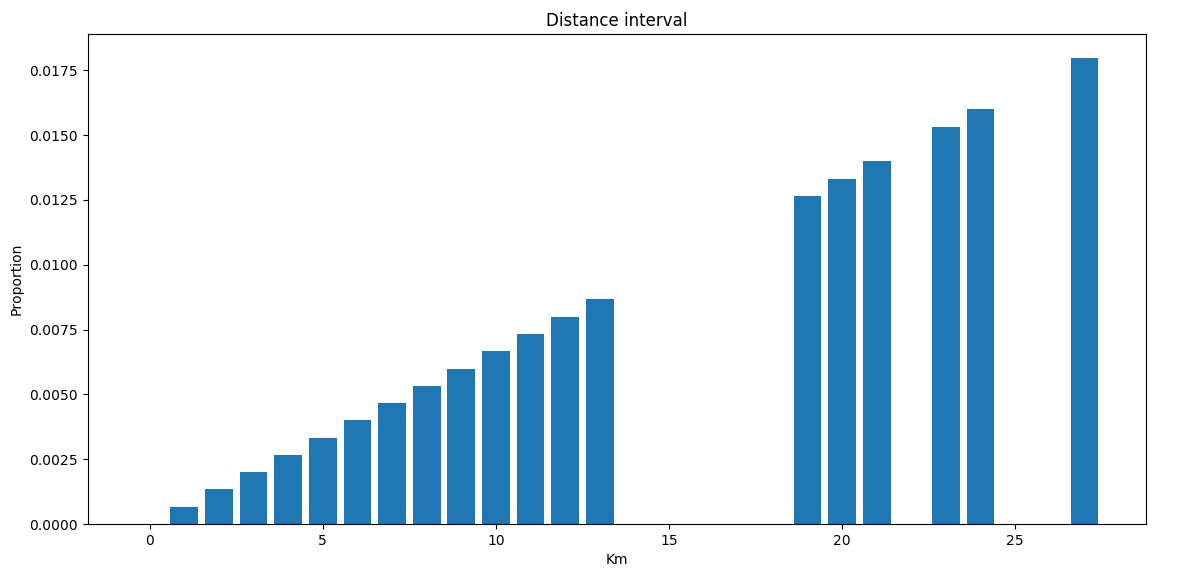
根据经纬度,从API获取两个节点开车所需的时间及距离,并作出图表,查看开车时间及距离各自所占的比重。
由于API的调用限制,我们先取前2000条的记录进行分析:

import googlemaps
from datetime import datetime
import os
import csv
import pandas as pd
import matplotlib.pyplot as plt
import math


# 将已知的多个txt文件中的内容放到一个CSV文件下
def txt2Csv(dataPath, csvname):
    fileList = os.listdir(dataPath)
    csvFile = open(dataPath + '\\' + csvname, 'w+')
    writer = csv.writer(csvFile)
    for fileName in fileList:
        with open(dataPath + '\\' + fileName) as fileObj:
            lines = fileObj.readlines()
            for line in lines:
                line = line.split(',')
                line[-1] = line[-1][0:-1]
                writer.writerow((line))
    csvFile.close()


# 根据经纬度获取两地之间的距离及花费的时间
def getDistanceDuration(key, path, csvName):
    gmaps = googlemaps.Client(key=key)
    df = pd.read_csv(path + '\\' + csvName)
    df.columns = ['id', 'time', 'longitude', 'latitude']
    durationList = []
    distanceList = []
    try:
        for i in range(1, 1000):
            now = datetime.now()
            # 调取google API的directions:
            directions_result = gmaps.directions((df.iloc[i, 3], df.iloc[i, 2]),
                                                 (df.iloc[i+1, 3], df.iloc[i+1, 2]),
                                                 mode="driving",
                                                 departure_time=now)
            # 按照返回的格式,找出distance及duration,追加到列表中并返回
            distanceList.append(directions_result[0]['legs'][0]['distance']['value'])
            durationList.append(directions_result[0]['legs'][0]['duration']['value'])
    except googlemaps.exceptions._RetriableRequest:
        pass
    return distanceList, durationList


path = 'D:\\Learnning\\python\\scrape\\taxiData\\T-drive Taxi Trajectories\\release\\taxi_log_2008_by_id'
txt2Csv(path, 'geodata.csv')

distanceList, durationList = getDistanceDuration('AIzaSyD8X6tJx6Ap5TVHlqwSso8iTwZfDWcFsOA', path, 'geodata.csv')
# 对返回数据的单位做转换, 并使用math.ceil对数据向上取整
distanceList = [math.ceil(dis/1000) for dis in distanceList]
durationList = [math.ceil(dis/60) for dis in durationList]

totalDistance = 0
totalDuration = 0
# 计算总路程,并画出每段路程的距离在总路程中的占比:
for distance in distanceList:
    totalDistance += distance
distancePropo = [distance/totalDistance for distance in distanceList]
plt.bar(distanceList, distancePropo)
plt.title("Distance interval")
plt.xlabel("Km")
plt.ylabel("Proportion")
plt.show()

# 计算总时间,并画出每段路程花费的时间在总时间中的占比:
for duration in durationList:
    totalDuration += duration
durationPropo = [duration/totalDuration for duration in durationList]
plt.bar(durationList, durationPropo)
plt.title("Time interval")
plt.xlabel("Min")
plt.ylabel("Proportion")
plt.show()
得出的图像:
按时间分布:
按行驶距离分布:


 浙公网安备 33010602011771号