echarts 官网
特点:
1.丰富的可视化类型图表
2.多数据格式无需转换
3.千万级别数据进行展示
4.移动端优化
5.多渲染方案,跨平台使用
6.深度的交互方案
7.动态数据
8.绚丽的特效
init echarts
-
通过hbuilder 创建一个项目
-
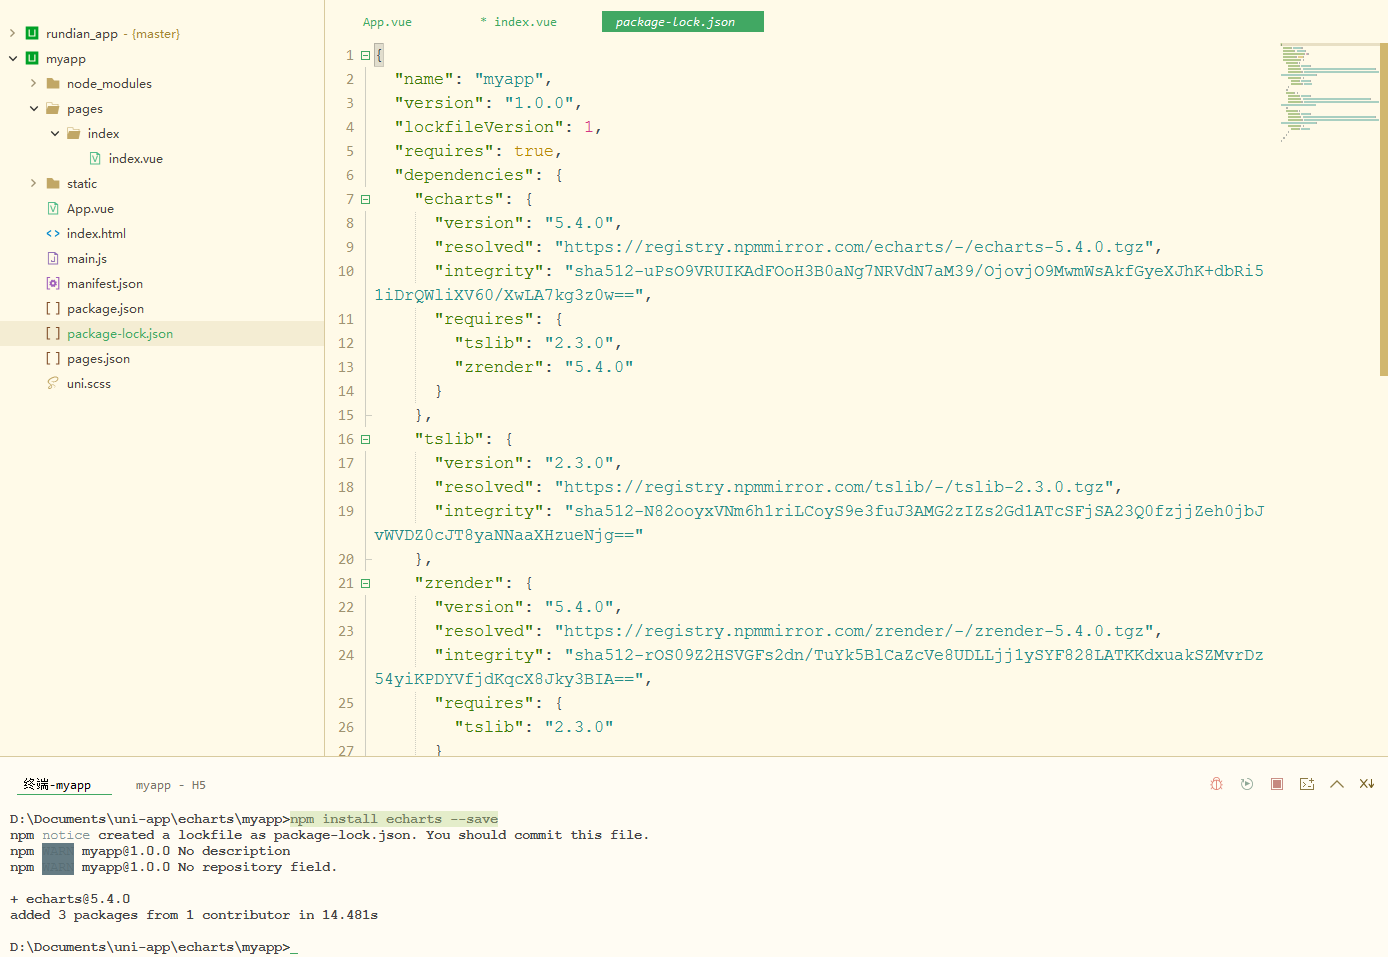
命令行打开项目 npm init
-
引入echarts 命令 npm install echarts --save

核心代码
<template>
	<!-- echarts 默认宽高是0,如果不设置宽高,不展示 -->
	<div ref="mycharts" style="width: 500px;height:500px;"></div>
</template>

<script>
	import * as echarts from 'echarts';
	export default {
		mounted() {
			let myEcharts = echarts.init(this.$refs.mycharts);
			// set option
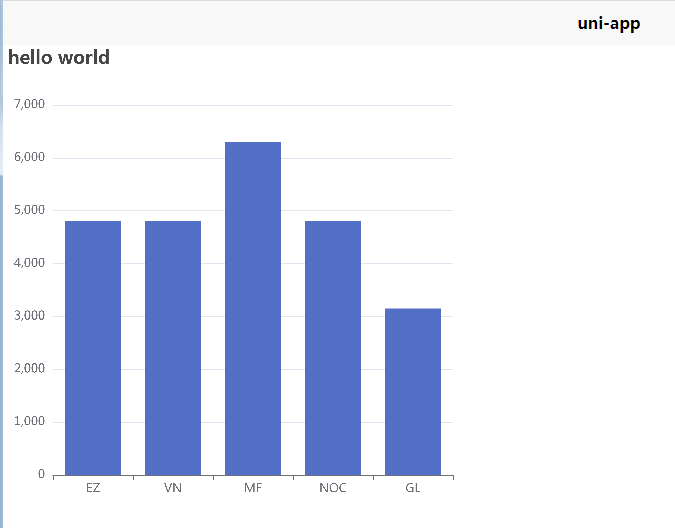
			myEcharts.setOption(
			{
				title:{ //set title
					text:'hello world',
				},
				xAxis:{ //x 轴
					data:['EZ','VN','MF','NOC','GL']
				},
				yAxis: {}, //y 轴
				series:{//系列
					name:'LOL英雄大全',
					type:'bar',//当前图标的类型,bar  柱状图
					data:[4800,4800,6300,4800,3150]
				}
			})
		},
		data() {
			return {
				title: 'Hello'
			}
		},
		onLoad() {

		},
		methods: {

		}
	}
</script>

<style>

</style>
第一个展示

配置项手册 官网
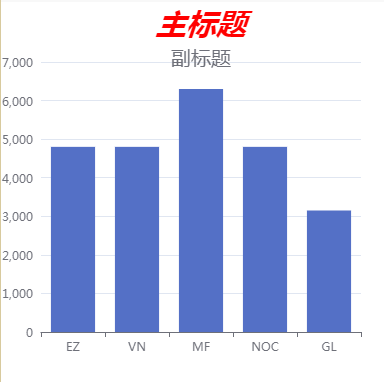
myEcharts.setOption({
				title: { //set title
					text: "主标题",
					subtext: "副标题",
					left: "center",
					// top: "center",
					textStyle: {
						fontSize: 30,
						color:'red',	//主标题文字的颜色
						fontStyle: "oblique",		//主标题文字字体的风格。
					},
					subtextStyle: {
					 fontSize: 20
					}
				},
				xAxis: { //x 轴
					data: ['EZ', 'VN', 'MF', 'NOC', 'GL']
				},
				yAxis: {}, //y 轴
				series: { //系列
					name: 'LOL英雄大全',
					type: 'bar', //当前图标的类型,bar  柱状图
					data: [4800, 4800, 6300, 4800, 3150]
				}
			})

本文来自博客园,作者:depressiom,转载请注明原文链接:https://www.cnblogs.com/depressiom/p/16831790.html
分类:
个人学习


【推荐】国内首个AI IDE,深度理解中文开发场景,立即下载体验Trae
【推荐】编程新体验,更懂你的AI,立即体验豆包MarsCode编程助手
【推荐】抖音旗下AI助手豆包,你的智能百科全书,全免费不限次数
【推荐】轻量又高性能的 SSH 工具 IShell:AI 加持,快人一步
· TypeScript + Deepseek 打造卜卦网站:技术与玄学的结合
· Manus的开源复刻OpenManus初探
· AI 智能体引爆开源社区「GitHub 热点速览」
· 从HTTP原因短语缺失研究HTTP/2和HTTP/3的设计差异
· 三行代码完成国际化适配,妙~啊~