家庭版记账本app开发之关于(数据库查找出数据)圆饼图的生成
这次完成的主要的怎样从数据库中调出数据。之后通过相关的数据,生成想要的圆饼图。以方便用户更加直观的看见关于账本的基本情况。
在圆饼图生成中用到了一些外部资源
具体的import如下:
import com.github.mikephil.charting.animation.Easing;
import com.github.mikephil.charting.charts.PieChart;
import com.github.mikephil.charting.components.Legend;
import com.github.mikephil.charting.data.PieData;
import com.github.mikephil.charting.data.PieDataSet;
import com.github.mikephil.charting.data.PieEntry;
import com.github.mikephil.charting.formatter.PercentFormatter;
import java.util.ArrayList;
这些是用到的外部的相关资源:
通过这些就可以很简单的是用圆饼图的生成:
具体的代码分析如下:
一、饼状图上字体的设置
// entry label styling
pieChart.setDrawEntryLabels(true);//设置是否绘制Label
pieChart.setEntryLabelColor(Color.RED);//设置绘制Label的颜色
pieChart.setEntryLabelTextSize(20f);//设置绘制Label的字体大小
二、饼图颜色
colors.add(Color.rgb(205, 205, 205));
colors.add(Color.rgb(114, 188, 223));
pieDataSet.setColors(colors);

pieDataSet.setSliceSpace(0f);//设置选中的Tab离两边的距离
pieDataSet.setSelectionShift(5f);//设置选中的tab的多出来的
PieData pieData = new PieData();
pieData.setDataSet(pieDataSet);

三、各个饼状图所占比例数字的设置
pieData.setValueFormatter(new PercentFormatter());//设置%
pieData.setValueTextSize(20f);
pieData.setValueTextColor(Color.YELLOW);
四、pieChart.setUsePercentValues(true);//设置value是否用显示百分数,默认为false
。这些是用到的主要知识点:
具体的代码只有一个.java文件还有一个.xml文件
java文件如下:
public class  ThePieChare3 extends AppCompatActivity {
    private PieChart pieChart;
    private Context context;
    private Intent intent2;
    private String username;
    private int zhichujine,shourujine;
    private DBOpenMessage dbOpenMessage;
    private TextView shourutxt,zhichutxt;

    @Override
    protected void onCreate(Bundle savedInstanceState) {
        super.onCreate(savedInstanceState);
        setContentView(R.layout.piechare3);
        pieChart = (PieChart) findViewById(R.id.wenpie3);

        context=this;
        intent2=getIntent();
        username=intent2.getStringExtra("username");
        dbOpenMessage=new DBOpenMessage(ThePieChare3.this,"db_wen2",null,1);
        getMessage1(username);

        shourutxt=(TextView)findViewById(R.id.wentext32);
        zhichutxt=(TextView)findViewById(R.id.wentext31);

        shourutxt.setText(Integer.toString(shourujine));
        zhichutxt.setText(Integer.toString(zhichujine));


        pieChart.setUsePercentValues(true);
        pieChart.setDescription("所有金额支出收入总情况");
        pieChart.setDescriptionTextSize(20);

        pieChart.setExtraOffsets(5, 5, 5, 5);

        pieChart.setDrawCenterText(true);
        pieChart.setCenterTextColor(Color.RED);
        pieChart.setCenterTextSize(15);

        pieChart.setDrawHoleEnabled(true);
        pieChart.setHoleColor(Color.WHITE);
        pieChart.setHoleRadius(40f);

        pieChart.setTransparentCircleColor(Color.BLACK);
        pieChart.setTransparentCircleAlpha(100);
        pieChart.setTransparentCircleRadius(40f);

        // enable rotation of the chart by touch
        pieChart.setRotationEnabled(true);
        pieChart.setRotationAngle(10);

        pieChart.setHighlightPerTapEnabled(true);

        Legend l = pieChart.getLegend();
        l.setPosition(Legend.LegendPosition.RIGHT_OF_CHART_CENTER);      l.setForm(Legend.LegendForm.LINE);
        l.setYEntrySpace(0f);
        l.setYOffset(0f);


        // entry label styling
        pieChart.setDrawEntryLabels(true);
        pieChart.setEntryLabelColor(Color.RED);
        pieChart.setEntryLabelTextSize(20f);

//        pieChart.setOnChartValueSelectedListener(this);
        pieChart.animateY(3400, Easing.EasingOption.EaseInQuad);
        ArrayList<PieEntry> pieEntries = new ArrayList<PieEntry>();

        pieEntries.add(new PieEntry(zhichujine, "总支出金额"));
        pieEntries.add(new PieEntry(shourujine, "总收入金额"));
        String centerText ;
        if(shourujine>zhichujine)
        {
            centerText = "整体为正资产:\n+¥" + (shourujine-zhichujine);
        }
        else if(shourujine<zhichujine)
        {
            centerText = "整体为负资产:\n-¥" + (zhichujine-shourujine);
        }
        else
        {
            centerText = "整体资产为零";
        }

        pieChart.setCenterText(centerText);
        PieDataSet pieDataSet = new PieDataSet(pieEntries, "");
        ArrayList<Integer> colors = new ArrayList<Integer>();


        colors.add(Color.rgb(205, 205, 205));
        colors.add(Color.rgb(114, 188, 223));
        pieDataSet.setColors(colors);

        pieDataSet.setSliceSpace(0f);
        pieDataSet.setSelectionShift(5f);
        PieData pieData = new PieData();
        pieData.setDataSet(pieDataSet);


        pieData.setValueFormatter(new PercentFormatter());
        pieData.setValueTextSize(20f);
        pieData.setValueTextColor(Color.YELLOW);

        pieChart.setData(pieData);
        // undo all highlights
        pieChart.highlightValues(null);
        pieChart.invalidate();
    }
    private void getMessage1(String username) {
        Cursor cursor=dbOpenMessage.getAllCostData(username);
        if(cursor!=null){
            while(cursor.moveToNext()){
                Message message2=new Message();
                message2.userkind=cursor.getString(cursor.getColumnIndex("userkind"));
                message2.usermoney=cursor.getString(cursor.getColumnIndex("usermoney"));
                message2.userchoice=cursor.getString(cursor.getColumnIndex("userchoice"));
                if(message2.userchoice.equals("支出"))
                {
                        zhichujine+=Integer.parseInt(message2.usermoney);
                }
                else if(message2.userchoice.equals("收入"))
                {
                    shourujine+=Integer.parseInt(message2.usermoney);
                }

            }
        }
    }
}
与之对应的.xml文件如下:
<?xml version="1.0" encoding="utf-8"?>
<LinearLayout xmlns:android="http://schemas.android.com/apk/res/android"
    xmlns:tools="http://schemas.android.com/tools"
    android:layout_width="match_parent"
    android:layout_height="match_parent"
    android:orientation="vertical"
    tools:context=".ThePieChare1">
    <TextView
        android:layout_width="match_parent"
        android:layout_height="wrap_content"
        android:text="支出各项占比圆饼图"
        android:layout_marginTop="10dp"
        android:textSize="30dp"
        android:textColor="@color/lanse"
        android:layout_marginBottom="20dp"
        android:gravity="center_horizontal"/>
   <LinearLayout
       android:layout_width="wrap_content"
       android:layout_height="wrap_content"
       android:layout_marginBottom="20dp">
       <TextView
           android:layout_width="wrap_content"
           android:layout_height="wrap_content"
           android:textColor="@color/colorAccent"
           android:layout_marginLeft="70dp"
           android:textSize="20dp"
           android:text="食品总支出:"/>
       <TextView
           android:id="@+id/wentext11"
           android:layout_width="wrap_content"
           android:layout_height="wrap_content"
           android:textColor="@color/colorPrimaryDark"
           android:layout_marginLeft="10dp"
           android:textSize="20dp"
           android:text=""/>
   </LinearLayout>

    <LinearLayout
        android:layout_width="wrap_content"
        android:layout_height="wrap_content"
        android:layout_marginBottom="20dp">
        <TextView
            android:layout_width="wrap_content"
            android:layout_height="wrap_content"
            android:textColor="@color/colorAccent"
            android:layout_marginLeft="70dp"
            android:textSize="20dp"
            android:text="衣物总支出:"/>
        <TextView
            android:id="@+id/wentext12"
            android:layout_width="wrap_content"
            android:layout_height="wrap_content"
            android:textColor="@color/colorPrimaryDark"
            android:layout_marginLeft="10dp"
            android:textSize="20dp"
            android:text=""/>
    </LinearLayout>

    <LinearLayout
        android:layout_width="wrap_content"
        android:layout_height="wrap_content"
        android:layout_marginBottom="20dp">
        <TextView
            android:layout_width="wrap_content"
            android:layout_height="wrap_content"
            android:textColor="@color/colorAccent"
            android:layout_marginLeft="70dp"
            android:textSize="20dp"
            android:text="出行总支出:"/>
        <TextView
            android:id="@+id/wentext13"
            android:layout_width="wrap_content"
            android:layout_height="wrap_content"
            android:textColor="@color/colorPrimaryDark"
            android:layout_marginLeft="10dp"
            android:textSize="20dp"
            android:text=""/>
    </LinearLayout>

    <LinearLayout
        android:layout_width="wrap_content"
        android:layout_height="wrap_content"
        android:layout_marginBottom="20dp">
        <TextView
            android:layout_width="wrap_content"
            android:layout_height="wrap_content"
            android:textColor="@color/colorAccent"
            android:layout_marginLeft="70dp"
            android:textSize="20dp"
            android:text="其他总支出:"/>
        <TextView
            android:id="@+id/wentext14"
            android:layout_width="wrap_content"
            android:layout_height="wrap_content"
            android:textColor="@color/colorPrimaryDark"
            android:layout_marginLeft="10dp"
            android:textSize="20dp"
            android:text=""/>
    </LinearLayout>

    <com.github.mikephil.charting.charts.PieChart
        android:id="@+id/wenpie1"
        android:layout_width="match_parent"
        android:layout_height="320dp"
        android:layout_gravity="center_vertical">
    </com.github.mikephil.charting.charts.PieChart>
</LinearLayout>
这样就完成了关于图表生成的步骤;
具体对应的实验结果如下:


点击第一个生成第一个图表:
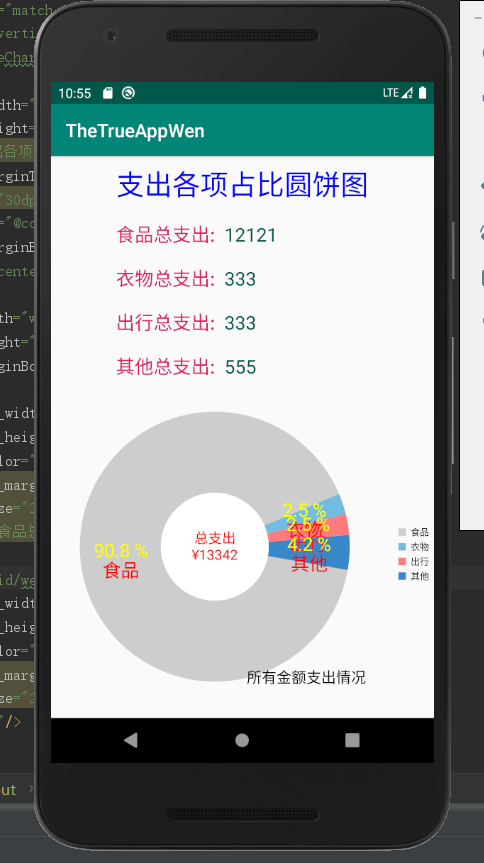
图表是动态生成的:(可以满足旋转生成)

 浙公网安备 33010602011771号