<script src="assets/js/jquery-1.8.3.min.js"></script>
<!--echart图表引入js-->
<script type="text/javascript" src="js/echarts.common.min.js"></script>
<div id="main1" style="width:45%;height:400px;margin-top: 40px;float: left;"></div>
<div id="main2" style="width:53%;height:400px;margin-top: 40px;float: right;"></div>
<script>
//<!--运营能耗分类预警-->
var myChart1 = echarts.init(document.getElementById('main1'));
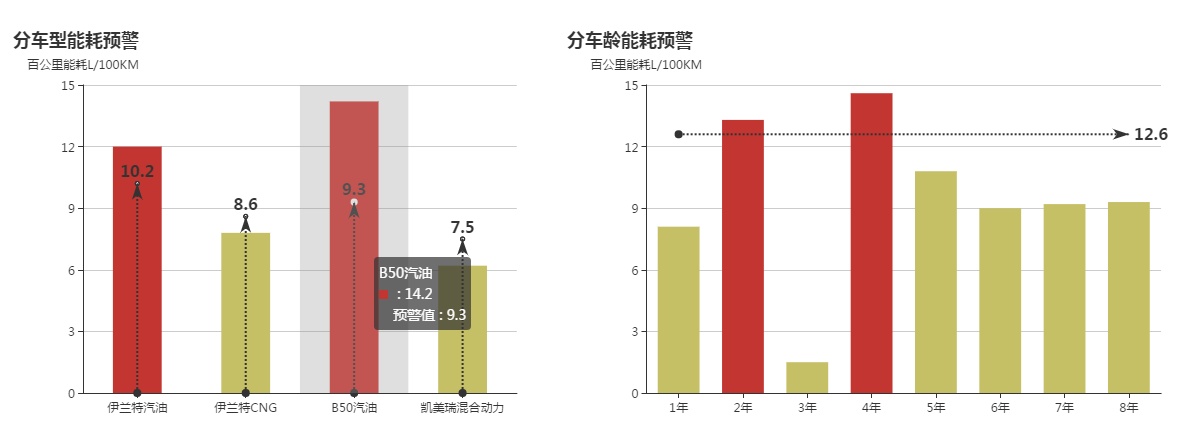
var data1=['10.2','8.6','9.3','7.5']; //预警值 数组
var seriesData = [12, 7.8, 14.2, 6.2]; //总能耗数值数组
option1 = {
title: {
text: '分车型能耗预警'
},
color: ['#e7505a'],
tooltip: {
trigger: 'axis',
axisPointer: { // 坐标轴指示器,坐标轴触发有效
type: 'shadow' // 默认为直线,可选为:'line' | 'shadow'
}
},
grid: {
right: '4%',
bottom: '3%',
containLabel: true
},
xAxis: [{
type: 'category',
data: ['伊兰特汽油', '伊兰特CNG', 'B50汽油', '凯美瑞混合动力'],
axisTick: {
alignWithLabel: true
}
}],
yAxis: [{
type: 'value',
name: '百公里能耗L/100KM',
min: 0,
max: 15,
interval: 3,
axisLabel: {
formatter: '{value}'
}
}],
series: [{
name: '',
type: 'bar',
barWidth: '45%',
data:seriesData,
markLine: {
itemStyle: {
normal: {
borderWidth: 1,
lineStyle: {
type: 'dash',
color: '#333 ',
width: 2,
},
label: {
formatter: '',
textStyle: {
fontSize: 16,
fontWeight: "bolder",
},
}
},
},
data: [
[{
coord: ['伊兰特汽油', 0]
}, {
coord: ['伊兰特汽油', 10.2]
}],
[{
coord: ['伊兰特CNG', 0]
}, {
coord: ['伊兰特CNG', 8.6]
}],
[{
coord: ['B50汽油', 0]
}, {
coord: ['B50汽油', 9.3]
}],
[{
coord: ['凯美瑞混合动力', 0]
}, {
coord: ['凯美瑞混合动力', 7.5] //平行于Y轴的 虚线
}]
],
},
},
{
name: '预警值',
type: 'line',
color:'#333',
symbol:'triangle', //起点标记图形 (三角形),详细请见 http://echarts.baidu.com/option.html#series-line.markLine.data.0.symbol
itemStyle: {
normal: {
borderWidth: 1,
lineStyle: {
type: 'dash',
color: 'transparent ',
width: 2,
},
label: {
formatter: '',
textStyle: {
color:'#333',
fontSize: 16,
fontWeight: "bolder",
},
}
},
},
data: data1.map(function (val) {
return val ;
}),
label: {
normal: {
show: true,
formatter: function (params) {
return params.value ; //预警值 对应显示 data1 预警值
}
}
}
}
],
};
//判断数值动态设置颜色
$(document).ready(function(params){
for(var i = 0 ; i < seriesData.length ; i++){
if(seriesData[i].value){
seriesData[i] = seriesData[i].value;
}
if(seriesData[0]>10.2){
seriesData[0] = {
value : seriesData[0],
itemStyle:{
normal:{
color : '#c23531'
}
}
}
}else if(seriesData[0]<=10.2){
seriesData[0] = {
value : seriesData[0],
itemStyle:{
normal:{
color : '#c5bf66'
}
}
}
}if(seriesData[1]>8.6){
seriesData[1] = {
value : seriesData[1],
itemStyle:{
normal:{
color : '#c23531'
}
}
}
}else if(seriesData[1]<=8.6){
seriesData[1] = {
value : seriesData[1],
itemStyle:{
normal:{
color : '#c5bf66'
}
}
}
}if(seriesData[2]>9.3){
seriesData[2] = {
value : seriesData[2],
itemStyle:{
normal:{
color : '#c23531'
}
}
}
}else if(seriesData[2]<=9.3){
seriesData[2] = {
value : seriesData[2],
itemStyle:{
normal:{
color : '#c5bf66'
}
}
}
}if(seriesData[3]>7.5){
seriesData[3] = {
value : seriesData[3],
itemStyle:{
normal:{
color : '#c23531'
}
}
}
}else if(seriesData[3]<=7.5){
seriesData[3] = {
value : seriesData[3],
itemStyle:{
normal:{
color : '#c5bf66'
}
}
}
}
}
// console.log(seriesData);
// option1.series[0].data=seriesData
myChart1.setOption(option1,true);
})
myChart1.setOption(option1);
var myChart2 = echarts.init(document.getElementById('main2'));
option2 = {
title: {
text: '分车龄能耗预警'
},
color: ['#F8CB00'],
tooltip: {
trigger: 'axis',
axisPointer: { // 坐标轴指示器,坐标轴触发有效
type: 'shadow' // 默认为直线,可选为:'line' | 'shadow'
}
},
grid: {
right: '4%',
bottom: '3%',
containLabel: true
},
xAxis: [{
type: 'category',
data: ['1年', '2年', '3年', '4年', '5年', '6年', '7年', '8年'],
axisTick: {
alignWithLabel: true
}
}],
yAxis: [{
type: 'value',
name: '百公里能耗L/100KM',
min: 0,
max: 15,
interval: 3,
axisLabel: {
formatter: '{value}'
}
}],
series: [{
name: '',
type: 'bar',
barWidth: '65%',
data: [8.1, 13.3, 1.5, 14.6, 10.8, 9.0, 9.2, 9.3],
markLine: { //开始标预警线
itemStyle: {
normal: {
borderWidth: 1,
lineStyle: {
type: 'dash',
color: '#333 ',
width: 2,
},
label: {
formatter: '12.6',
textStyle: {
fontSize: 16,
fontWeight: "bolder",
},
}
},
},
data: [
[{
coord: ['1年', 12.6]
}, {
coord: ['8年', 12.6]
}]
],
},
itemStyle: {
normal: {
color: function(params) { //根据预警线的值 显示对应的颜色
// build a color map as your need.
var colorList = ['#c23531', '#c5bf66 '];
if(params.data > 12.6) {
return colorList[0];
} else if(params.data < 12.6) {
return colorList[1];
}
}
},
}
}],
};
myChart2.setOption(option2);
</script>


 浙公网安备 33010602011771号