
PythonRobotics——扩展卡尔曼滤波定位(附仿真代码)
卡尔曼滤波的简单工程应用。
介绍
扩展卡尔曼滤波(Extended kalman filter,EKF)一种非线性卡尔曼滤波,用来估计均值(mean)和协方差(covariance),广泛用于非线性机器人状态估计、GPS、导航。
例子
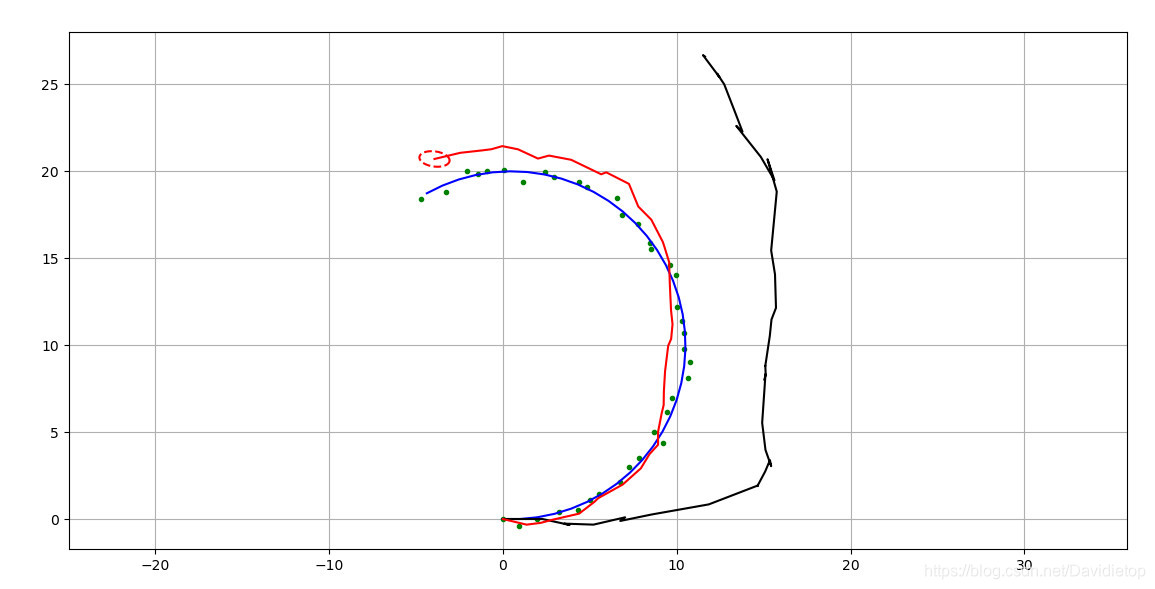
蓝色的是要求轨迹,绿色的是GPS定位轨迹,黑色的惯性导航轨迹,红色的是EKF轨迹。
编程思想
利用EKF与要求轨迹和其他算法得出的轨迹对比。
代码分析
导入
import math

import matplotlib.pyplot as plt
import numpy as np
参数设置
# Covariance for EKF simulation
Q = np.diag([
    0.1,  # variance of location on x-axis
    0.1,  # variance of location on y-axis
    np.deg2rad(1.0),  # variance of yaw angle
    1.0  # variance of velocity
]) ** 2  # predict state covariance
R = np.diag([1.0, 1.0]) ** 2  # Observation x,y position covariance

#  Simulation parameter
# noise
INPUT_NOISE = np.diag([1.0, np.deg2rad(30.0)]) ** 2
GPS_NOISE = np.diag([0.5, 0.5]) ** 2

DT = 0.1  # time tick [s]
SIM_TIME = 50.0  # simulation time [s]

show_animation = True
main()
def main():
    print(__file__ + " start!!")

    time = 0.0

    # State Vector [x y yaw v]'
    xEst = np.zeros((4, 1))
    xTrue = np.zeros((4, 1))
    PEst = np.eye(4)

    xDR = np.zeros((4, 1))  # Dead reckoning

    # history
    hxEst = xEst
    hxTrue = xTrue
    hxDR = xTrue
    hz = np.zeros((2, 1))

    while SIM_TIME >= time:
        time += DT
        u = calc_input()

        xTrue, z, xDR, ud = observation(xTrue, xDR, u)

        xEst, PEst = ekf_estimation(xEst, PEst, z, ud)

        # store data history
        hxEst = np.hstack((hxEst, xEst))
        hxDR = np.hstack((hxDR, xDR))
        hxTrue = np.hstack((hxTrue, xTrue))
        hz = np.hstack((hz, z))

        if show_animation:
            plt.cla()
            # for stopping simulation with the esc key.
            plt.gcf().canvas.mpl_connect('key_release_event',
                    lambda event: [exit(0) if event.key == 'escape' else None])
            plt.plot(hz[0, :], hz[1, :], ".g")
            plt.plot(hxTrue[0, :].flatten(),
                     hxTrue[1, :].flatten(), "-b")
            plt.plot(hxDR[0, :].flatten(),
                     hxDR[1, :].flatten(), "-k")
            plt.plot(hxEst[0, :].flatten(),
                     hxEst[1, :].flatten(), "-r")
            plot_covariance_ellipse(xEst, PEst)
            plt.axis("equal")
            plt.grid(True)
            plt.pause(0.001)
完整代码
请关注AtsushiSakai的PythonRobotics。


【推荐】国内首个AI IDE,深度理解中文开发场景,立即下载体验Trae
【推荐】编程新体验,更懂你的AI,立即体验豆包MarsCode编程助手
【推荐】抖音旗下AI助手豆包,你的智能百科全书,全免费不限次数
【推荐】轻量又高性能的 SSH 工具 IShell:AI 加持,快人一步
· 基于Microsoft.Extensions.AI核心库实现RAG应用
· Linux系列:如何用heaptrack跟踪.NET程序的非托管内存泄露
· 开发者必知的日志记录最佳实践
· SQL Server 2025 AI相关能力初探
· Linux系列:如何用 C#调用 C方法造成内存泄露
· 震惊!C++程序真的从main开始吗?99%的程序员都答错了
· 别再用vector<bool>了!Google高级工程师:这可能是STL最大的设计失误
· 单元测试从入门到精通
· 【硬核科普】Trae如何「偷看」你的代码?零基础破解AI编程运行原理
· 上周热点回顾(3.3-3.9)