Python: matplotlib绘图
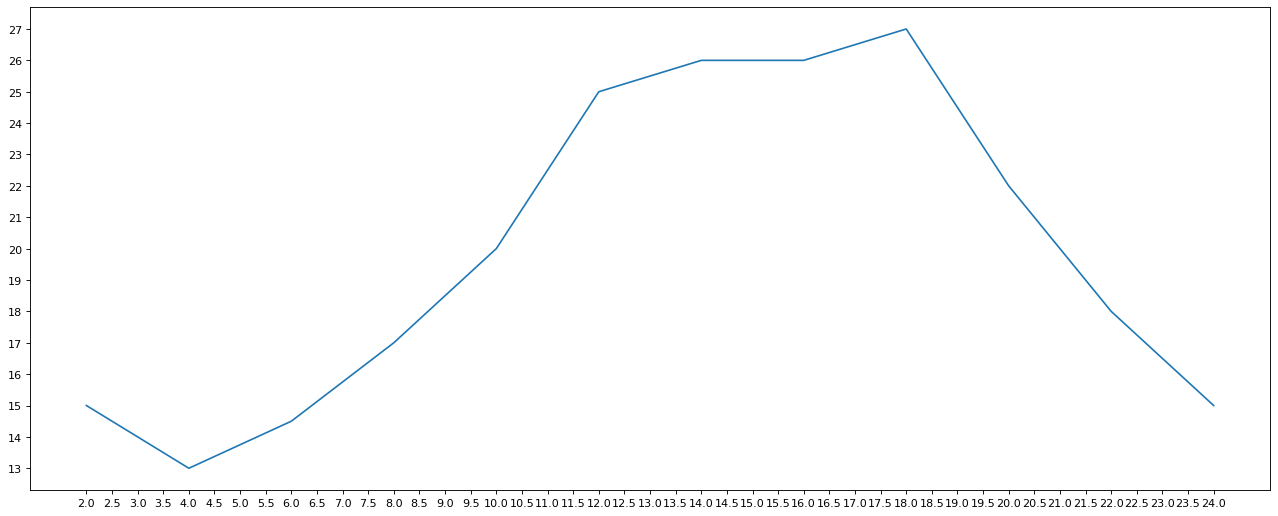
线形图 plt.plot()
from matplotlib import pyplot as plt
import numpy as np
from matplotlib import font_manager

x = range(2,26,2)
y = [15,13,14.5,17,20,25,26,26,27,22,18,15]

# 设置图片大小
plt.figure(figsize=(20,8),dpi=80)

# 绘图
plt.plot(x,y)
# # 如何绘制多条线段
# x1 = np.linspace(0,10,num=5)
# y1 = (x1 + 2) / 2
# plt.plot(x1,y1)

# 设置x,y轴的刻度
_xtick_labels = [i/2 for i in range(4,49)]
plt.xticks(_xtick_labels)
plt.yticks(range(min(y),max(y)+1))

# 保存图像
plt.savefig('./pic.png') # 可以保存为svg矢量图格式,放大不会有锯齿

# 展示图形
plt.show()
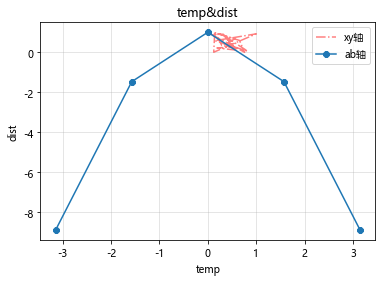
# 设置图例legend()
a = np.linspace(-np.pi,np.pi,num=5)
b = 1 - a**2
# 设置线段的样式
#ls:['solid' | 'dashed', 'dashdot', 'dotted' | (offset, on-off-dash-seq) | ``'-'`` | ``'--'`` | ``'-.'`` | ``':'`` | ``'None'`` | ``' '`` | ``''``]
plt.plot(x,y,label='xy轴',c='red',alpha=0.5,ls='dashdot')
# 设置点的样式
plt.plot(a,b,label = 'ab轴',marker='8')
plt.legend()
# 加入标识
plt.xlabel('temp')
plt.ylabel('dist')
plt.title('temp&dist')

# 解决中文显示问题
plt.rcParams['font.sans-serif'] = ['Microsoft YaHei'] # 指定默认字体
plt.rcParams['axes.unicode_minus'] = False # 解决保存图像是负号'-'显示为方块的问题

# 绘制网格
plt.grid(alpha=0.4)

plt.show()
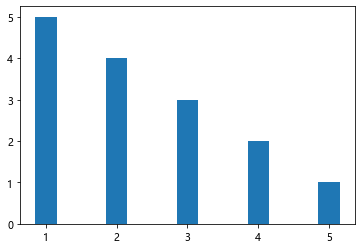
柱形图 plt.bar() plt.barh()
x = [1,2,3,4,5]
y = [5,4,3,2,1] # 柱子的高度
plt.bar(x,y,width=0.3) # width控制柱子的宽度
plt.barh(x,y)

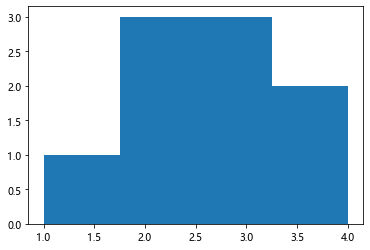
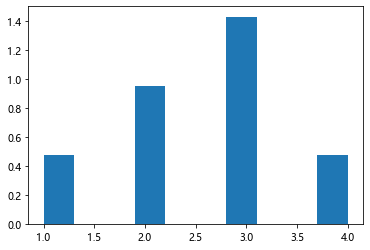
直方图 plt.hist()
x = [1,2,2,2,3,3,3,4,4]
plt.hist(x,bins=4)
x = [1,2,2,3,3,3,4]
plt.hist(x,bins=10,density=True)
饼图 plt.pie()
arr = [11,22,31,15]
plt.pie(arr, labels=['a','b','c','d'])

plt.pie(arr,labels=['a','b','c','d'],labeldistance=0.3,autopct='%.6f%%')

plt.pie(arr,labels=['a','b','c','d'],labeldistance=0.3,shadow=True,explode=[0.2,0.3, 0.2,0.4])

arr = [0.2, 0.3, 0.1]
plt.pie(arr)

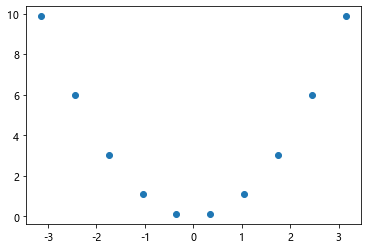
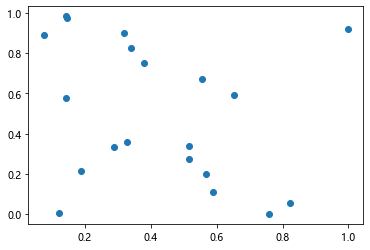
散点图 plt.scatter()
x = np.linspace(-np.pi, np.pi,10)
y = x ** 2
plt.scatter(x,y)
x = np.random.random(size=(20,))
y = np.random.random(size=(20,))
plt.scatter(x,y)
参考:

 浙公网安备 33010602011771号