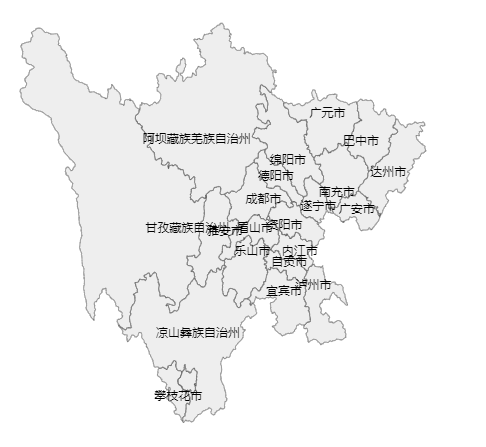
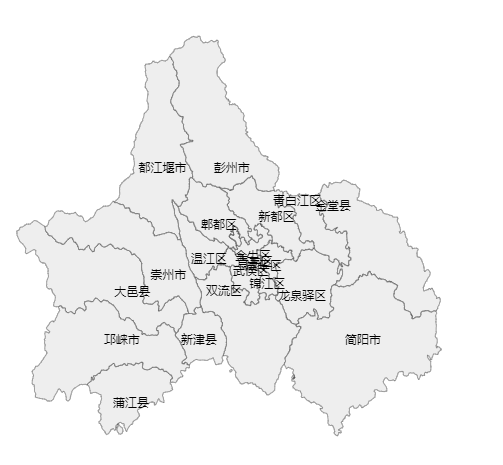
【Python】【Chart】图标绘制/地图生成
官网(JS):https://echarts.apache.org/zh/index.html
官网(Python):https://pyecharts.org/#/zh-cn/geography_charts?id=map%ef%bc%9a%e5%9c%b0%e5%9b%be
在Vue中使用echarts:https://www.jianshu.com/p/cf0a54374419
#!/usr/bin/env python
# -*- coding: utf-8 -*-

"""
@Time    :
@Author  :
@File    :
@Version :1.0
@Function:

官方文档:https://pyecharts.org/#/zh-cn/geography_charts?id=map%ef%bc%9a%e5%9c%b0%e5%9b%be

"""
from pyecharts.charts import Map

"""
说明:要生成哪里的地图(如:成都、四川) 填的值 可参考pyecharts.datasets.map_filenames.json文件
"""
# 生成一个成都的地图
cd = (
    Map()
        .add(None, [[None, None]], '成都')
        .render('cd.html')
)
# 生成一个四川的地图
sc = (
    Map()
        .add(None, [[None, None]], '四川')
        .render('sc.html')
)


如果忍耐算是坚强 我选择抵抗 如果妥协算是努力 我选择争取


【推荐】国内首个AI IDE,深度理解中文开发场景,立即下载体验Trae
【推荐】编程新体验,更懂你的AI,立即体验豆包MarsCode编程助手
【推荐】抖音旗下AI助手豆包,你的智能百科全书,全免费不限次数
【推荐】轻量又高性能的 SSH 工具 IShell:AI 加持,快人一步
· .NET Core 中如何实现缓存的预热?
· 从 HTTP 原因短语缺失研究 HTTP/2 和 HTTP/3 的设计差异
· AI与.NET技术实操系列:向量存储与相似性搜索在 .NET 中的实现
· 基于Microsoft.Extensions.AI核心库实现RAG应用
· Linux系列:如何用heaptrack跟踪.NET程序的非托管内存泄露
· TypeScript + Deepseek 打造卜卦网站:技术与玄学的结合
· 阿里巴巴 QwQ-32B真的超越了 DeepSeek R-1吗?
· 【译】Visual Studio 中新的强大生产力特性
· 【设计模式】告别冗长if-else语句:使用策略模式优化代码结构
· 10年+ .NET Coder 心语 ── 封装的思维:从隐藏、稳定开始理解其本质意义