决策树(一):决策树的构造和显示
一,信息熵
当谈到决策树的构建时,一定会想到信息熵,那么究竟什么是信息熵呢?根据百度百科描述:熵(shāng),热力学中表征物质状态的参量之一,用符号S表示,其物理意义是体系混乱程度的度量。信息熵:信息熵(information entropy)是信息论的基本概念。描述信息源各可能事件发生的不确定性。20世纪40年代,香农(C.E.Shannon)借鉴了热力学的概念,把信息中排除了冗余后的平均信息量称为“信息熵”,并给出了计算信息熵的数学表达式。信息熵的提出解决了对信息的量化度量问题。
总结就是信息熵是为了度量信息的一个工具。
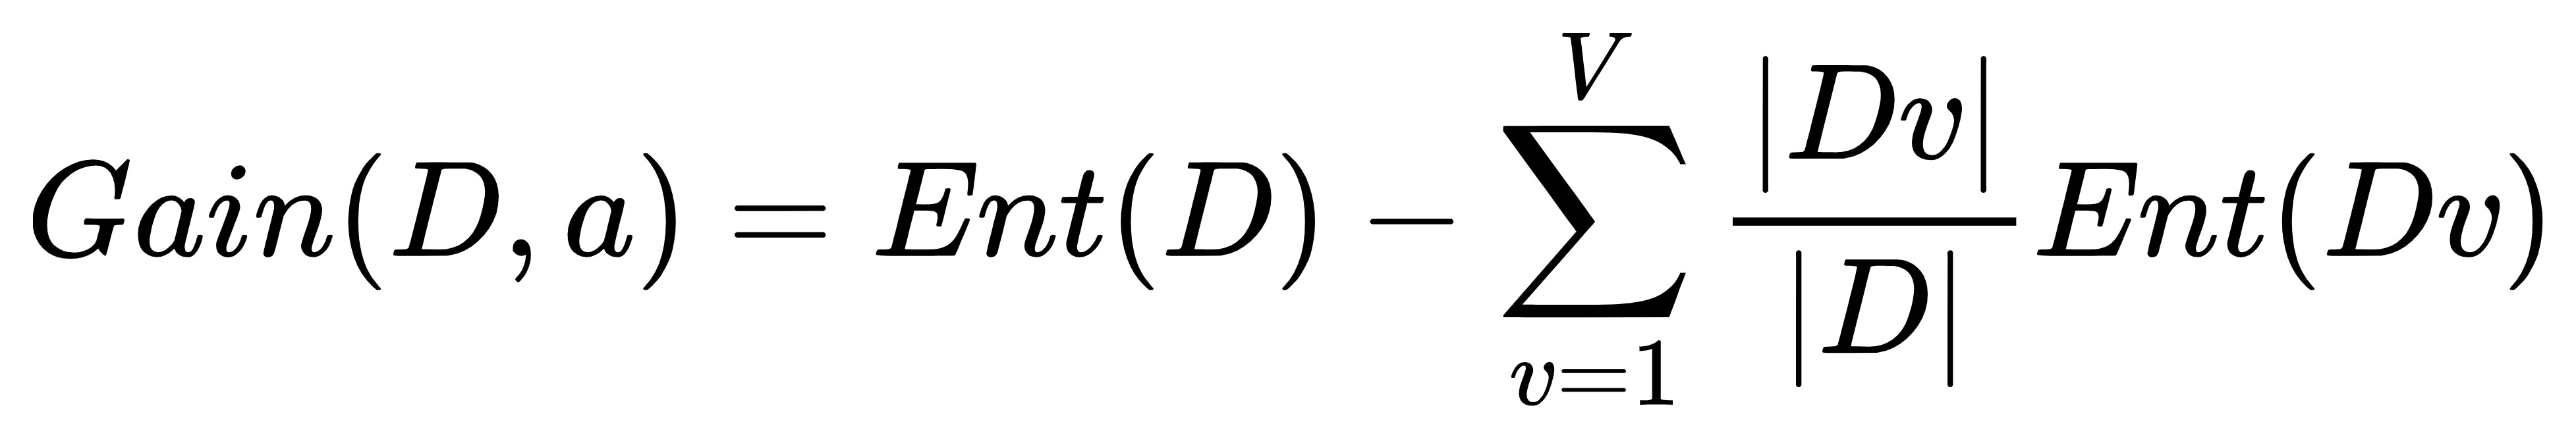
熵的计算公式:

但是为了方便使用,我们引出了信息增益的概念:在概率论和信息论中,信息增益是非对称的,用以度量两种概率分布P和Q的差异。信息增益描述了当使用Q进行编码时,再使用P进行编码的差异。通常P代表样本或观察值的分布,也有可能是精确计算的理论分布。Q代表一种理论,模型,描述或者对P的近似。
信息增益公式:
二,数据集
本次实验中,我选择了Titanic数据集
1.titanic(泰坦尼克号)数据集的简介
泰坦尼克号沉船事故。1912年,当时隶属于英国的世界级豪华客轮泰坦尼克号,因在处女航行中不幸撞上北大西洋冰山而沉没。这场事故使得1500多名乘客罹难。后来,这场震惊世界的惨剧被详细地调查,而且遇难乘客的信息也逐渐被披露。在当时的救援条件下,无法在短时间内确认每位乘客生还的可能性。而今,许多科学家试图通过计算机模拟和分析找出潜藏在数据背后的生还逻辑,通过人工智能算法,尝试揭开这尘封了 100多年的数据的面纱。
此次沉船事件如此严重,主要是因为当时没有足够的救生艇。有些人被获救,除了有运气因素之外,还有一些其他的因素值得分析,比如妇女、儿童、上层阶级等角色人员更可能会被获救。而titanic数据集记录了当时的状况,它被用来实现分类任务,是否获救二分类预测,预测泰坦尼克号上人员的是否获救状况。
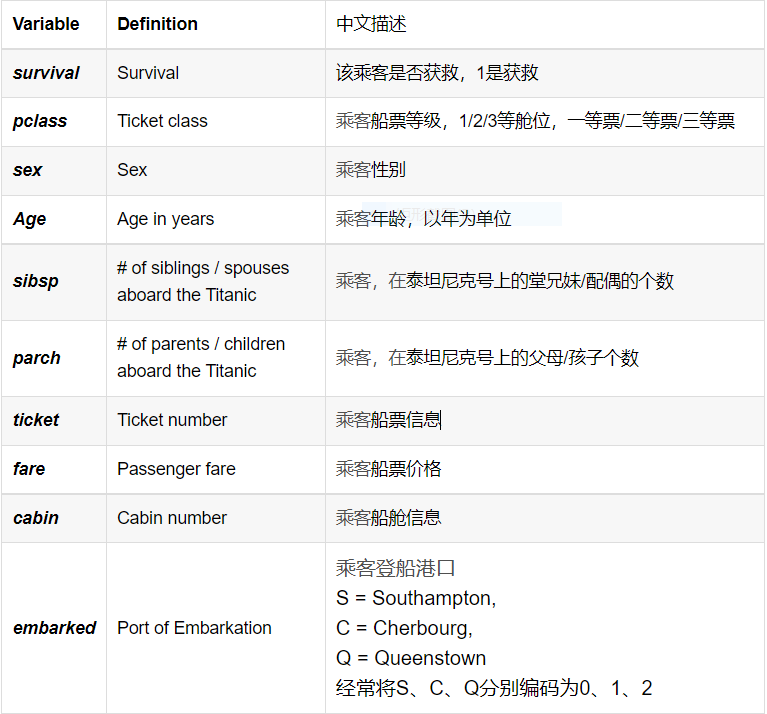
2.titanic数据集各字段描述及简介
三,代码实现
1.数据处理
def process(data):
    #数据处理
    data.drop("Embarked(登船港口)",inplace=True,axis=1)
    test.drop("Embarked",inplace=True,axis=1)
    x=data[["Pclass(乘客等级)","Sex","SibSp(堂兄弟姐妹个数)","Parch(父母与小孩的个数)","Fare(票价)"]]
    y=data["Survived"]
    x["SibSp(堂兄弟姐妹个数)"].fillna(x["SibSp(堂兄弟姐妹个数)"].mean,inplace=True)#将缺省的用平均值填充
    x["Parch(父母与小孩的个数)"].fillna(x["Parch(父母与小孩的个数)"].mean,inplace=True)
    #将大于平均值的设为1
    x["Fare(票价)"]=[1 if i>np.array(x["Fare(票价)"]).mean() else 0 for i in x["Fare(票价)"] ]
    #将sex转为1和0
    x["Sex"]=pd.factorize(x["Sex"])[0].astype(np.uint16)
    return x,y
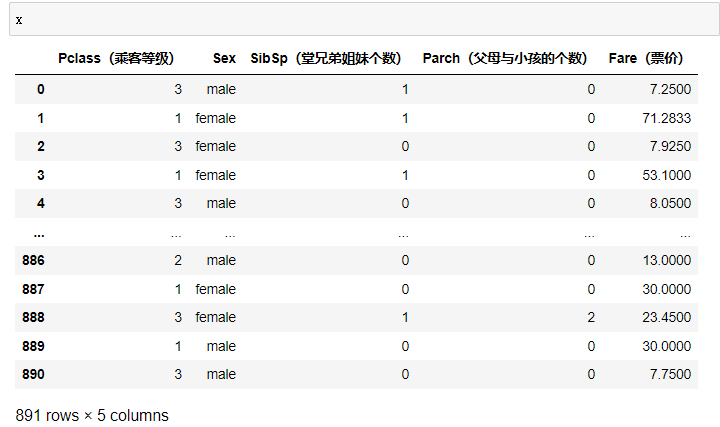
处理前
处理后
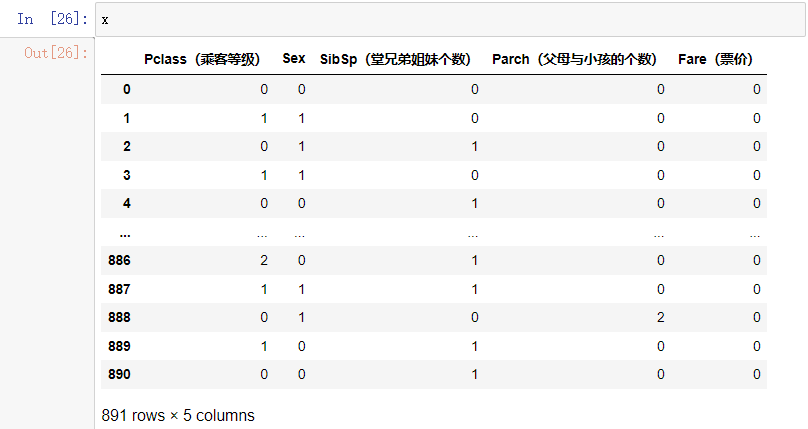
可见将x中字母部分转为数字,缺省部分用平均值填充
2.计算信息增益
#计算信息熵
def entropy(data):
    total_len=len(data)
    len_1=np.where(data==1)[0].shape[0]
    len_0=len(data)-len_1
    # 出现问题:部分数据会返回nan
    # 探索原因:当概率很小时,取对数后结果趋于负无穷大。
    # 解决方法:改变浮点数的精度为1e - 5
    p1=len_1/total_len+1e-5
    p0=len_0/total_len+1e-5
    entro=-np.sum([p0*np.log2(p0),p1*np.log2(p1)])
    return entro


#计算信息增益
def gain(total_entropy,x,y):
    gain=[]
    total_data=len(y)
    #将特征转为数字
    for f in x:
        x[f] = pd.factorize(x[f])[0].astype(np.uint16)
    #计算每一个的gain
    for feature in x:
        # print("\n",feature)
        part_entropy = []
        for kind in range(max(x[feature])+1):
            # print("kind:",kind)
            x_index=np.where(x[feature]==kind)[0]
            kind_y=y[x_index]
            len_kind=len(kind_y)
            # print("len_kind:",len_kind)
            # print("获救人数:",len(np.where(kind_y==1)[0]))
            part_entropy.append((len_kind/total_data)*entropy(kind_y))
        gain.append(total_entropy-np.sum(part_entropy))
    return gain
此处在计算信息增益的时候出现问题,就是部分数据返回nan,经探究,得知当概率很小时,取对为0,而0不能被除,所以就会出错。也很好解决,改变浮点数精度为1e-5就可以解决
输出结果如下

3.创建决策树
class TreeNode(object):
    def __init__(self,name,parent=None):
        self.name=name
        self.parent=parent
        self.children={}
    #重写,返回节点名称
    def __repr__(self):
        return "TreeNode(%s)"%self.name


    def add_child(self,child,idx):
        self.children[idx]=child

    def print_tree(self,root:"TreeNode",leval=0):
        print("第", leval, "层\n")

        if root.parent==None:
            print(root)
        if root.children:
            # print(root.name,":",end="")
            print(root.children.values())
            #将每一层的节点全部输出
            #深度优先遍历
            for child in root.children.values():
                self.print_tree(child,leval+1)
            print("\n")

def create_tree(gain,x):
    num_children = np.max(x, axis=0)  # 孩子数量
    #深度优先建树
    def dfs(node,map,leval=1):
        #leval=0为根节点
        if leval<len(map):
            #获取当前
            cur_name=map[leval]
            node_children=num_children[node.name]+1
            cur_node = TreeNode(cur_name, node)
            for i in range(node_children):
                dfs(cur_node,map,leval+1)
                node.add_child(cur_node, i)

        else:
            return
    features_name=[name for name in x] #['Pclass(乘客等级)', 'Sex', 'SibSp(堂兄弟姐妹个数)', 'Parch(父母与小孩的个数)', 'Fare(票价)']
    #逆序
    features_index=gain.argsort()[::-1] #[1,0,4,2,3]
    features_map={}
    #将信息增益与对应的排名组成字典
    for key,value in zip(features_index,features_name):
        features_map[key]=value
    root=TreeNode(features_map[0])
    dfs(root, features_map)
    return root
dfs构建树,将信息增益越高,节点越靠近根节点。
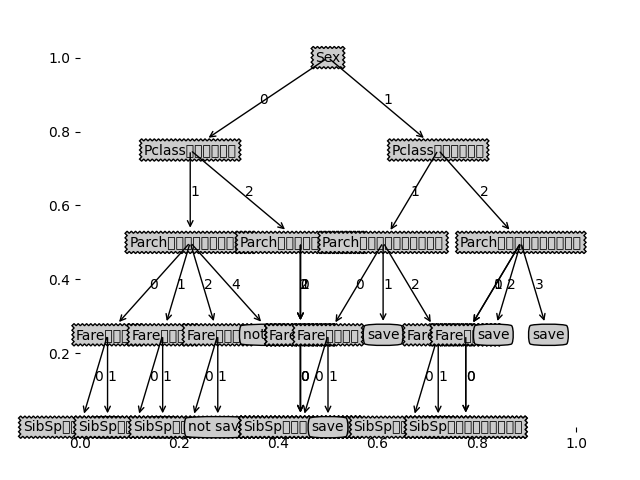
4.画图
先上结果图
在这一模块中,首先需要把tree转成字典格式
    #获得tree的字典
    def print_tree_dict(self,root,data=None):

        def split_data(data,feature,value):
            inx=data[feature]==value
            return data[inx]
        #如果不是TreeNode类型,其实就是“empty”,就停止向下延伸
        if not isinstance(root,TreeNode):
            return
        #如果没有数据,标记为empty
        if data.empty:
            return "empty"
        # # 类别完全相同,停止划分
        if len(data[data["Survived"]==0])==len(data["Survived"]):
            #如果data["Survived"]全为0
            return "not save"
        elif len(data[data["Survived"]==1])==len(data["Survived"]):
            # 如果data["Survived"]全为1
            return "save"
        tree = {root.name: {}}
        for  key in root.children:
            #如果下个节点为empty,就不生成新的节点
            if self.print_tree_dict(root.children[key],data=split_data(data,root.name,key))=="empty":
                continue
            #递归,类似于dfs
            tree[root.name][key]=self.print_tree_dict(root.children[key],data=split_data(data,root.name,key))
        return tree
结果如下:
{'Sex': {0: {'Pclass(乘客等级)': {1: {'Parch(父母与小孩的个数)': {0: {'Fare(票价)': {0: {'SibSp(堂兄弟姐妹个数)': {}}, 1: 'save'}}, 1: {'Fare(票价)': {0: {'SibSp(堂兄弟姐妹个数)': {}}, 1: 'save'}}, 2: {'Fare(票价)': {0: {'SibSp(堂兄弟姐妹个数)': {}}, 1: 'not save'}}, 4: 'not save'}}, 2: {'Parch(父母与小孩的个数)': {0: {'Fare(票价)': {0: {'SibSp(堂兄弟姐妹个数)': {}}}}, 1: {'Fare(票价)': {0: {'SibSp(堂兄弟姐妹个数)': {}}}}, 2: {'Fare(票价)': {0: {'SibSp(堂兄弟姐妹个数)': {}}}}}}}}, 1: {'Pclass(乘客等级)': {1: {'Parch(父母与小孩的个数)': {0: {'Fare(票价)': {0: {'SibSp(堂兄弟姐妹个数)': {}}, 1: 'save'}}, 1: 'save', 2: {'Fare(票价)': {0: {'SibSp(堂兄弟姐妹个数)': {}}, 1: 'save'}}}}, 2: {'Parch(父母与小孩的个数)': {0: {'Fare(票价)': {0: {'SibSp(堂兄弟姐妹个数)': {}}}}, 1: {'Fare(票价)': {0: {'SibSp(堂兄弟姐妹个数)': {}}}}, 2: 'save', 3: 'save'}}}}}}
再借用plt
# 定义文本框和箭头格式
decisionNode = dict(boxstyle="sawtooth", fc="0.8")
leafNode = dict(boxstyle="round4", fc="0.8")
arrow_args = dict(arrowstyle="<-")


## 绘制带箭头的注解##############
def plotNode(nodeTxt, centerPt, parentPt, nodeType):
    createPlot.ax1.annotate(nodeTxt, xy=parentPt, xycoords='axes fraction',
                            xytext=centerPt, textcoords='axes fraction',
                            va="center", ha="center", bbox=nodeType, arrowprops=arrow_args)


## PLOTTREE#################################
## 在父子节点间填充文本信息
def plotMidText(cntrPt, parentPt, txtString):
    xMid = (parentPt[0] - cntrPt[0]) / 2.0 + cntrPt[0]
    yMid = (parentPt[1] - cntrPt[1]) / 2.0 + cntrPt[1]
    createPlot.ax1.text(xMid, yMid, txtString)

## 获取叶节点的数目和树的层数#######################
def getNumLeafs(myTree):
    numLeafs = 0
    firstStr = list(myTree.keys())[0]#找到输入的第一个元素
    secondDict = myTree[firstStr]
    for key in secondDict.keys():
        if type(secondDict[key]).__name__ == 'dict':
            numLeafs += getNumLeafs(secondDict[key])
        else:
            numLeafs += 1
    return numLeafs


def getTreeDepth(myTree):
    maxDepth = 0
    firstStr = list(myTree.keys())[0]
    secondDict = myTree[firstStr]
    for key in secondDict.keys():
        if type(secondDict[key]).__name__ == 'dict':
            thisDepth = 1 + getTreeDepth(secondDict[key])
        else:
            thisDepth = 1
        if thisDepth > maxDepth:
            maxDepth = thisDepth
    return maxDepth

def plotTree(myTree, parentPt, nodeTxt):
    # 计算宽与高
    numLeafs = getNumLeafs(myTree)
    depth = getTreeDepth(myTree)
    firstStr = list(myTree.keys())[0]
    cntrPt = (plotTree.xOff + (1.0 + float(numLeafs)) / 2.0 / plotTree.totalW, plotTree.yOff)
    # 标记子节点属性
    plotMidText(cntrPt, parentPt, nodeTxt)
    plotNode(firstStr, cntrPt, parentPt, decisionNode)
    secondDict = myTree[firstStr]
    # 减少y偏移
    plotTree.yOff = plotTree.yOff - 1.0 / plotTree.totalD
    for key in secondDict.keys():
        if type(secondDict[key]) == dict:
            plotTree(secondDict[key], cntrPt, str(key))
        else:
            plotTree.xOff = plotTree.xOff + 1.0 / plotTree.totalW
            plotNode(secondDict[key], (plotTree.xOff, plotTree.yOff), cntrPt, leafNode)
            plotMidText((plotTree.xOff, plotTree.yOff), cntrPt, str(key))
    plotTree.yOff = plotTree.yOff + 1.0 / plotTree.totalD


def createPlot(inTree):
    fig = plt.figure(1, facecolor='white')
    fig.clf()
    axprops = dict(xticks=[], yticks=[])
    createPlot.ax1 = plt.subplot(111, frameon=False)  # no ticks
    plotTree.totalW = float(getNumLeafs(inTree))
    plotTree.totalD = float(getTreeDepth(inTree))
    plotTree.xOff = -0.5 / plotTree.totalW
    plotTree.yOff = 1.0
    plotTree(inTree, (0.5, 1.0), '')
    plt.show()
总结:
在此次任务中,通过信息增益来排序,获得了从上到下节点。代入数据,一层一层的构建出决策树,如果数据为空,或者全部为0或1则标记为叶子节点
难点在于如何如何画出图像。
不足之处在于没有限制树的深度,每一节点的数据量是否大于一定的阈值,减少过拟合的风险等,后期可对此进行改进
全部代码:
from sklearn.model_selection import train_test_split
import numpy as np
import pandas as pd
from graphviz import Digraph
import matplotlib.pyplot as plt

def process(data):
    #数据处理
    data.drop("Embarked(登船港口)",inplace=True,axis=1)
    x=data[["Pclass(乘客等级)","Sex","SibSp(堂兄弟姐妹个数)","Parch(父母与小孩的个数)","Fare(票价)"]]
    y=data["Survived"]
    x["SibSp(堂兄弟姐妹个数)"].fillna(x["SibSp(堂兄弟姐妹个数)"].mean,inplace=True)#将缺省的用平均值填充
    x["Parch(父母与小孩的个数)"].fillna(x["Parch(父母与小孩的个数)"].mean,inplace=True)
    #将大于平均值的设为1
    x["Fare(票价)"]=[1 if i>np.array(x["Fare(票价)"]).mean() else 0 for i in x["Fare(票价)"] ]
    #将sex转为1和0
    x["Sex"]=pd.factorize(x["Sex"])[0].astype(np.uint16)
    return x,y
def process_data(data):
    data=data[["Pclass(乘客等级)", "Sex", "SibSp(堂兄弟姐妹个数)", "Parch(父母与小孩的个数)", "Fare(票价)","Survived"]]
    data["Fare(票价)"] = [1 if i > np.max(data["Fare(票价)"] / 2) else 0 for i in data["Fare(票价)"]]
    data["Sex"] = pd.factorize(data["Sex"])[0].astype(np.uint16)
    data["SibSp(堂兄弟姐妹个数)"].fillna(data["SibSp(堂兄弟姐妹个数)"].mean,inplace=True)#将缺省的用平均值填充
    data["Parch(父母与小孩的个数)"].fillna(data["Parch(父母与小孩的个数)"].mean,inplace=True)
    return data


#计算信息熵
def entropy(data):
    total_len=len(data)
    len_1=np.where(data==1)[0].shape[0]
    len_0=len(data)-len_1
    # 出现问题:部分数据会返回nan
    # 探索原因:当概率很小时,取对数后结果趋于负无穷大。
    # 解决方法:改变浮点数的精度为1e - 5
    p1=len_1/total_len+1e-5
    p0=len_0/total_len+1e-5
    entro=-np.sum([p0*np.log2(p0),p1*np.log2(p1)])
    return entro


#计算信息增益
def gain(total_entropy,x,y):
    gain=[]
    total_data=len(y)
    #将特征转为数字
    for f in x:
        x[f] = pd.factorize(x[f])[0].astype(np.uint16)
    #计算每一个的gain
    for feature in x:
        # print("\n",feature)
        part_entropy = []
        for kind in range(max(x[feature])+1):
            # print("kind:",kind)
            x_index=np.where(x[feature]==kind)[0]
            kind_y=y[x_index]
            len_kind=len(kind_y)
            # print("len_kind:",len_kind)
            # print("获救人数:",len(np.where(kind_y==1)[0]))
            part_entropy.append((len_kind/total_data)*entropy(kind_y))
        # print(total_entropy-np.sum(part_entropy))
        gain.append(total_entropy-np.sum(part_entropy))

    return gain


class TreeNode(object):
    def __init__(self,name,parent=None):
        self.name=name
        self.parent=parent
        self.children={}
    #重写,返回节点名称
    def __repr__(self):
        return "TreeNode(%s)"%self.name


    def add_child(self,child,idx):
        self.children[idx]=child

    def print_tree(self,root:"TreeNode",leval=0):
        print("第", leval, "层\n")

        if root.parent==None:
            print(root)
        if root.children:
            # print(root.name,":",end="")
            print(root.children.values())
            #将每一层的节点全部输出
            #深度优先遍历
            for child in root.children.values():
                self.print_tree(child,leval+1)
            print("\n")
    #获得tree的字典
    def print_tree_dict(self,root,data=None):

        def split_data(data,feature,value):
            inx=data[feature]==value
            return data[inx]
        #如果不是TreeNode类型,其实就是“empty”,就停止向下延伸
        if not isinstance(root,TreeNode):
            return
        #如果没有数据,标记为empty
        if data.empty:
            return "empty"
        # # 类别完全相同,停止划分
        if len(data[data["Survived"]==0])==len(data["Survived"]):
            #如果data["Survived"]全为0
            return "not save"
        elif len(data[data["Survived"]==1])==len(data["Survived"]):
            # 如果data["Survived"]全为1
            return "save"
        tree = {root.name: {}}
        for  key in root.children:
            #如果下个节点为empty,就不生成新的节点
            if self.print_tree_dict(root.children[key],data=split_data(data,root.name,key))=="empty":
                continue
            #递归,类似于dfs
            tree[root.name][key]=self.print_tree_dict(root.children[key],data=split_data(data,root.name,key))
        return tree


def create_tree(gain,x):
    num_children = np.max(x, axis=0)  # 孩子数量
    #深度优先建树
    def dfs(node,map,leval=1):
        #leval=0为根节点
        if leval<len(map):
            #获取当前
            cur_name=map[leval]
            node_children=num_children[node.name]+1
            cur_node = TreeNode(cur_name, node)
            for i in range(node_children):
                dfs(cur_node,map,leval+1)
                node.add_child(cur_node, i)
        else:
            return
    features_name=[name for name in x] #['Pclass(乘客等级)', 'Sex', 'SibSp(堂兄弟姐妹个数)', 'Parch(父母与小孩的个数)', 'Fare(票价)']
    #逆序
    features_index=gain.argsort()[::-1] #[1,0,4,2,3]
    features_map={}
    #将信息增益与对应的排名组成字典
    for key,value in zip(features_index,features_name):
        features_map[key]=value
    root=TreeNode(features_map[0])
    dfs(root, features_map)
    return root

class DecisionTree(object):
    def __init__(self,gain,x,y,max_depth=None,num_threshold=None):
        self.tree={}

        self.prior_probability=len(np.where(y==1)[0])/len(y)
        self.max_depth=max_depth
        self.num_threshold=num_threshold
        self.depth=0
        # self.gain=np.array(gain.sort(reverse=True))
        self.gain=np.array(gain)
        self.x=x
        self.y=y
        self.num_children=np.max(x,axis=0) #孩子数量


# 定义文本框和箭头格式
decisionNode = dict(boxstyle="sawtooth", fc="0.8")
leafNode = dict(boxstyle="round4", fc="0.8")
arrow_args = dict(arrowstyle="<-")


## 绘制带箭头的注解##############
def plotNode(nodeTxt, centerPt, parentPt, nodeType):
    createPlot.ax1.annotate(nodeTxt, xy=parentPt, xycoords='axes fraction',
                            xytext=centerPt, textcoords='axes fraction',
                            va="center", ha="center", bbox=nodeType, arrowprops=arrow_args)


## PLOTTREE#################################
## 在父子节点间填充文本信息
def plotMidText(cntrPt, parentPt, txtString):
    xMid = (parentPt[0] - cntrPt[0]) / 2.0 + cntrPt[0]
    yMid = (parentPt[1] - cntrPt[1]) / 2.0 + cntrPt[1]
    createPlot.ax1.text(xMid, yMid, txtString)

## 获取叶节点的数目和树的层数#######################
def getNumLeafs(myTree):
    numLeafs = 0
    firstStr = list(myTree.keys())[0]#找到输入的第一个元素
    secondDict = myTree[firstStr]
    for key in secondDict.keys():
        if type(secondDict[key]).__name__ == 'dict':
            numLeafs += getNumLeafs(secondDict[key])
        else:
            numLeafs += 1
    return numLeafs


def getTreeDepth(myTree):
    maxDepth = 0
    firstStr = list(myTree.keys())[0]
    secondDict = myTree[firstStr]
    for key in secondDict.keys():
        if type(secondDict[key]).__name__ == 'dict':
            thisDepth = 1 + getTreeDepth(secondDict[key])
        else:
            thisDepth = 1
        if thisDepth > maxDepth:
            maxDepth = thisDepth
    return maxDepth

def plotTree(myTree, parentPt, nodeTxt):
    # 计算宽与高
    numLeafs = getNumLeafs(myTree)
    depth = getTreeDepth(myTree)
    firstStr = list(myTree.keys())[0]
    cntrPt = (plotTree.xOff + (1.0 + float(numLeafs)) / 2.0 / plotTree.totalW, plotTree.yOff)
    # 标记子节点属性
    plotMidText(cntrPt, parentPt, nodeTxt)
    plotNode(firstStr, cntrPt, parentPt, decisionNode)
    secondDict = myTree[firstStr]
    # 减少y偏移
    plotTree.yOff = plotTree.yOff - 1.0 / plotTree.totalD
    for key in secondDict.keys():
        if type(secondDict[key]) == dict:
            plotTree(secondDict[key], cntrPt, str(key))
        else:
            plotTree.xOff = plotTree.xOff + 1.0 / plotTree.totalW
            plotNode(secondDict[key], (plotTree.xOff, plotTree.yOff), cntrPt, leafNode)
            plotMidText((plotTree.xOff, plotTree.yOff), cntrPt, str(key))
    plotTree.yOff = plotTree.yOff + 1.0 / plotTree.totalD


def createPlot(inTree):
    fig = plt.figure(1, facecolor='white')
    fig.clf()
    axprops = dict(xticks=[], yticks=[])
    createPlot.ax1 = plt.subplot(111, frameon=False)  # no ticks
    plotTree.totalW = float(getNumLeafs(inTree))
    plotTree.totalD = float(getTreeDepth(inTree))
    plotTree.xOff = -0.5 / plotTree.totalW
    plotTree.yOff = 1.0
    plotTree(inTree, (0.5, 1.0), '')
    plt.show()


if __name__=="__main__":
    train_file = "D:/DataSet/titanic/titanic_train.csv"
    test_file = "D:/DataSet/titanic/titanic_test.csv"
    # 数据读取
    data = pd.read_csv(train_file)
    test = pd.read_csv(test_file)
    x,y=process(data)
    data=process_data(data)
    gain=gain(entropy(np.array(y)), x, y)
    tree=create_tree(np.array(gain),x)
    tree=tree.print_tree_dict(tree,data)
    print(tree)
    createPlot(tree)
数据集:
链接:https://pan.baidu.com/s/1j0XIWy0xOtBRswHFNWNmrA
提取码:om57

 浙公网安备 33010602011771号