
花了两天部署了一套监控服务 prometheus+node-exporter+grafana,公司的gitlab服务器准备部署node-exporter的时候突然发现gitlab已经有了这些服务,
也懒得去研究gitlab为啥要这些服务,既然gitlab服务器已经包含了node-exporter服务,我直接使用不就得了。
1.首先浏览器测试下接口并不能使用:http://ip:9100/metrics;
2.既然浏览器不能使用,那去gitlab服务器测试下:curl 127.0.0.1:9100/metrics -s | head

发现 node-exporter 服务正常
3.node-exporter服务正常,那基本是网络问题了,继续排除下:
netstat -anp | grep node
ps -ef | grep node
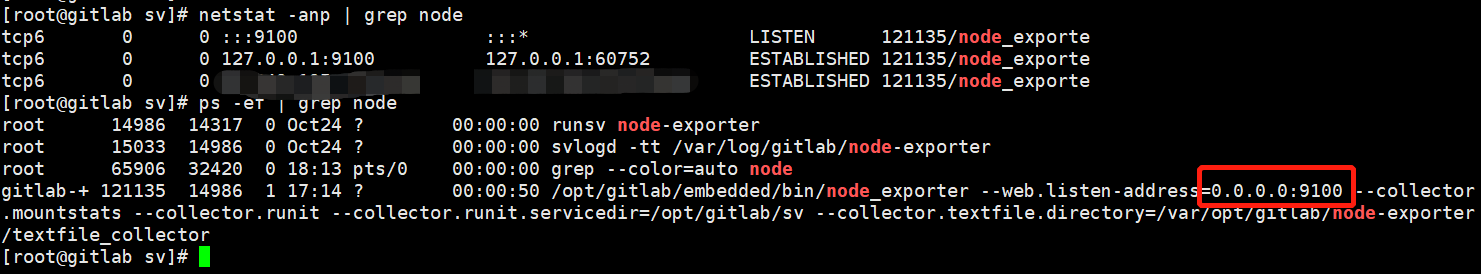
发现 node-exporter 监听的是 localhost:9100 导致只能本地访问(红框是我改后的),那就修改监听地址吧
4.查看下监听地址是在哪里修改的,在gitlab目录下 :grep :9100 * -r
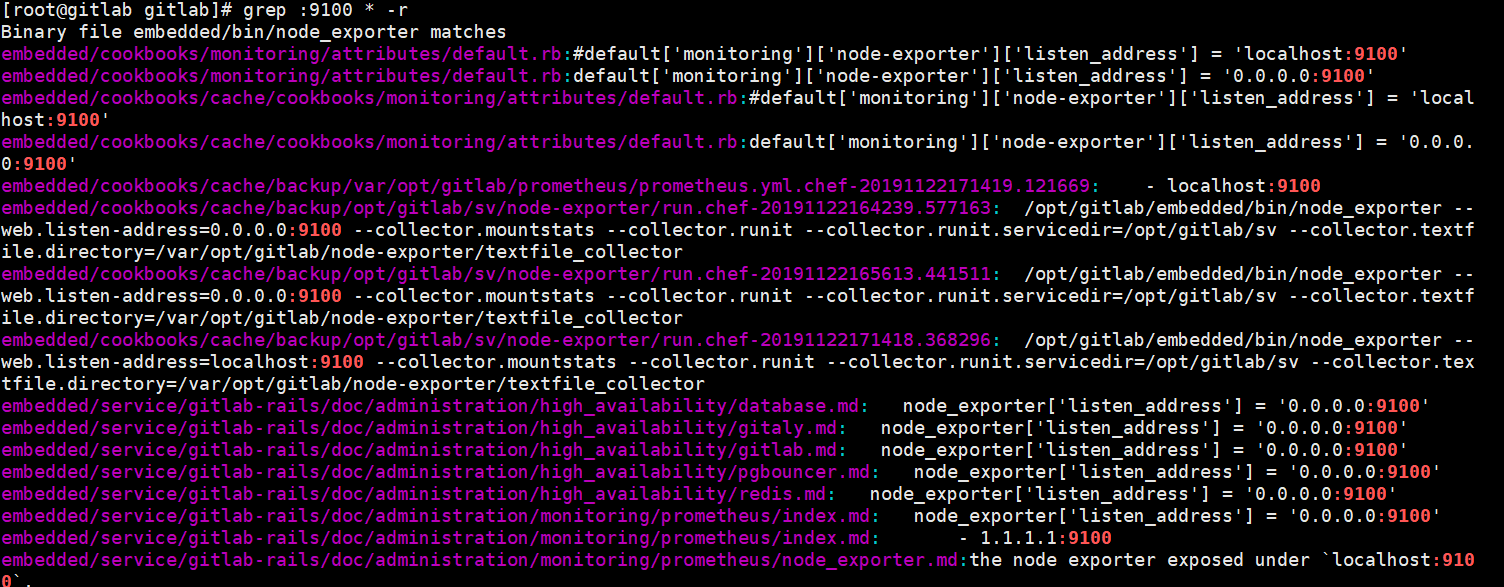
发现好多地方有这个值(0.0.0.0:9100这个是已经修改后的,修改前看到的是localhost:9100),经过简单的排除再尝试,确认可以直接在缺省配置文件里面配置 :embedded/cookbooks/monitoring/attributes/default.rb
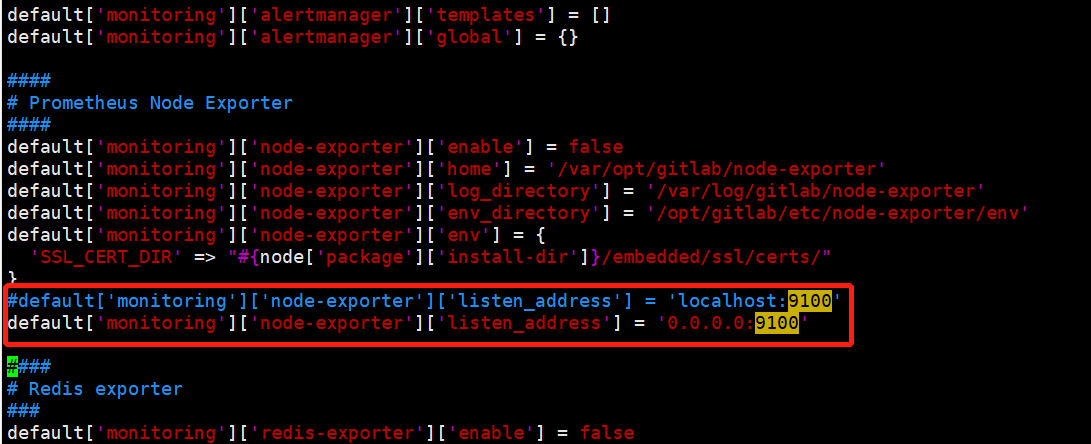
把 localhost:9100 改成 0.0.0.0:9100 ,然后重新初始化配置 :gitlab-ctl reconfigure
这样需要用到这个配置的地方都会从这里取值,由于很多地方用到这个值如果只单独去修改某个地方的值会导致其他地方的值不匹配,再查找下 grep :9100 * -r ,发现所有的 localhost:9100 都会变成 0.0.0.0:9100
再浏览器测试下发现已经正常:http://ip:9100/metrics

 浙公网安备 33010602011771号