prometheus+Grafana安装入门和简单使用
1.准备工作
prometheus 和 InfluxDB 都是 时序数据库,都可以在程序中埋点监控
官网地址:https://prometheus.io/download/
官网地址:https://grafana.com/grafana/download
prometheus github地址: https://github.com/prometheus
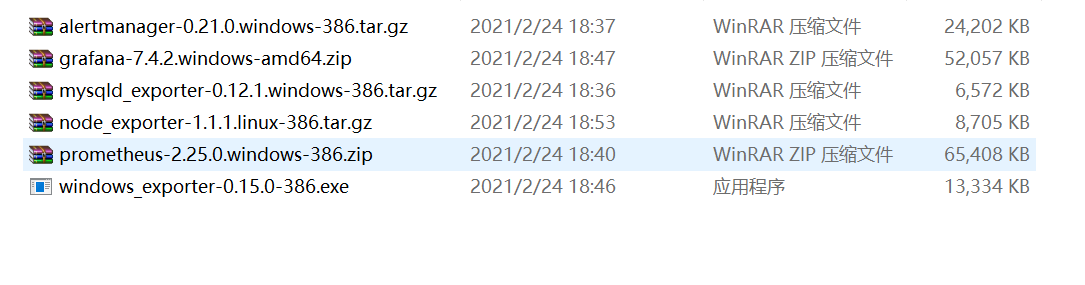
windows系统监控exporter
windows_exporter 地址:https://github.com/prometheus-community/windows_exporter/tags
linux系统监控exporter
node_exporter 地址:https://github.com/prometheus/node_exporter/releases

2.启动
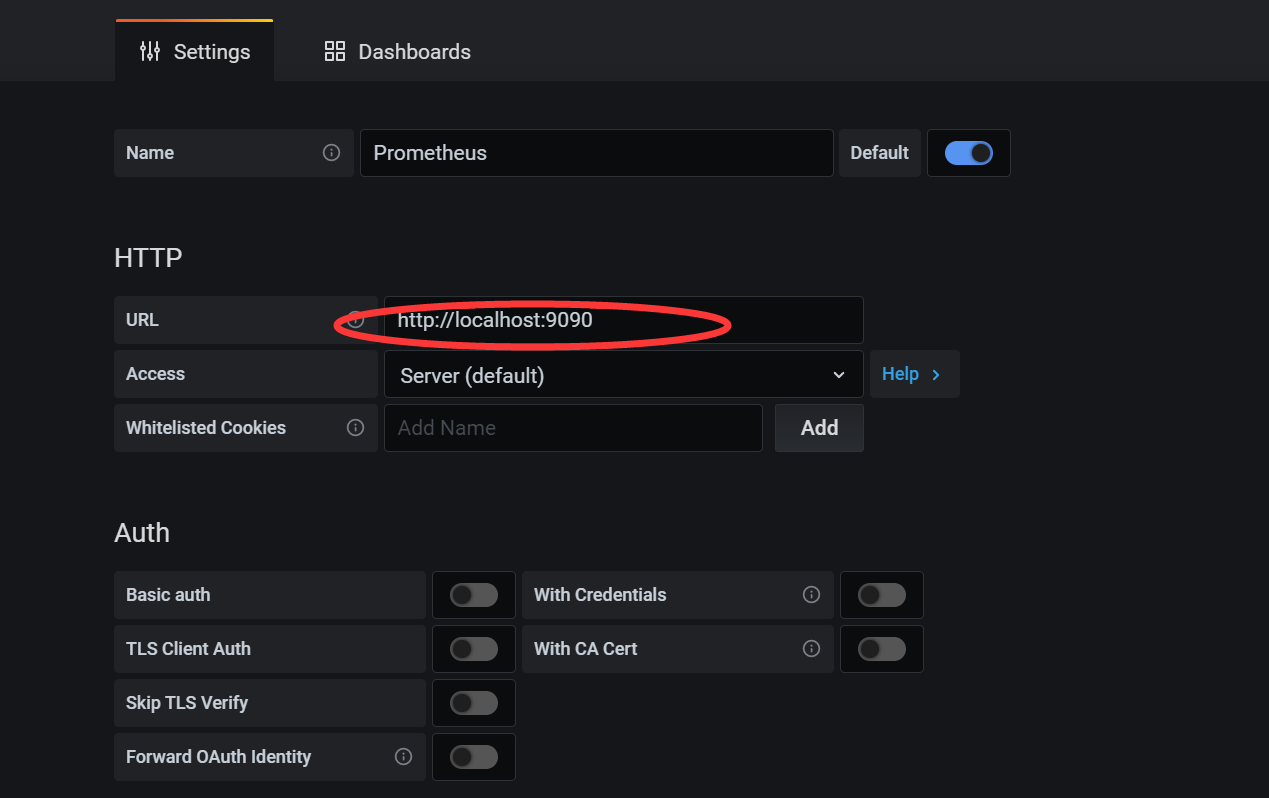
prometheus和grafana都是直接双击exe启动,访问地址分别是:http://localhost:9090 和 http://localhost:3000


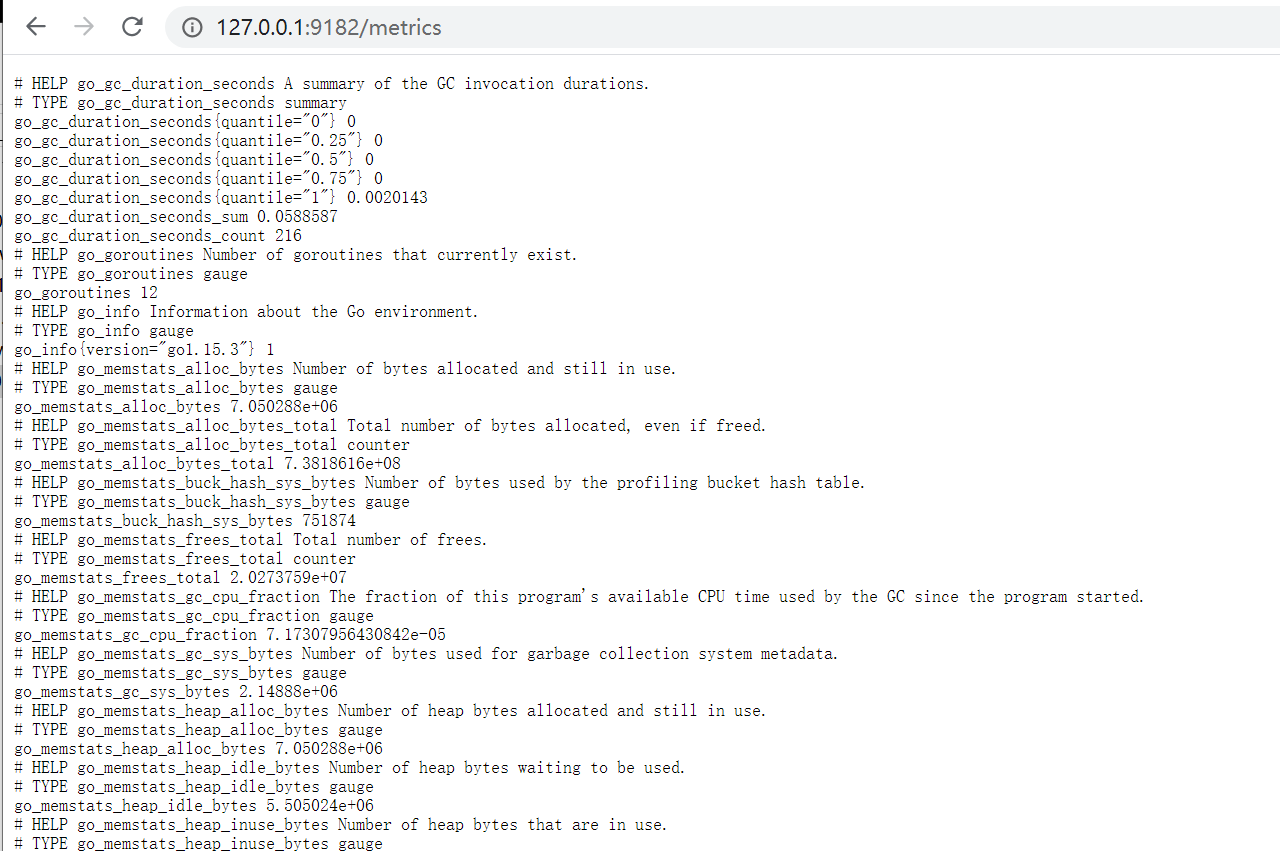
3.启动 windows_exporter,直接双击 windows_exporter-0.15.0-386.exe启动
访问:http://127.0.0.1:9182/metrics
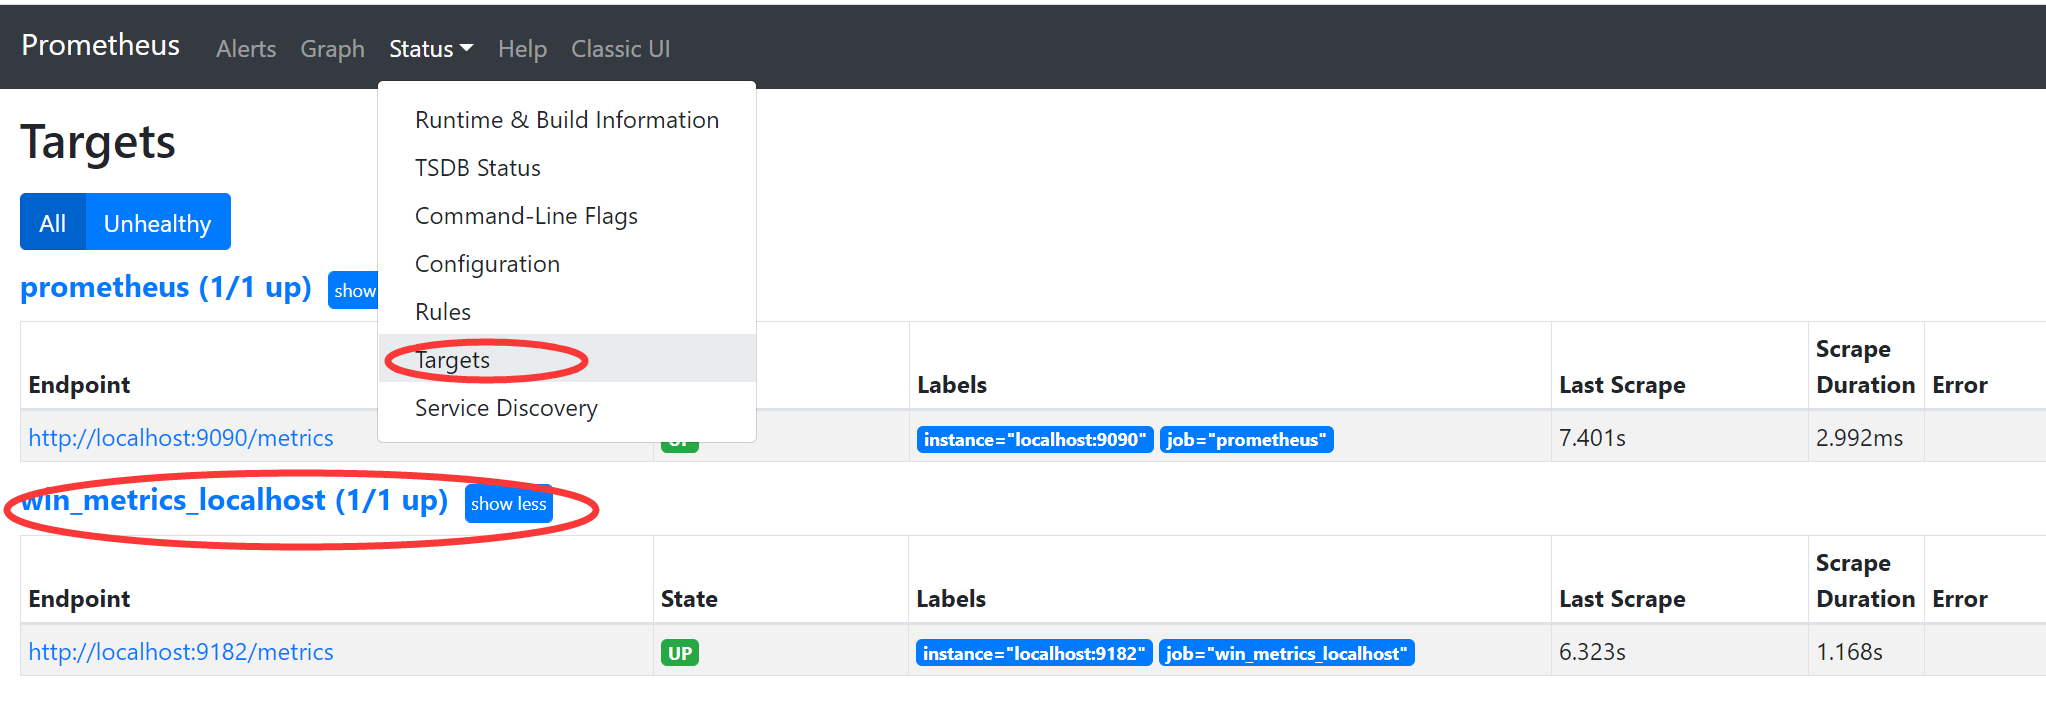
3.修改prometheus.yml文件,加入监控任务
  - job_name: 'win_metrics_localhost'
    static_configs:
    - targets: ['localhost:9182']
4.在grnfana添加数据源和Dashboards模版

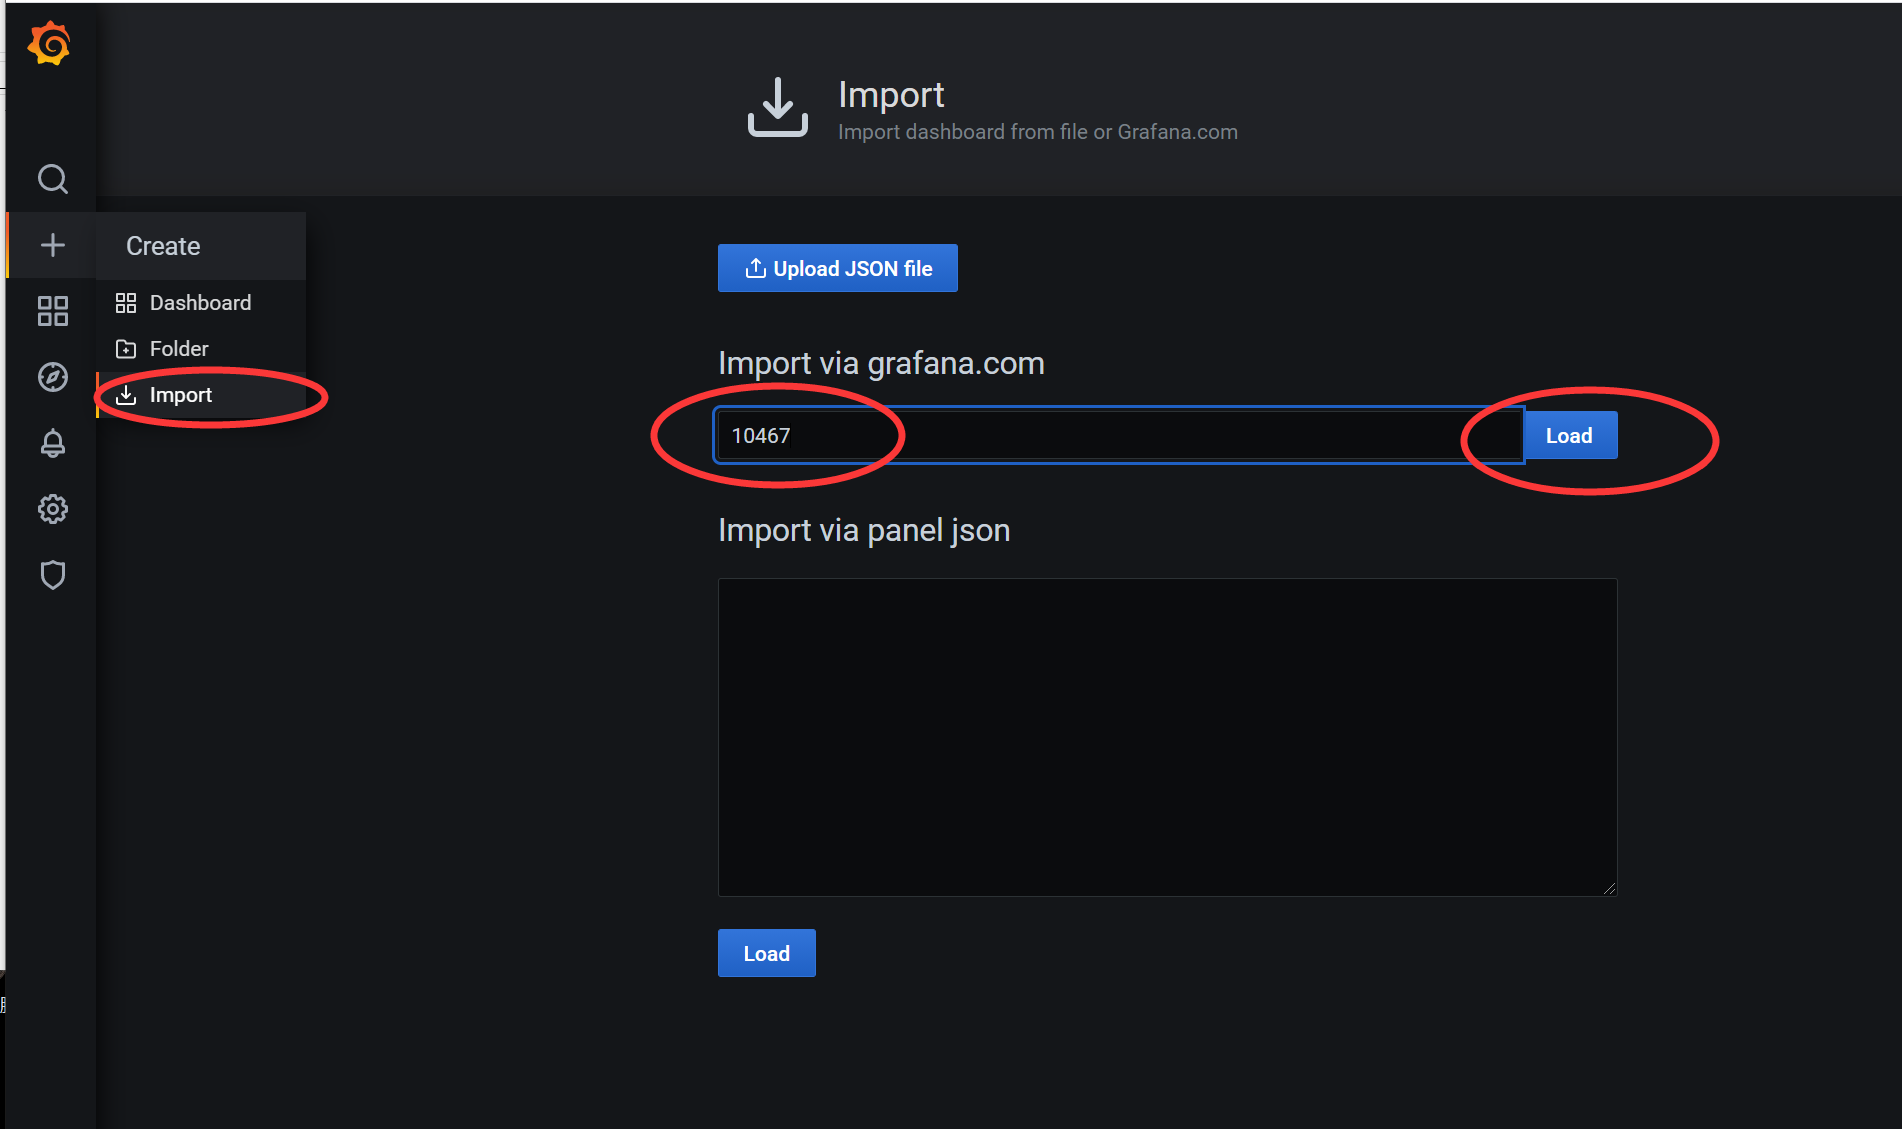

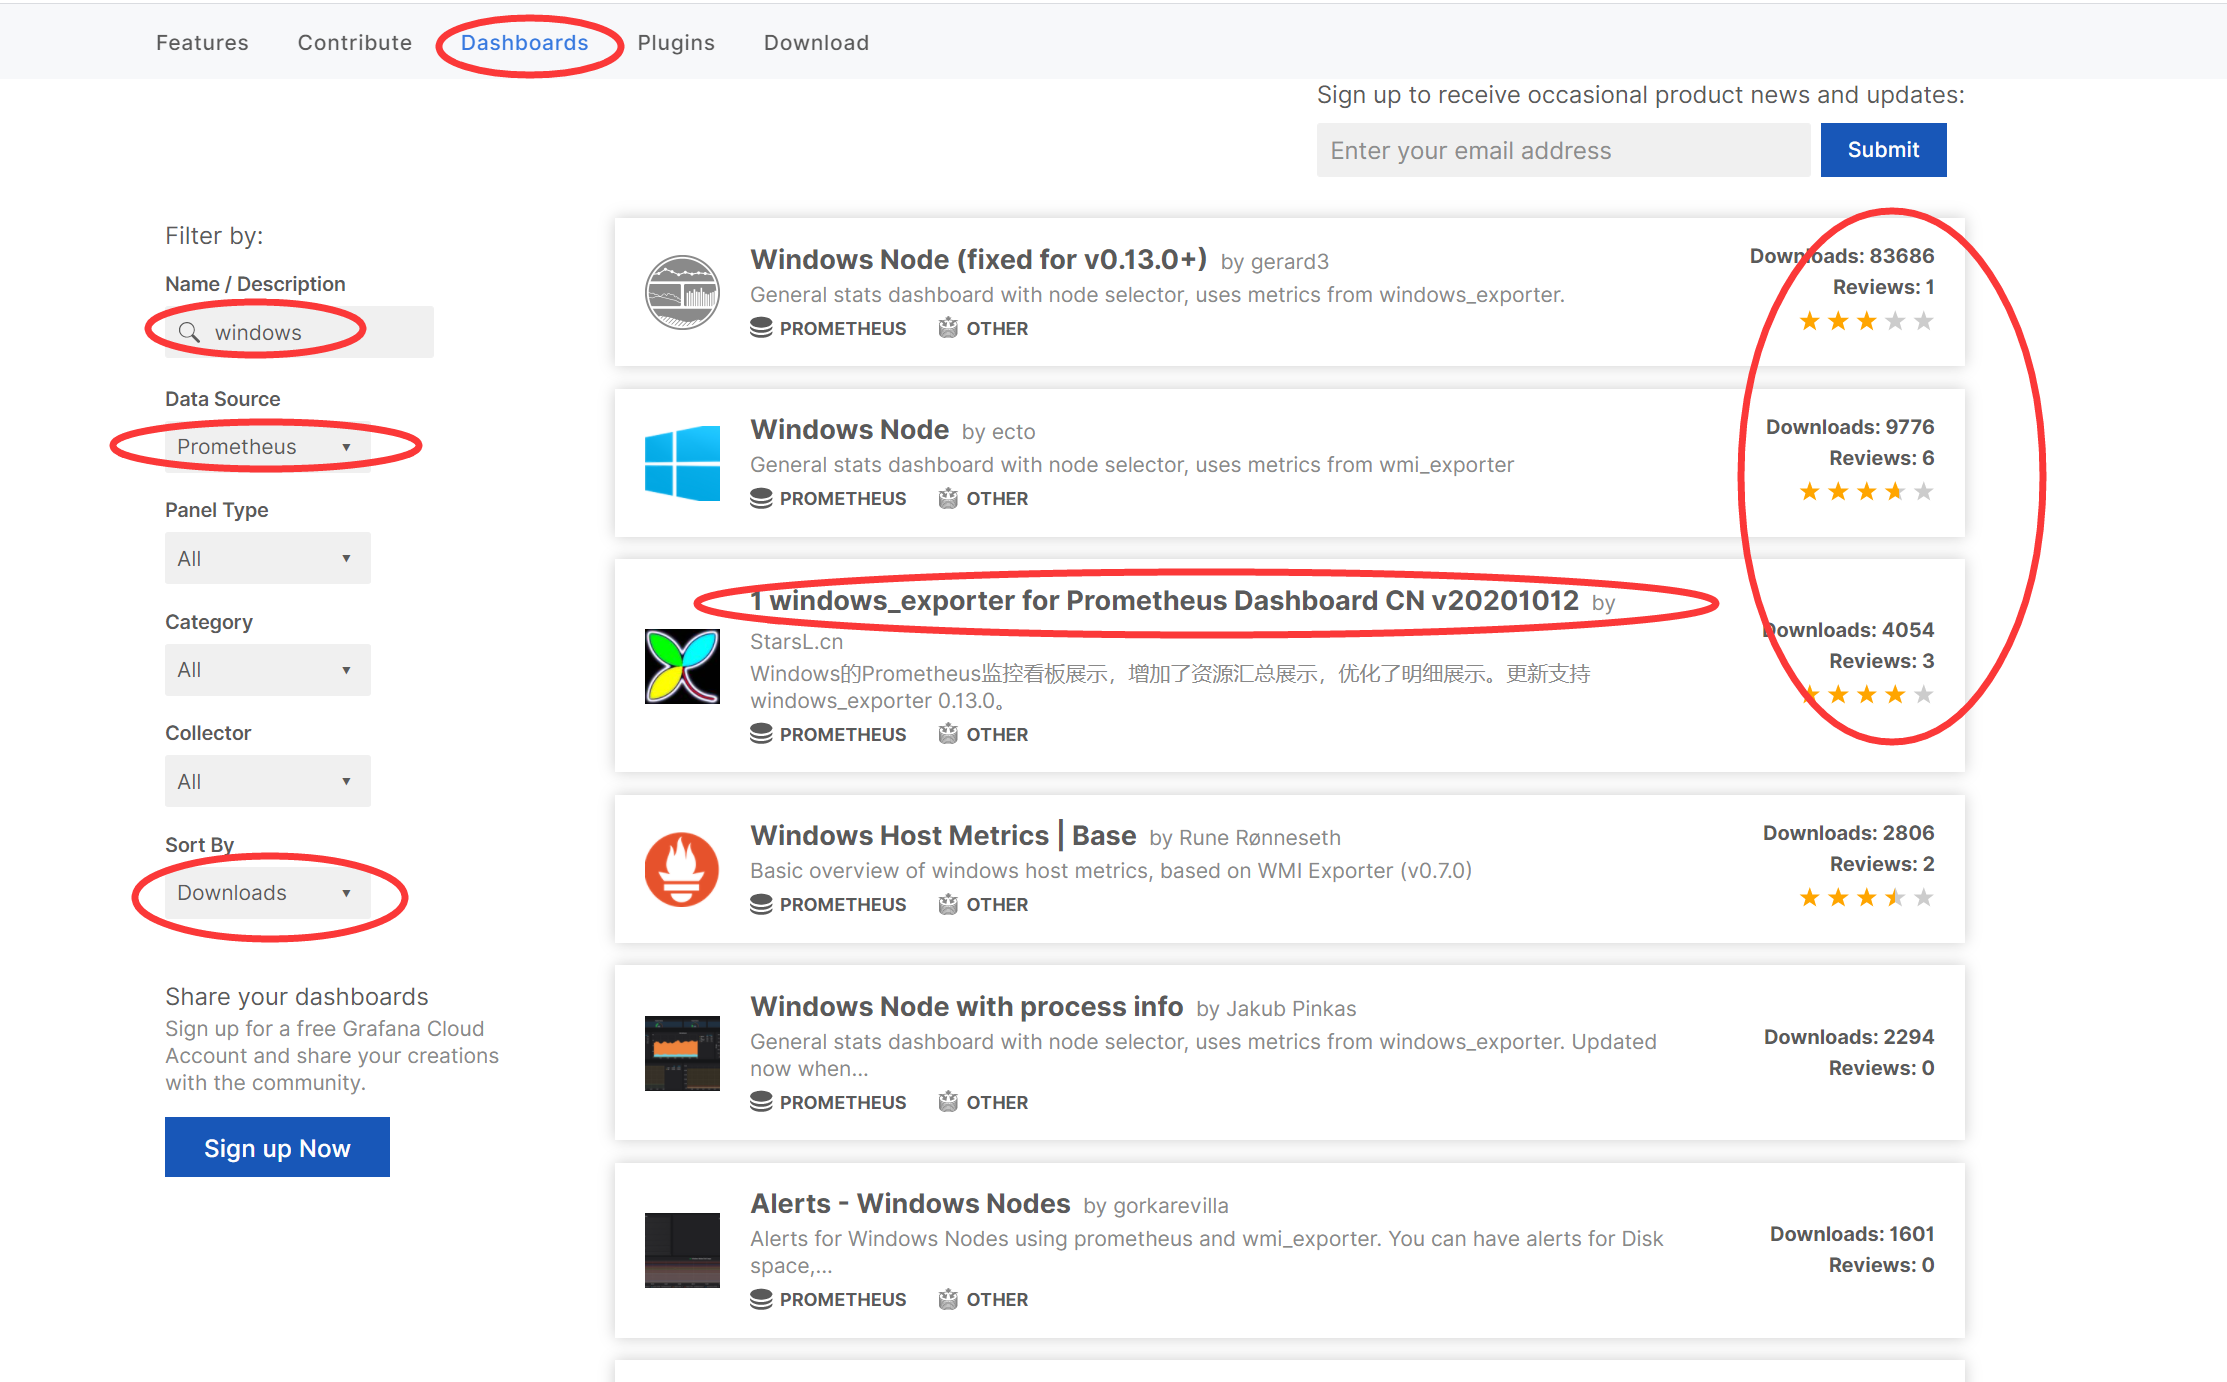
5.如何查找Dashboards模版
网址:https://grafana.com/grafana/dashboards