
Vue 中 实现一个简单的 echarts
vue 中 实现一个简单的 echarts
01) vue 中 实现一个简单的 echarts


<template>
    <div>
        <div id="charts_1" style="width: 500px;height: 500px;"></div>
    </div>
</template>
<script>
    import * as ECharts from 'echarts/lib/echarts'; // 引入 ECharts 主模块
    import 'echarts/lib/chart/line'; // 引入折线图。
    import 'echarts/lib/component/tooltip';  // 引入提示框组件。
    import 'echarts/lib/component/title';   // 引入标题组件。
    import 'echarts/lib/component/toolbox'; // 引入工具箱组件。

    export default {
        created() {
            this.$nextTick(() => {
                this.myChart1();
            })
        },
        methods: {
            myChart1() {
                let myChart = ECharts.init(document.getElementById('charts_1'));
                myChart.resize();
                let option = {
                    xAxis: {
                        type: 'category',
                        data: ['Mon', 'Tue', 'Wed', 'Thu', 'Fri', 'Sat', 'Sun']
                    },
                    yAxis: {
                        type: 'value'
                    },
                    series: [{
                        data: [820, 932, 901, 934, 1290, 1330, 1320],
                        type: 'line'
                    }]
                };
                myChart.setOption(option)
            }
        },
    };
</script>

<style scoped>

</style>

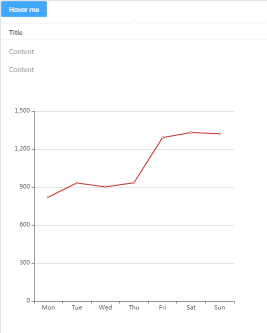
02) ant 气泡卡片中实现一个简单的 echarts
<template>
    <div>
        <a-popover title="Title" @visibleChange="handleHoverChange">
            <template slot="content">
                <p>Content</p>
                <p>Content</p>
                <div id="charts_1" style="width: 500px;height: 500px;"></div>
            </template>
            <a-button type="primary">
                Hover me
            </a-button>
        </a-popover>
    </div>
</template>
<script>

    /* 这是ant-design-vue */
    import Vue from 'vue'
    import Antd, {message, Select} from 'ant-design-vue'  //这是ant-design-vue
    import 'ant-design-vue/dist/antd.css'
    Vue.use(Antd);
    /* 这是ant-design-vue */

    import * as ECharts from 'echarts/lib/echarts'; // 引入 ECharts 主模块
    import 'echarts/lib/chart/line'; // 引入折线图。
    import 'echarts/lib/component/tooltip';  // 引入提示框组件。
    import 'echarts/lib/component/title';   // 引入标题组件。
    import 'echarts/lib/component/toolbox'; // 引入工具箱组件。

    export default {
        methods: {
            handleHoverChange(isVisible) {
                if (isVisible) {
                    setTimeout(() => {
                        this.$nextTick(() => {
                            this.myChart1();
                        });
                    }, 301)
                }
            },
            myChart1() {
                let myChart = ECharts.init(document.getElementById('charts_1'));
                myChart.resize();
                let option = {
                    xAxis: {
                        type: 'category',
                        data: ['Mon', 'Tue', 'Wed', 'Thu', 'Fri', 'Sat', 'Sun']
                    },
                    yAxis: {
                        type: 'value'
                    },
                    series: [{
                        data: [820, 932, 901, 934, 1290, 1330, 1320],
                        type: 'line'
                    }]
                };
                myChart.setOption(option)
            }
        },
    };
</script>

<style scoped>

</style>
03) 暂无数据提示---类型1
let option = {
  graphic: {
    type: 'text',
    left: 'center',
    top: '40%',
    style: {
      text: '暂无数据',
      textAlign: 'center',
      fill: '#c0c0c0',
      fontSize: 20,
      fontWeight: 700
    }
  },
};

03-2) 暂无数据提示---类型2
let option = {
  title: {
    text: '暂无数据',
    left: 'center',
    top: '50%',
    textStyle: {
      color: '#dda0dd',
      fontSize: 36,
    }
  },
};

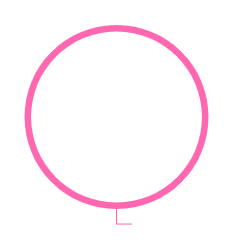
03-3) 暂无数据提示---类型2
let option = {
  color: ['#ff68b1', '#D8D8D8'], // 控制圆环颜色
  series: [
    {
      name: '运动情况',
      type: 'pie',
      radius: ['65%', '70%'],
      data: [ // 控制圆环颜色
        {value: 0, name: ''}
      ]
    }
  ]
};
ECharts官方:
其他:
a) 基于 Vue2.x 封装的 Echarts 图表组件
a-1) 文档地址
a-2) 备用文档地址
a-3) demo演示地址
b) 基于 Vue2.x 和 Vue3.x 封装的 Echarts 图表组件
支持Vue2 和 Vue3

 浙公网安备 33010602011771号