
python可视化图标
python可视化一般可以选择 matplotlib
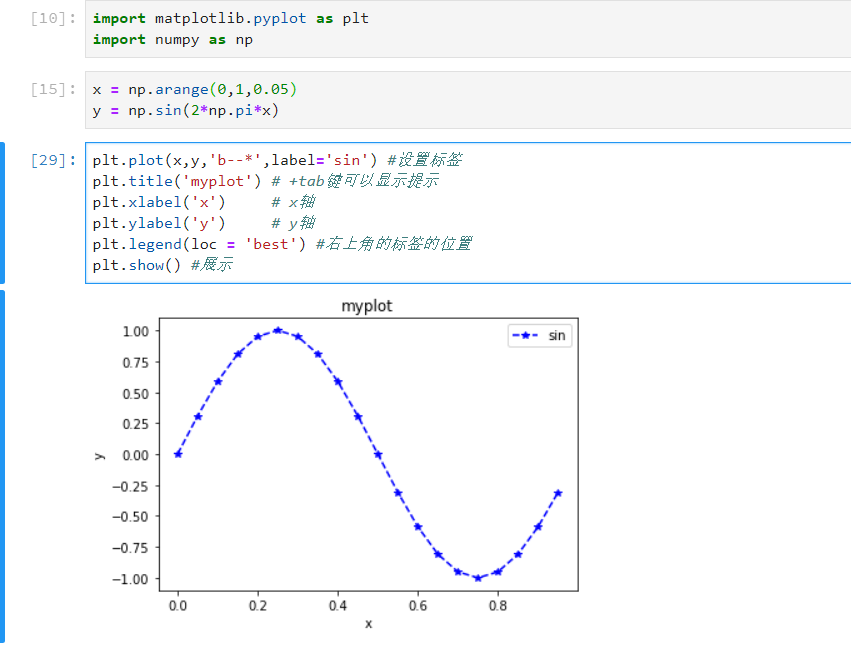
import matplotlib.pyplot as plt
import numpy  as np
plt.plot(?,?,' ')  后面的参数是颜色 b--* 蓝色曲线 点用星号
plt.show()
plt.title('  ')
plt.xlabel('    ')
plt.ylabel('    ')
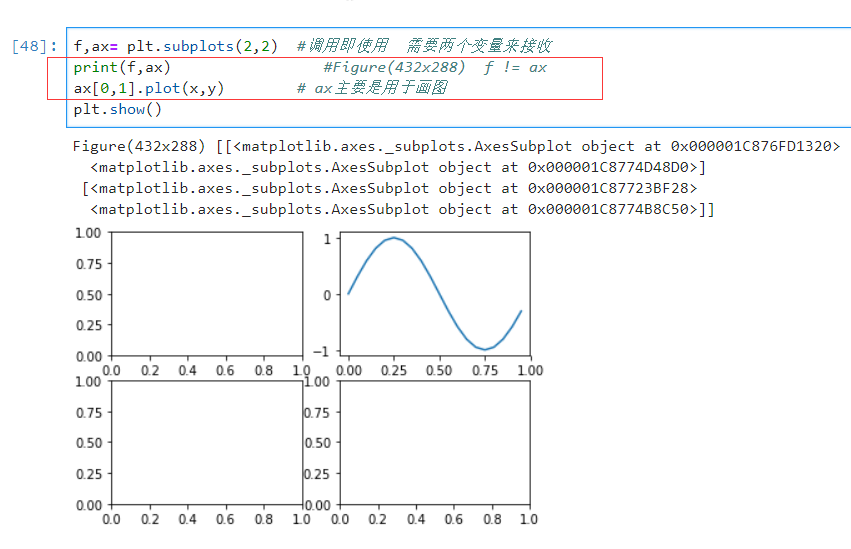
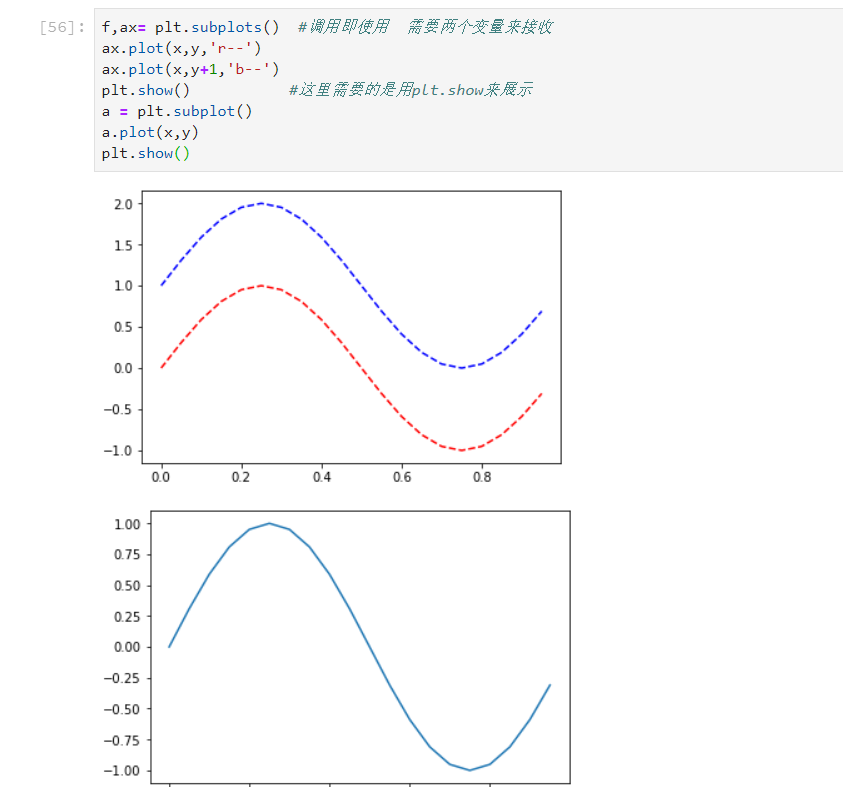
subplot() 与 subplots()都是画图
保存绘制后的图片
f.savefig('D:\\fig.jpg') # 用于保存fig的图片
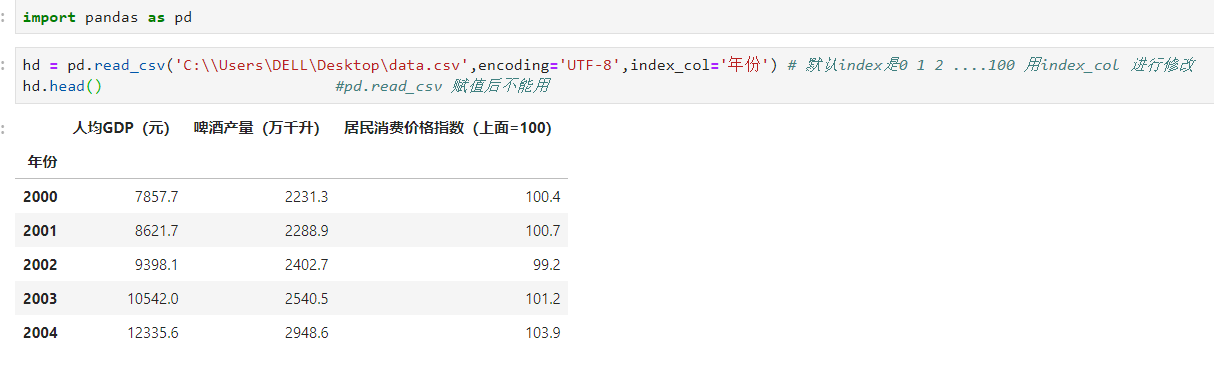
读数据
import pandas as pd
pd.read_csv('c:\\xxx\xxx\xx',encoding='UTF-85')
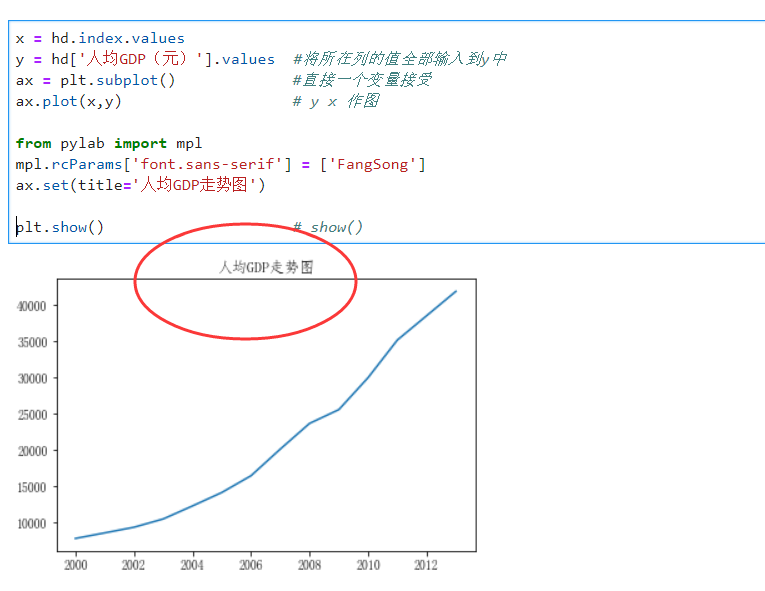
画折线图 也就是普通图
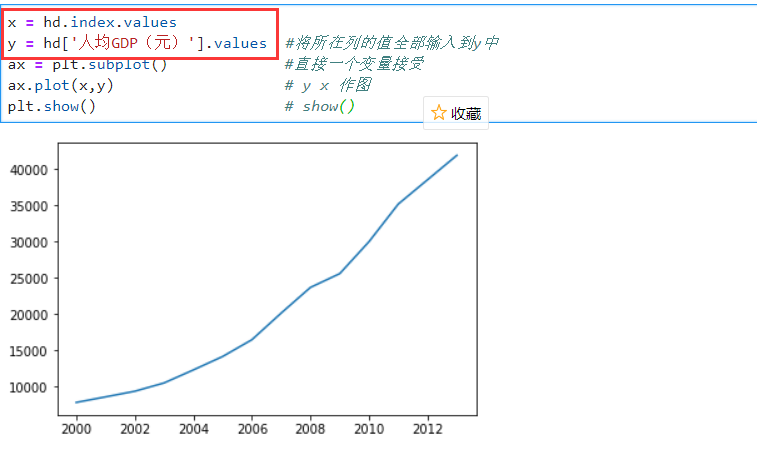
改字体
饼图 pie
ax = plt.subplot()
ax.pie(y,labels{x各个区域的标签} ,  explode=[0.5] 间隔0.5可以多个参数)
plt.show()
绘制词云图
读数据的时候要用""双引号
第一步读数据
with open("C:\\Users\DELL\Desktop\classify_model1.csv",encoding='UTF-8') as file:
    words = file.read()
print(words)  #把file 放在了 file里了
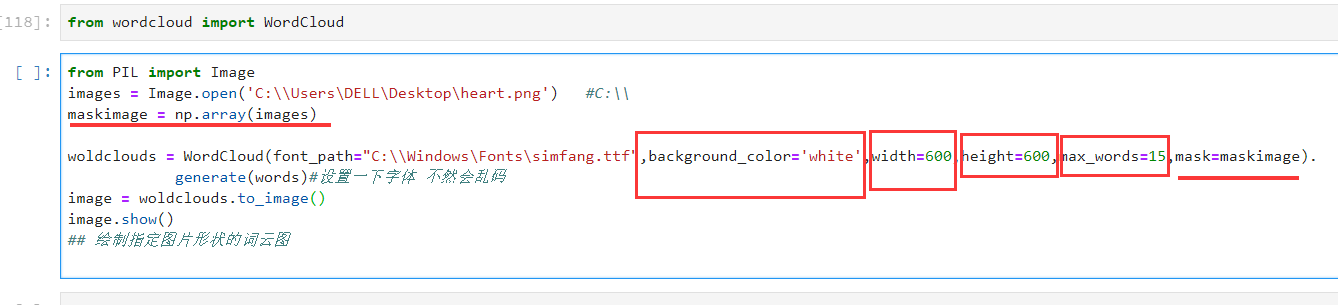
第二步导入云词语相关的包 以及配置
from wordcloud import WordCloud
woldclouds = WordCloud(font_path='C:/Windows/Fonts/simfang.ttf',background_color='white',width=600,height=600,max_words=15).generate(words)#设置一下字体 不然会乱码
image = woldclouds.to_image()
image.show()

 浙公网安备 33010602011771号