基于外部prometheus监控k8s 集群及k8s应用服务
一、在k8s集群外部准备一个Prometheus监控系统
搭建部署可参考:https://www.cnblogs.com/cyh00001/p/16701266.html
二、创建用户并授权
2.1、准备授权文件
cat case4-prom-rbac.yaml
apiVersion: v1
kind: ServiceAccount
metadata:
  name: prometheus
  namespace: monitoring

---
apiVersion: v1
kind: Secret
type: kubernetes.io/service-account-token
metadata:
  name: monitoring-token
  namespace: monitoring
  annotations:
    kubernetes.io/service-account.name: "prometheus"
---
apiVersion: rbac.authorization.k8s.io/v1
kind: ClusterRole
metadata:
  name: prometheus
rules:
- apiGroups:
  - ""
  resources:
  - nodes
  - services
  - endpoints
  - pods
  - nodes/proxy
  verbs:
  - get
  - list
  - watch
- apiGroups:
  - "extensions"
  resources:
    - ingresses
  verbs:
  - get
  - list
  - watch
- apiGroups:
  - ""
  resources:
  - configmaps
  - nodes/metrics
  verbs:
  - get
- nonResourceURLs:
  - /metrics
  verbs:
  - get
---
#apiVersion: rbac.authorization.k8s.io/v1beta1
apiVersion: rbac.authorization.k8s.io/v1
kind: ClusterRoleBinding
metadata:
  name: prometheus
roleRef:
  apiGroup: rbac.authorization.k8s.io
  kind: ClusterRole
  name: prometheus
subjects:
- kind: ServiceAccount
  name: prometheus
  namespace: monitoring
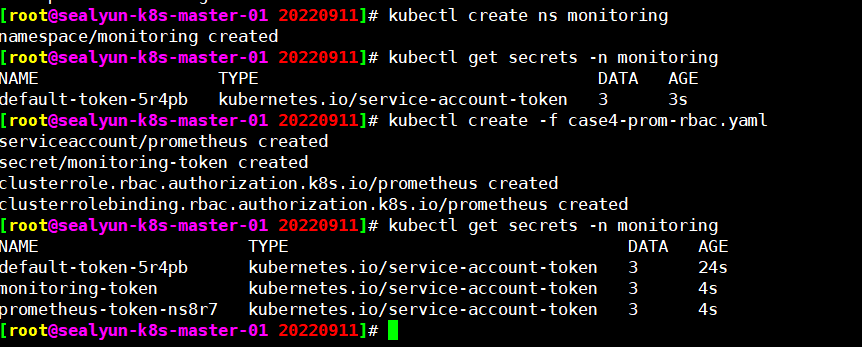
[root@sealyun-k8s-master-01 20220911]# kubectl describe secrets -n monitoring monitoring-token
Name:         monitoring-token
Namespace:    monitoring
Labels:       <none>
Annotations:  kubernetes.io/service-account.name: prometheus
              kubernetes.io/service-account.uid: 4edd037d-bec0-4135-ba96-03d25c88a874

Type:  kubernetes.io/service-account-token

Data
====
ca.crt:     1070 bytes
namespace:  10 bytes
token:      eyJhbGciOiJSUzI1NiIsImtpZCI6IjMtSTlpb2JuWWJ2ek1SYXY2eWRxMXhLRUQ0XzRSdkVyU1BsREc1aktRMW8ifQ.eyJpc3MiOiJrdWJlcm5ldGVzL3NlcnZpY2VhY2NvdW50Iiwia3ViZXJuZXRlcy5pby9zZXJ2aWNlYWNjb3VudC9uYW1lc3BhY2UiOiJtb25pdG9yaW5nIiwia3ViZXJuZXRlcy5pby9zZXJ2aWNlYWNjb3VudC9zZWNyZXQubmFtZSI6Im1vbml0b3JpbmctdG9rZW4iLCJrdWJlcm5ldGVzLmlvL3NlcnZpY2VhY2NvdW50L3NlcnZpY2UtYWNjb3VudC5uYW1lIjoicHJvbWV0aGV1cyIsImt1YmVybmV0ZXMuaW8vc2VydmljZWFjY291bnQvc2VydmljZS1hY2NvdW50LnVpZCI6IjRlZGQwMzdkLWJlYzAtNDEzNS1iYTk2LTAzZDI1Yzg4YTg3NCIsInN1YiI6InN5c3RlbTpzZXJ2aWNlYWNjb3VudDptb25pdG9yaW5nOnByb21ldGhldXMifQ.Tq20uSWOaSrZPZiameXBBf6imozv7OnK_44CDA3zZD4O1yguMBb9Ei-kJ_b2Bd3k4bMsK__HLBFBHrQNq5PWJd4F6d_aL3HJYlu4SQ1mICRCVZnb9D3xzQZOZ6KtS105ALcJc_yWUlgnOQSa5YMQLU9uThKm7Q7viqBnJSWhxKnpS5NFEgTN7yAlRAfMIryPOBunvdLBlqNabPpIMu5su9KaT8iqSjUjup6DpIdn-9rjrzg2qa-vh0LY6EzwDo_wEBen6P02ruwoiWupEI5iftvEhaZ7tym5dgA9kei1oc8ByQ5KNeu6GiI6QodhUXDGQmXMfNkr5XGIL8HoU5Nubg
[root@sealyun-k8s-master-01 20220911]#
2.2、创建k8s.token
[root@monitoring prometheus]# pwd
/opt/prometheus
[root@monitoring prometheus]# vim k8s.token
[root@monitoring prometheus]# cat k8s.token
eyJhbGciOiJSUzI1NiIsImtpZCI6IjMtSTlpb2JuWWJ2ek1SYXY2eWRxMXhLRUQ0XzRSdkVyU1BsREc1aktRMW8ifQ.eyJpc3MiOiJrdWJlcm5ldGVzL3NlcnZpY2VhY2NvdW50Iiwia3ViZXJuZXRlcy5pby9zZXJ2aWNlYWNjb3VudC9uYW1lc3BhY2UiOiJtb25pdG9yaW5nIiwia3ViZXJuZXRlcy5pby9zZXJ2aWNlYWNjb3VudC9zZWNyZXQubmFtZSI6Im1vbml0b3JpbmctdG9rZW4iLCJrdWJlcm5ldGVzLmlvL3NlcnZpY2VhY2NvdW50L3NlcnZpY2UtYWNjb3VudC5uYW1lIjoicHJvbWV0aGV1cyIsImt1YmVybmV0ZXMuaW8vc2VydmljZWFjY291bnQvc2VydmljZS1hY2NvdW50LnVpZCI6IjRlZGQwMzdkLWJlYzAtNDEzNS1iYTk2LTAzZDI1Yzg4YTg3NCIsInN1YiI6InN5c3RlbTpzZXJ2aWNlYWNjb3VudDptb25pdG9yaW5nOnByb21ldGhldXMifQ.Tq20uSWOaSrZPZiameXBBf6imozv7OnK_44CDA3zZD4O1yguMBb9Ei-kJ_b2Bd3k4bMsK__HLBFBHrQNq5PWJd4F6d_aL3HJYlu4SQ1mICRCVZnb9D3xzQZOZ6KtS105ALcJc_yWUlgnOQSa5YMQLU9uThKm7Q7viqBnJSWhxKnpS5NFEgTN7yAlRAfMIryPOBunvdLBlqNabPpIMu5su9KaT8iqSjUjup6DpIdn-9rjrzg2qa-vh0LY6EzwDo_wEBen6P02ruwoiWupEI5iftvEhaZ7tym5dgA9kei1oc8ByQ5KNeu6GiI6QodhUXDGQmXMfNkr5XGIL8HoU5Nubg
[root@monitoring prometheus]#
cat prometheus.yaml
# my global config
global:
  scrape_interval: 15s # Set the scrape interval to every 15 seconds. Default is every 1 minute.
  evaluation_interval: 15s # Evaluate rules every 15 seconds. The default is every 1 minute.
  # scrape_timeout is set to the global default (10s).

# Alertmanager configuration
alerting:
  alertmanagers:
    - static_configs:
        - targets:
          # - alertmanager:9093

# Load rules once and periodically evaluate them according to the global 'evaluation_interval'.
rule_files:
  # - "first_rules.yml"
  # - "second_rules.yml"

# A scrape configuration containing exactly one endpoint to scrape:
# Here it's Prometheus itself.
scrape_configs:
  # The job name is added as a label `job=<job_name>` to any timeseries scraped from this config.
  - job_name: "prometheus"
    static_configs:
      - targets: ["localhost:9090"]

  - job_name: 'file_sd_node_export'
    file_sd_configs:
      - files:
        - /opt/prometheus/file_sd/sd_node-exporter.json
        refresh_interval: 10s

  - job_name: 'file_sd_process_export'
    file_sd_configs:
      - files:
        - /opt/prometheus/file_sd/sd_process-exporter.json
        refresh_interval: 10s

#API Serevr节点发现
  - job_name: 'kubernetes-apiservers-monitor'
    kubernetes_sd_configs:
    - role: endpoints
      api_server: https://172.16.88.181:6443
      tls_config:
        insecure_skip_verify: true
      bearer_token_file: /opt/prometheus/k8s.token
    scheme: https
    tls_config:
      insecure_skip_verify: true
    bearer_token_file: /opt/prometheus/k8s.token
    relabel_configs:
    - source_labels: [__meta_kubernetes_namespace, __meta_kubernetes_service_name, __meta_kubernetes_endpoint_port_name]
      action: keep
      regex: default;kubernetes;https
    #课自定义替换发现的服务器端口、协议等
    - source_labels: [__address__]
      regex: '(.*):6443'
      replacement: '${1}:9100'
      target_label: __address__
      action: replace
    - source_labels: [__scheme__]
      regex: https
      replacement: http
      target_label: __scheme__
      action: replace

#node节点发现
  - job_name: 'kubernetes-nodes-monitor'
    scheme: http
    tls_config:
      insecure_skip_verify: true
    bearer_token_file: /opt/prometheus/k8s.token
    kubernetes_sd_configs:
    - role: node
      api_server: https://172.16.88.181:6443
      tls_config:
        insecure_skip_verify: true
      bearer_token_file: /opt/prometheus/k8s.token
    relabel_configs:
      - source_labels: [__address__]
        regex: '(.*):10250'
        replacement: '${1}:9100'
        target_label: __address__
        action: replace
      - source_labels: [__meta_kubernetes_node_label_failure_domain_beta_kubernetes_io_region]
        regex: '(.*)'
        replacement: '${1}'
        action: replace
        target_label: LOC
      - source_labels: [__meta_kubernetes_node_label_failure_domain_beta_kubernetes_io_region]
        regex: '(.*)'
        replacement: 'NODE'
        action: replace
        target_label: Type
      - source_labels: [__meta_kubernetes_node_label_failure_domain_beta_kubernetes_io_region]
        regex: '(.*)'
        replacement: 'K8S-test'
        action: replace
        target_label: Env
      - action: labelmap
        regex: __meta_kubernetes_node_label_(.+)

#指定namespace 的pod
  - job_name: 'kubernetes-发现指定namespace的所有pod'
    kubernetes_sd_configs:
    - role: pod
      api_server: https://172.16.88.181:6443
      tls_config:
        insecure_skip_verify: true
      bearer_token_file: /opt/prometheus/k8s.token
      namespaces:
        names:
        - kube-system
        - openebs
    relabel_configs:
    - action: labelmap
      regex: __meta_kubernetes_pod_label_(.+)
    - source_labels: [__meta_kubernetes_namespace]
      action: replace
      target_label: kubernetes_namespace
    - source_labels: [__meta_kubernetes_pod_name]
      action: replace
      target_label: kubernetes_pod_name

#指定Pod发现条件
  - job_name: 'kubernetes-指定发现条件的pod'
    kubernetes_sd_configs:
    - role: pod
      api_server: https://172.16.88.181:6443
      tls_config:
        insecure_skip_verify: true
      bearer_token_file: /opt/prometheus/k8s.token
    relabel_configs:
    - source_labels: [__meta_kubernetes_pod_annotation_prometheus_io_scrape]
      action: keep
      regex: true
    - source_labels: [__meta_kubernetes_pod_annotation_prometheus_io_path]
      action: replace
      target_label: __metrics_path__
      regex: (.+)
    - source_labels: [__address__, __meta_kubernetes_pod_annotation_prometheus_io_port]
      action: replace
      regex: ([^:]+)(?::\d+)?;(\d+)
      replacement: $1:$2
      target_label: __address__
    - action: labelmap
      regex: __meta_kubernetes_pod_label_(.+)
    - source_labels: [__meta_kubernetes_namespace]
      action: replace
      target_label: kubernetes_namespace
    - source_labels: [__meta_kubernetes_pod_name]
      action: replace
      target_label: kubernetes_pod_name
    - source_labels: [__meta_kubernetes_pod_label_pod_template_hash]
      regex: '(.*)'
      replacement: 'K8S-test'
      action: replace
      target_label: Env
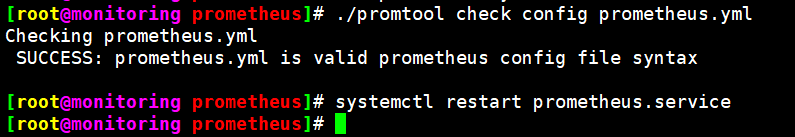
2.3、重启Prometheus服务
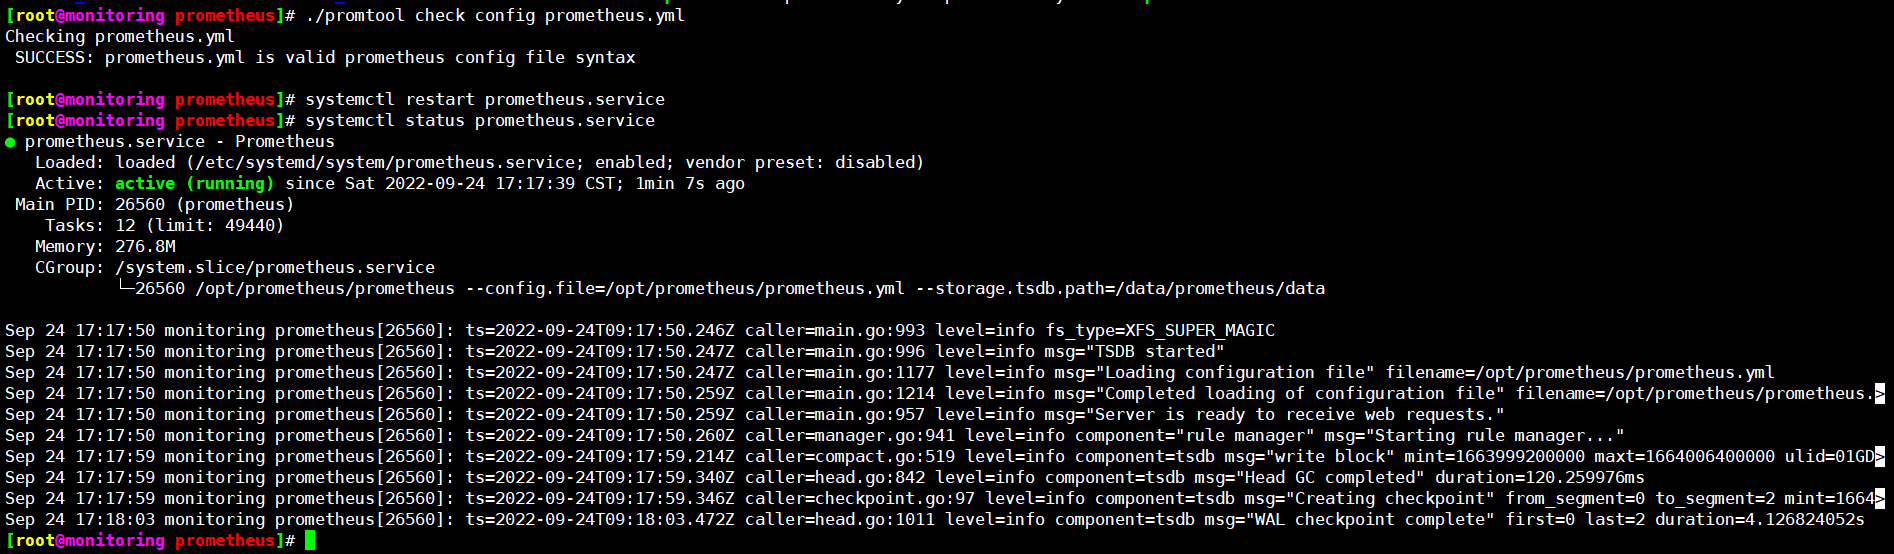
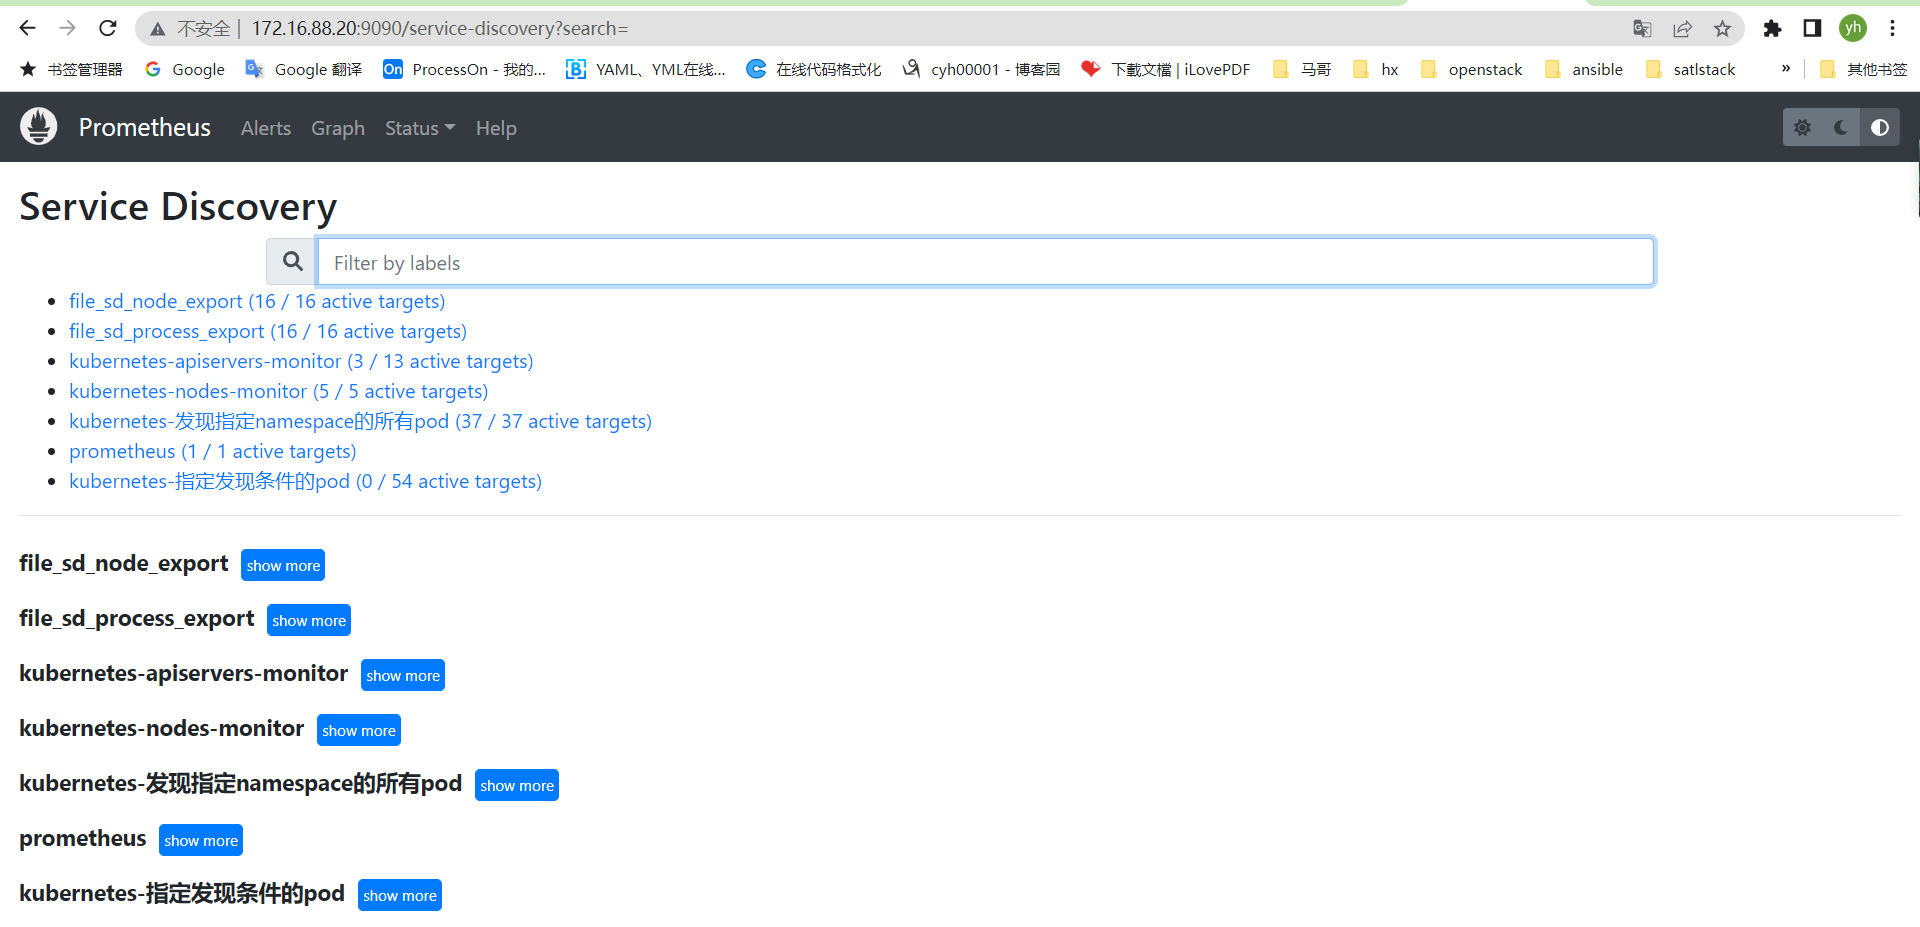
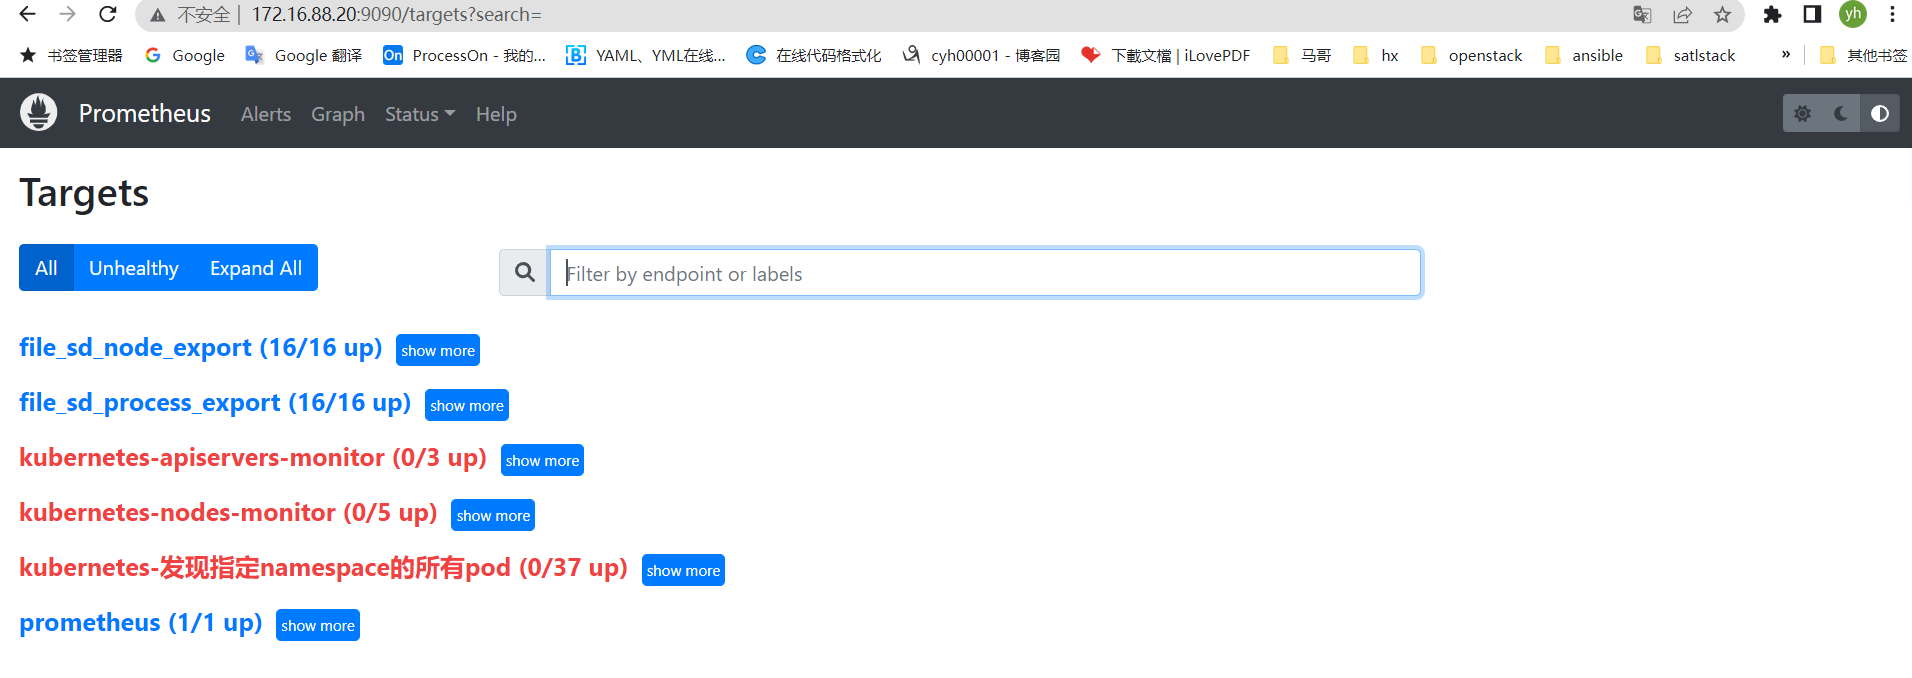
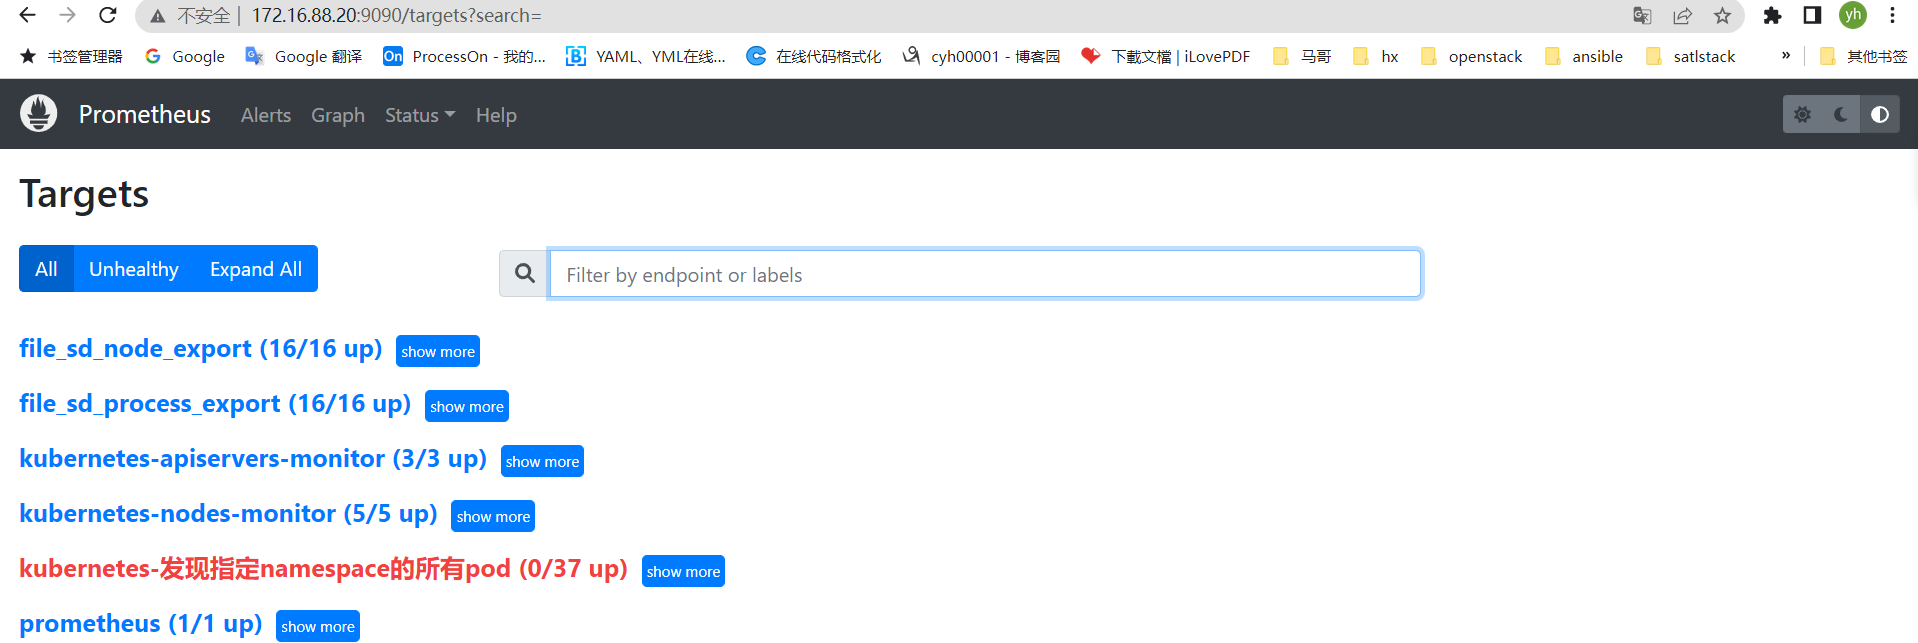
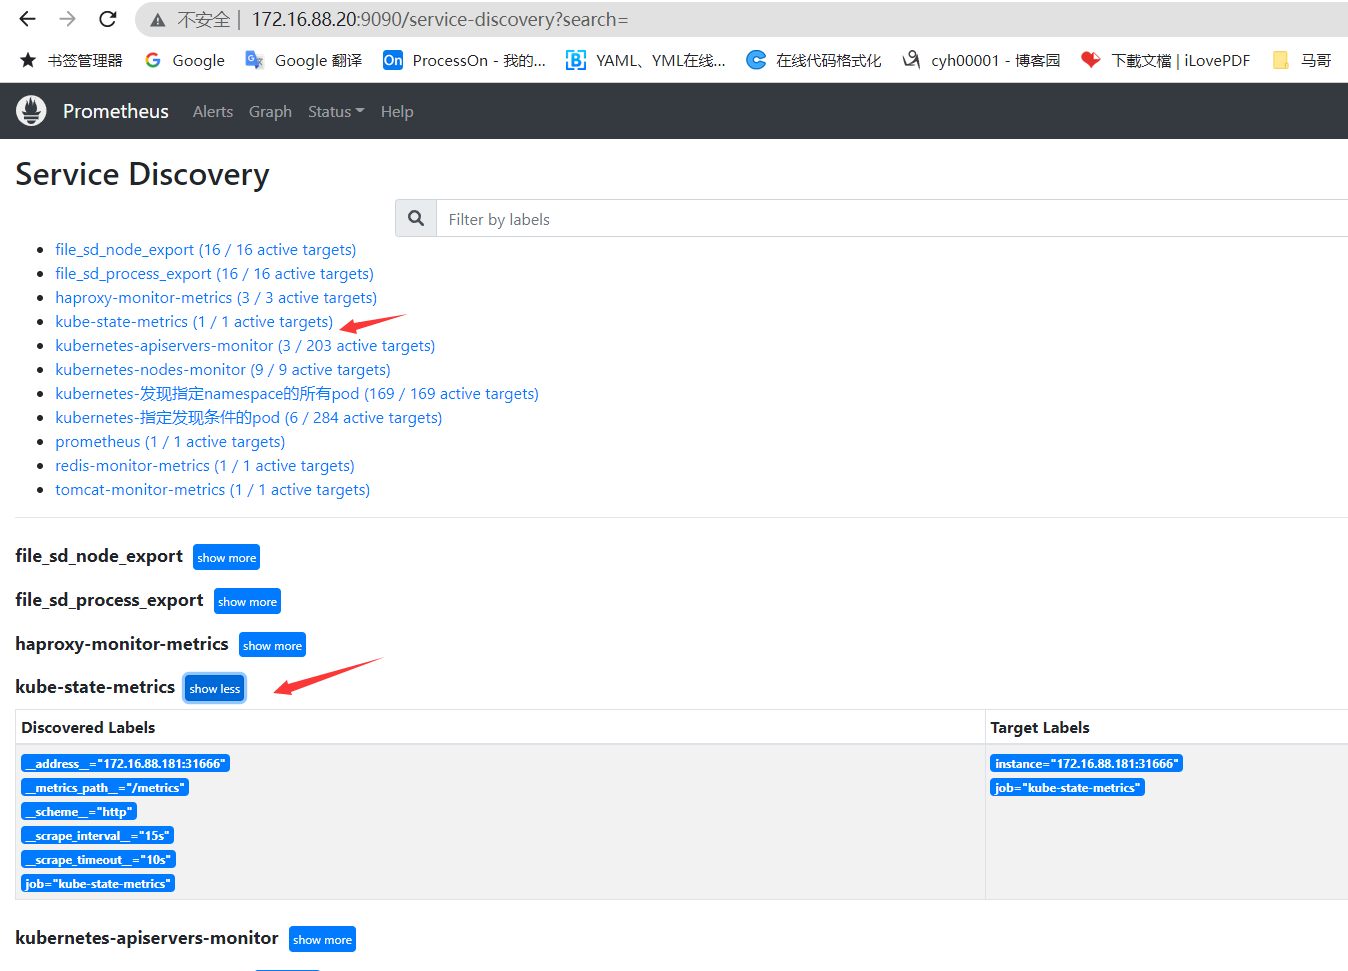
安装node-exporter即可解除上面标红
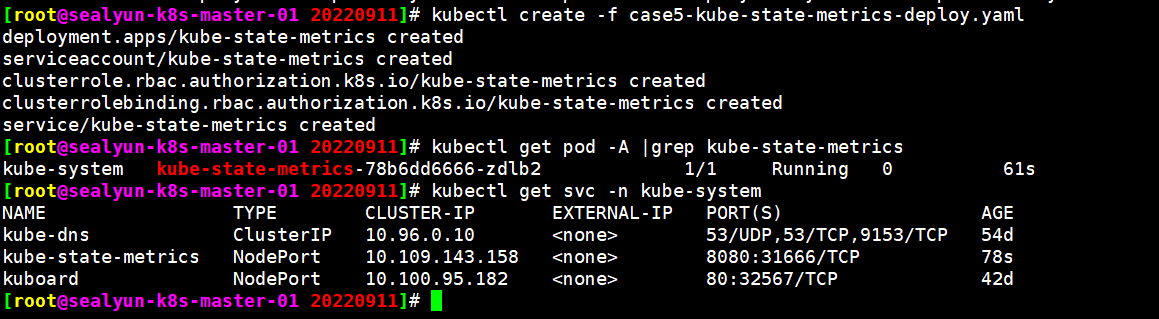
[root@sealyun-k8s-master-01 20220911]# ls
case1-daemonset-deploy-cadvisor.yaml       case3-1-prometheus-cfg.yaml         case3-3-prometheus-svc.yaml  case5-kube-state-metrics-deploy.yaml
case2-daemonset-deploy-node-exporter.yaml  case3-2-prometheus-deployment.yaml  case4-prom-rbac.yaml         grafana-enterprise.yaml
[root@sealyun-k8s-master-01 20220911]# kubectl create -f case2-daemonset-deploy-node-exporter.yaml
daemonset.apps/node-exporter created
service/node-exporter created
[root@sealyun-k8s-master-01 20220911]#
[root@sealyun-k8s-master-01 20220911]# kubectl get pod -n monitoring
NAME                  READY   STATUS    RESTARTS   AGE
node-exporter-59d5x   1/1     Running   0          101s
node-exporter-9mb8b   1/1     Running   0          101s
node-exporter-mr8vc   1/1     Running   0          101s
node-exporter-nzwtf   1/1     Running   0          101s
node-exporter-vwmst   1/1     Running   0          101s
[root@sealyun-k8s-master-01 20220911]#
三、监控kube-state-metrics
3.1、准备kube-state-metrics部署文件
cat case5-kube-state-metrics-deploy.yaml
apiVersion: apps/v1
kind: Deployment
metadata:
  name: kube-state-metrics
  namespace: kube-system
spec:
  replicas: 1
  selector:
    matchLabels:
      app: kube-state-metrics
  template:
    metadata:
      labels:
        app: kube-state-metrics
    spec:
      serviceAccountName: kube-state-metrics
      containers:
      - name: kube-state-metrics
        image: registry.cn-hangzhou.aliyuncs.com/zhangshijie/kube-state-metrics:v2.6.0
        ports:
        - containerPort: 8080

---
---
apiVersion: v1
kind: ServiceAccount
metadata:
  name: kube-state-metrics
  namespace: kube-system
---
apiVersion: rbac.authorization.k8s.io/v1
kind: ClusterRole
metadata:
  name: kube-state-metrics
rules:
- apiGroups: [""]
  resources: ["nodes", "pods", "services", "resourcequotas", "replicationcontrollers", "limitranges", "persistentvolumeclaims", "persistentvolumes", "namespaces", "endpoints"]
  verbs: ["list", "watch"]
- apiGroups: ["extensions"]
  resources: ["daemonsets", "deployments", "replicasets"]
  verbs: ["list", "watch"]
- apiGroups: ["apps"]
  resources: ["statefulsets"]
  verbs: ["list", "watch"]
- apiGroups: ["batch"]
  resources: ["cronjobs", "jobs"]
  verbs: ["list", "watch"]
- apiGroups: ["autoscaling"]
  resources: ["horizontalpodautoscalers"]
  verbs: ["list", "watch"]
---
apiVersion: rbac.authorization.k8s.io/v1
kind: ClusterRoleBinding
metadata:
  name: kube-state-metrics
roleRef:
  apiGroup: rbac.authorization.k8s.io
  kind: ClusterRole
  name: kube-state-metrics
subjects:
- kind: ServiceAccount
  name: kube-state-metrics
  namespace: kube-system

---
apiVersion: v1
kind: Service
metadata:
  annotations:
    prometheus.io/scrape: 'true'
  name: kube-state-metrics
  namespace: kube-system
  labels:
    app: kube-state-metrics
spec:
  type: NodePort
  ports:
  - name: kube-state-metrics
    port: 8080
    targetPort: 8080
    nodePort: 31666
    protocol: TCP
  selector:
    app: kube-state-metrics
3.2、配置Prometheus监控
vim prometheus.yml
#kube-state-metrics服务采集
  - job_name: "kube-state-metrics"
    static_configs:
      - targets: ["172.16.88.181:31666"]
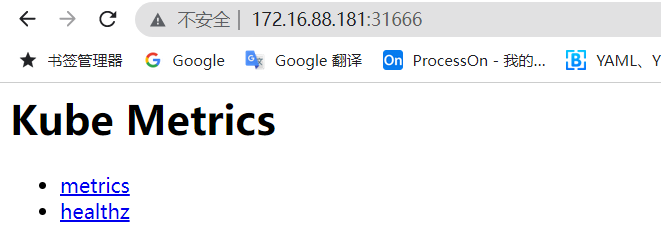
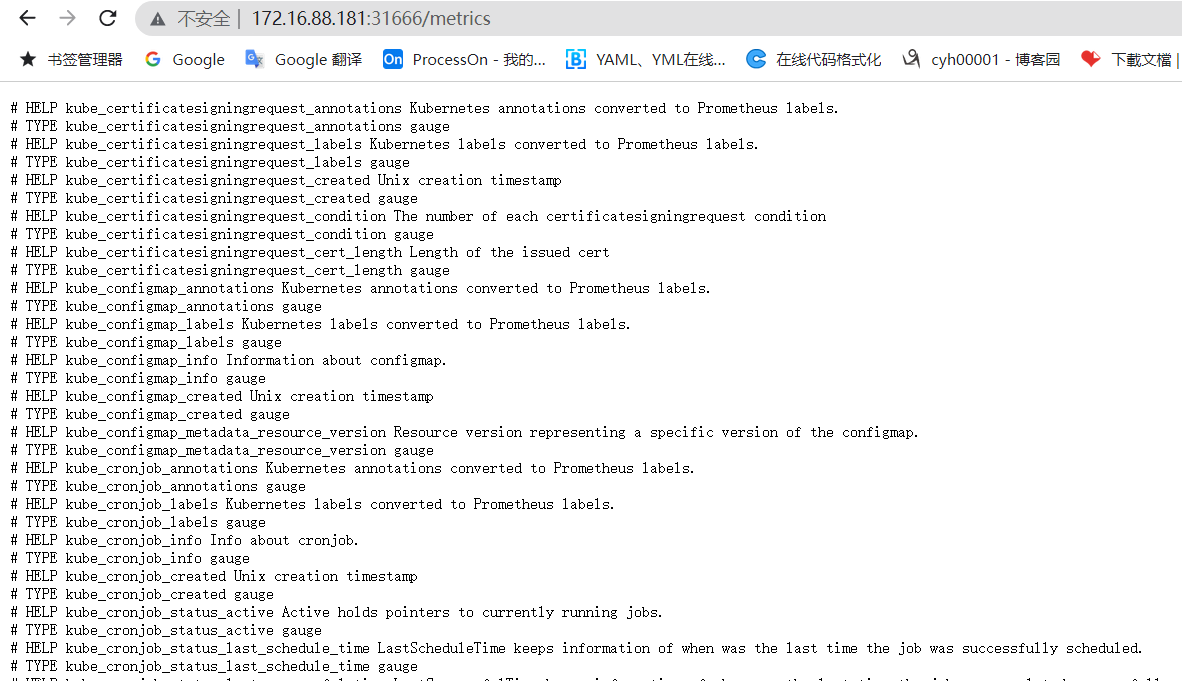
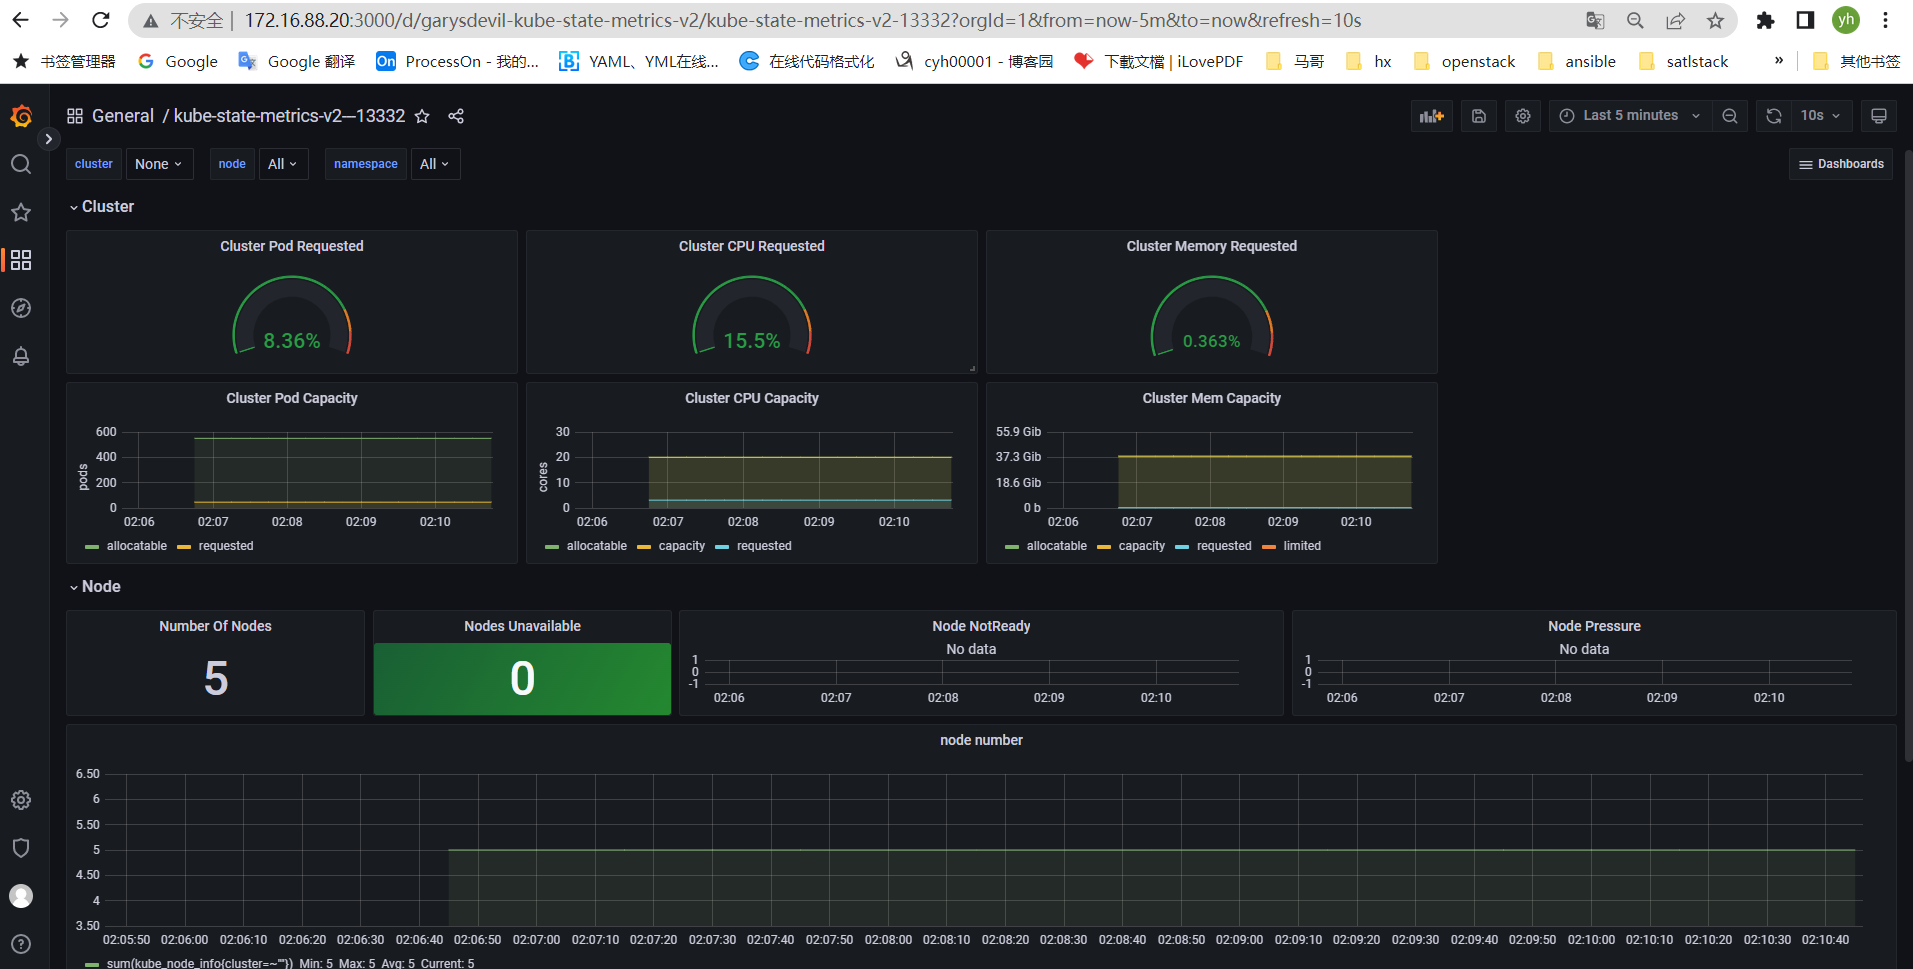
3.3、导入监控模板
四、监控台tomcat服务
4.1、准备tomcat文件
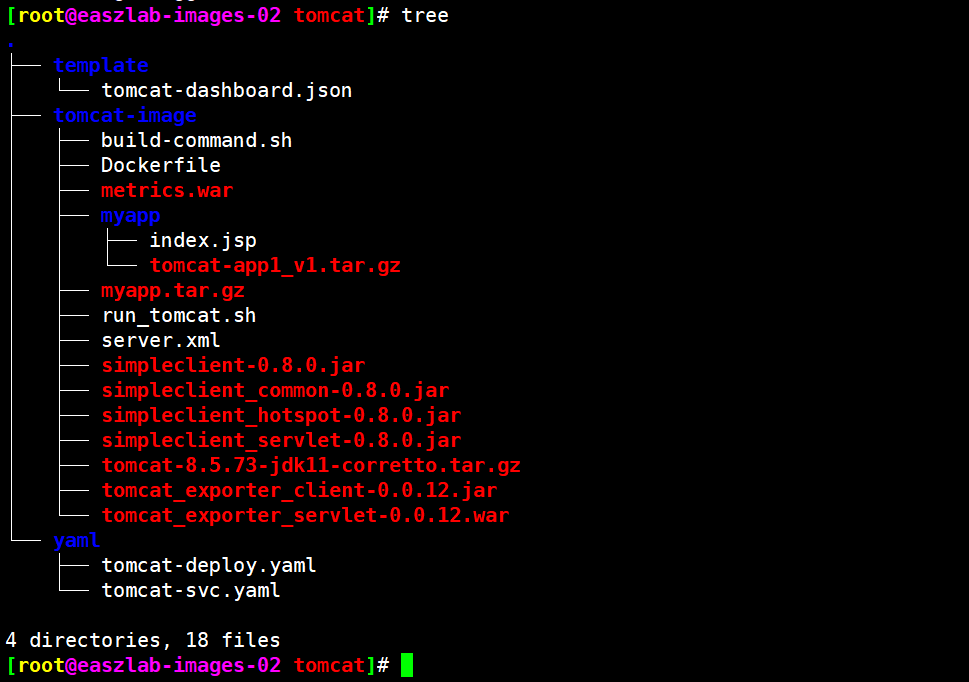
4.2、编写tomcat 镜像构建脚本
准备Dockerfile
FROM tomcat:8.5.73

ADD server.xml /usr/local/tomcat/conf/server.xml

RUN mkdir /data/tomcat/webapps -p
ADD myapp /data/tomcat/webapps/myapp
ADD metrics.war /data/tomcat/webapps
ADD simpleclient-0.8.0.jar  /usr/local/tomcat/lib/
ADD simpleclient_common-0.8.0.jar /usr/local/tomcat/lib/
ADD simpleclient_hotspot-0.8.0.jar /usr/local/tomcat/lib/
ADD simpleclient_servlet-0.8.0.jar /usr/local/tomcat/lib/
ADD tomcat_exporter_client-0.0.12.jar /usr/local/tomcat/lib/

EXPOSE 8080 8443 8009
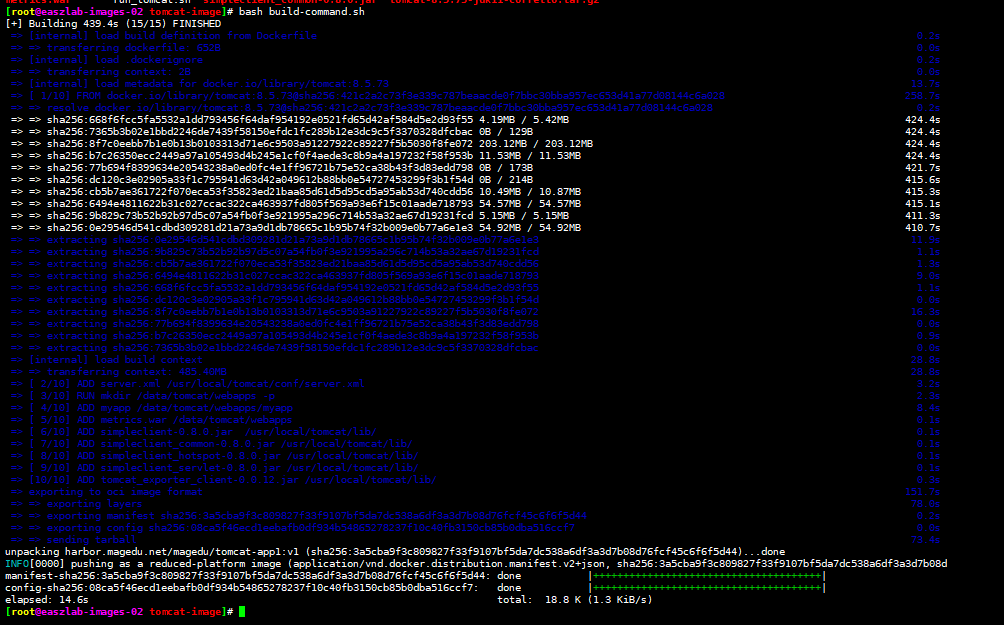
cat build-command.sh
#!/bin/bash
nerdctl build -t harbor.magedu.net/magedu/tomcat-app1:v1 .
nerdctl push harbor.magedu.net/magedu/tomcat-app1:v1
4.3、构建tomcat镜像并上传到自己的harbor仓库
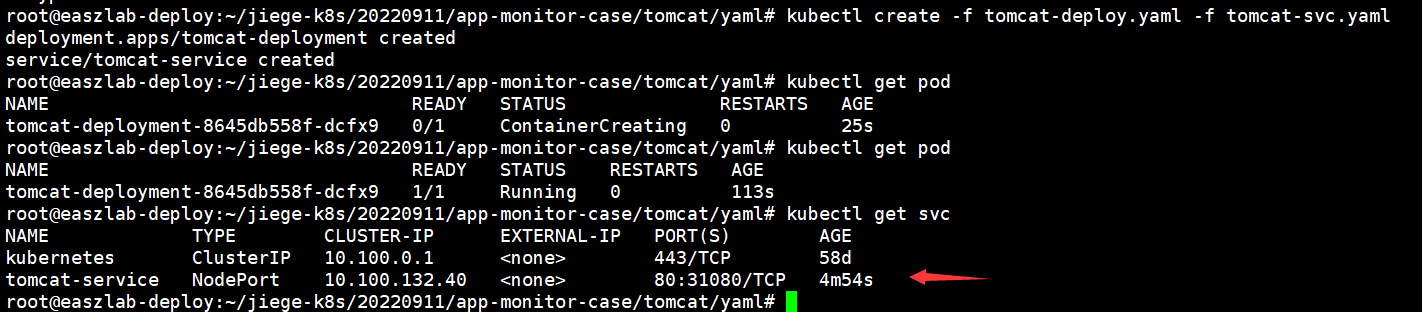
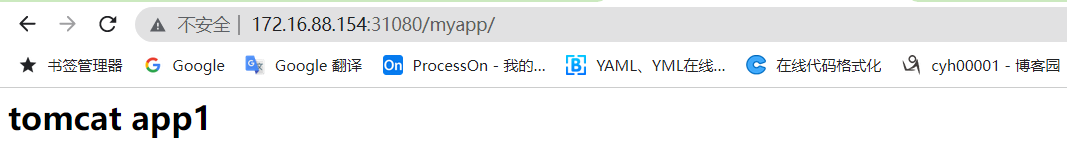
4.4、在k8s集群部署tomcat服务
cat tomcat-deploy.yaml
apiVersion: apps/v1
kind: Deployment
metadata:
  name: tomcat-deployment
  namespace: default
spec:
  selector:
    matchLabels:
     app: tomcat
  replicas: 1 # tells deployment to run 2 pods matching the template
  template: # create pods using pod definition in this template
    metadata:
      labels:
        app: tomcat
      annotations:
        prometheus.io/scrape: 'true'
    spec:
      containers:
      - name: tomcat
        image: harbor.magedu.net/magedu/tomcat-app1:v1
        imagePullPolicy: Always
        ports:
        - containerPort: 8080
        securityContext:
          privileged: true
cat tomcat-svc.yaml
kind: Service  #service 类型
apiVersion: v1
metadata:
  annotations:
    prometheus.io/scrape: 'true'
  name: tomcat-service
spec:
  selector:
    app: tomcat
  ports:
  - nodePort: 31080
    port: 80
    protocol: TCP
    targetPort: 8080
  type: NodePort
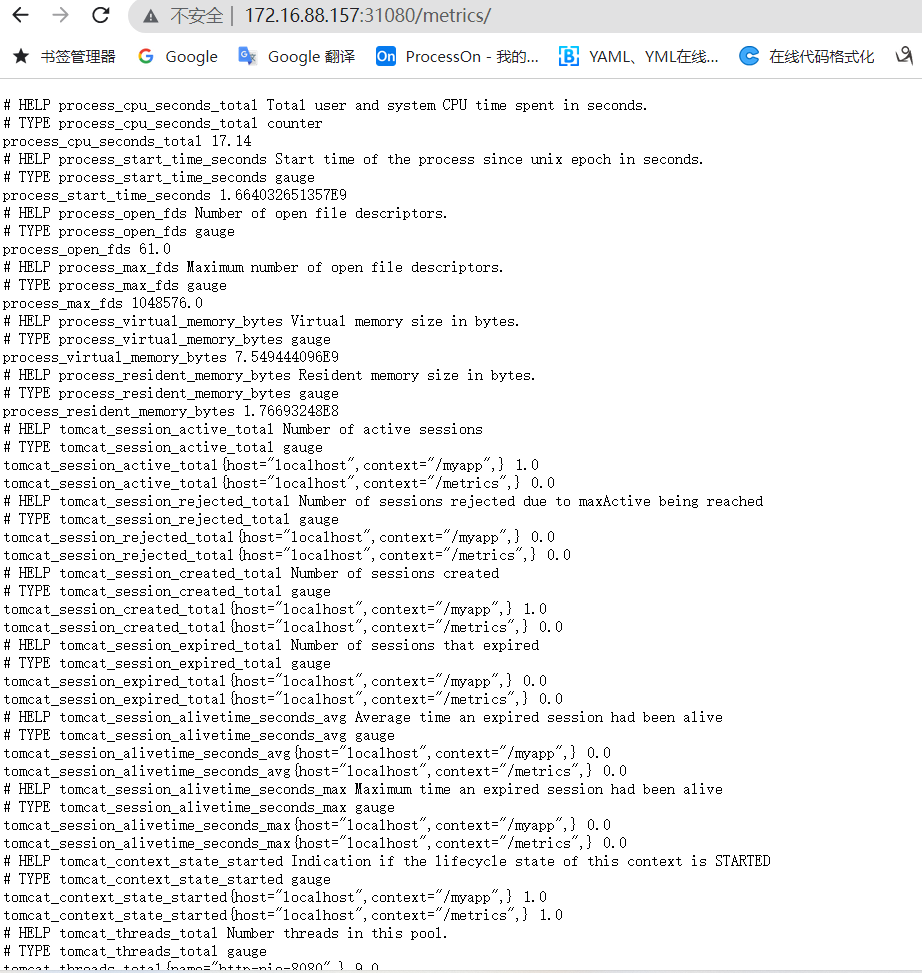
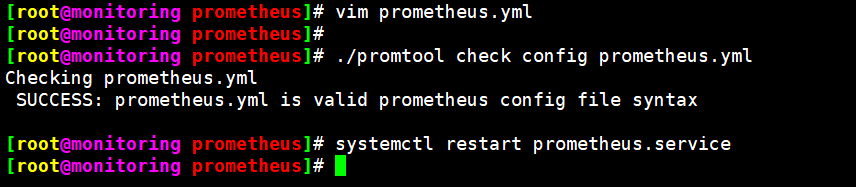
4.5、配置Prometheus并采集
vim prometheus.yml
#tomcat服务采集
  - job_name: "tomcat-monitor-metrics"
    static_configs:
      - targets: ["172.16.88.154:31080"]
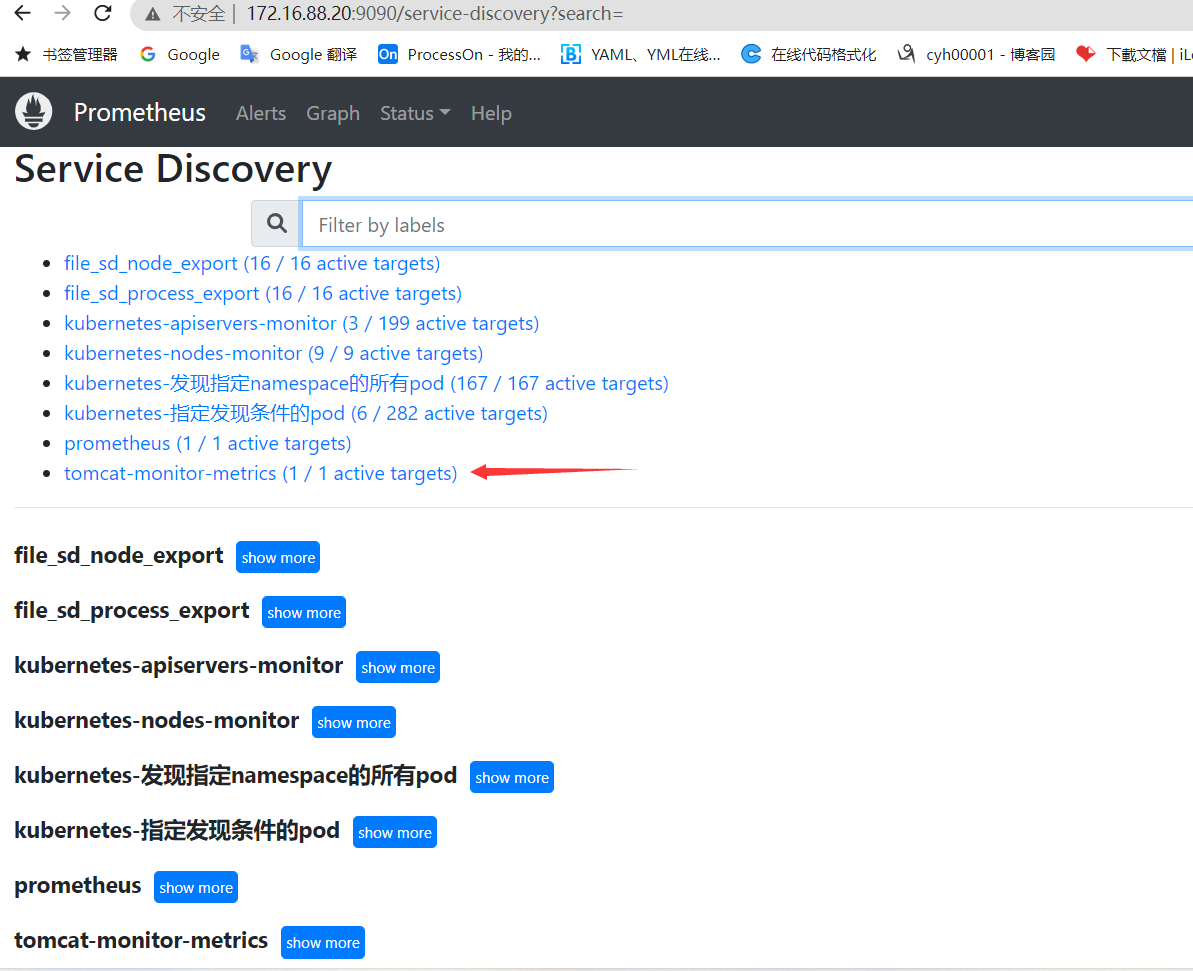
4.6、导入tomcat 监控模板
参考地址:https://github.com/nlighten/tomcat_exporter/tree/master/dashboard


{ "__inputs": [ { "name": "DS_PROMETHEUS", "label": "Prometheus", "description": "", "type": "datasource", "pluginId": "prometheus", "pluginName": "Prometheus" } ], "__requires": [ { "type": "grafana", "id": "grafana", "name": "Grafana", "version": "7.3.6" }, { "type": "panel", "id": "graph", "name": "Graph", "version": "" }, { "type": "panel", "id": "heatmap", "name": "Heatmap", "version": "" }, { "type": "datasource", "id": "prometheus", "name": "Prometheus", "version": "1.0.0" }, { "type": "panel", "id": "stat", "name": "Stat", "version": "" }, { "type": "panel", "id": "table", "name": "Table", "version": "" }, { "type": "panel", "id": "text", "name": "Text", "version": "" } ], "annotations": { "list": [ { "builtIn": 1, "datasource": "-- Grafana --", "enable": true, "hide": true, "iconColor": "rgba(0, 211, 255, 1)", "name": "Annotations & Alerts", "type": "dashboard" } ] }, "editable": true, "gnetId": null, "graphTooltip": 1, "id": null, "iteration": 1633634435078, "links": [], "panels": [ { "collapsed": false, "datasource": "${DS_PROMETHEUS}", "gridPos": { "h": 1, "w": 24, "x": 0, "y": 0 }, "id": 25, "panels": [], "title": "General Info", "type": "row" }, { "datasource": "${DS_PROMETHEUS}", "fieldConfig": { "defaults": { "custom": {}, "mappings": [ { "from": "-999999999999999", "id": 1, "text": "N/A", "to": "0", "type": 2, "value": "<0" } ], "thresholds": { "mode": "absolute", "steps": [ { "color": "green", "value": null } ] } }, "overrides": [] }, "gridPos": { "h": 3, "w": 3, "x": 0, "y": 1 }, "id": 51, "options": { "colorMode": "value", "graphMode": "area", "justifyMode": "auto", "orientation": "auto", "reduceOptions": { "calcs": [ "mean" ], "fields": "", "values": false }, "textMode": "name" }, "pluginVersion": "7.3.6", "targets": [ { "expr": "jvm_info{instance=\"$node\",job=\"$job\"}", "format": "time_series", "instant": true, "interval": "", "legendFormat": "{{vendor}}", "refId": "A" } ], "timeFrom": null, "timeShift": null, "title": "JVM Runtime Vendor", "type": "stat" }, { "datasource": "${DS_PROMETHEUS}", "fieldConfig": { "defaults": { "custom": {}, "mappings": [ { "from": "-999999999999999", "id": 1, "text": "N/A", "to": "0", "type": 2, "value": "<0" } ], "thresholds": { "mode": "absolute", "steps": [ { "color": "green", "value": null } ] } }, "overrides": [] }, "gridPos": { "h": 3, "w": 6, "x": 3, "y": 1 }, "id": 49, "options": { "colorMode": "value", "graphMode": "area", "justifyMode": "auto", "orientation": "auto", "reduceOptions": { "calcs": [ "mean" ], "fields": "", "values": false }, "textMode": "name" }, "pluginVersion": "7.3.6", "targets": [ { "expr": "jvm_info{instance=\"$node\",job=\"$job\"}", "format": "time_series", "instant": true, "interval": "", "legendFormat": "{{runtime}}", "refId": "A" } ], "timeFrom": null, "timeShift": null, "title": "JVM Runtime", "type": "stat" }, { "datasource": "${DS_PROMETHEUS}", "fieldConfig": { "defaults": { "custom": {}, "mappings": [ { "from": "-999999999999999", "id": 1, "text": "N/A", "to": "0", "type": 2, "value": "<0" } ], "thresholds": { "mode": "absolute", "steps": [ { "color": "green", "value": null } ] } }, "overrides": [] }, "gridPos": { "h": 3, "w": 3, "x": 9, "y": 1 }, "id": 50, "options": { "colorMode": "value", "graphMode": "area", "justifyMode": "auto", "orientation": "auto", "reduceOptions": { "calcs": [ "mean" ], "fields": "", "values": false }, "textMode": "name" }, "pluginVersion": "7.3.6", "targets": [ { "expr": "jvm_info{instance=\"$node\",job=\"$job\"}", "format": "time_series", "instant": true, "interval": "", "legendFormat": "{{version}}", "refId": "A" } ], "timeFrom": null, "timeShift": null, "title": "JVM Runtime Version", "type": "stat" }, { "datasource": "${DS_PROMETHEUS}", "fieldConfig": { "defaults": { "custom": {}, "mappings": [ { "from": "-999999999999999", "id": 1, "text": "N/A", "to": "0", "type": 2, "value": "<0" } ], "thresholds": { "mode": "absolute", "steps": [ { "color": "green", "value": null } ] } }, "overrides": [] }, "gridPos": { "h": 3, "w": 3, "x": 12, "y": 1 }, "id": 22, "options": { "colorMode": "value", "graphMode": "area", "justifyMode": "auto", "orientation": "auto", "reduceOptions": { "calcs": [ "mean" ], "fields": "", "values": false }, "textMode": "auto" }, "pluginVersion": "7.3.6", "targets": [ { "expr": "(time()-(process_start_time_seconds{instance=\"$node\",job=\"$job\"})) /60/60", "format": "table", "instant": true, "interval": "", "legendFormat": "", "refId": "A" } ], "timeFrom": null, "timeShift": null, "title": "JVM Uptime Hrs", "type": "stat" }, { "datasource": "${DS_PROMETHEUS}", "description": "The number of classes that are currently loaded in the JVM", "fieldConfig": { "defaults": { "custom": {}, "mappings": [ { "from": "-999999999999999", "id": 1, "text": "N/A", "to": "0", "type": 2, "value": "<0" } ], "thresholds": { "mode": "absolute", "steps": [ { "color": "green", "value": null } ] } }, "overrides": [] }, "gridPos": { "h": 3, "w": 3, "x": 15, "y": 1 }, "id": 46, "options": { "colorMode": "value", "graphMode": "area", "justifyMode": "auto", "orientation": "auto", "reduceOptions": { "calcs": [ "mean" ], "fields": "", "values": false }, "textMode": "auto" }, "pluginVersion": "7.3.6", "targets": [ { "expr": "jvm_classes_loaded{instance=\"$node\",job=\"$job\"}", "format": "table", "instant": true, "interval": "", "legendFormat": "", "refId": "A" } ], "timeFrom": null, "timeShift": null, "title": "JVM Classes Loaded", "type": "stat" }, { "aliasColors": {}, "bars": false, "dashLength": 10, "dashes": false, "datasource": "${DS_PROMETHEUS}", "description": "Indication if the lifecycle state of this context is STARTED", "fieldConfig": { "defaults": { "custom": {} }, "overrides": [] }, "fill": 1, "fillGradient": 0, "gridPos": { "h": 8, "w": 12, "x": 0, "y": 4 }, "hiddenSeries": false, "id": 34, "legend": { "avg": false, "current": false, "max": false, "min": false, "show": true, "total": false, "values": false }, "lines": true, "linewidth": 1, "nullPointMode": "null", "options": { "alertThreshold": true }, "percentage": false, "pluginVersion": "7.3.6", "pointradius": 2, "points": false, "renderer": "flot", "seriesOverrides": [], "spaceLength": 10, "stack": false, "steppedLine": false, "targets": [ { "expr": "tomcat_context_state_started{instance=\"$node\",job=\"$job\"}", "interval": "", "intervalFactor": 1, "legendFormat": "{{context}}", "refId": "A" } ], "thresholds": [], "timeFrom": null, "timeRegions": [], "timeShift": null, "title": "Application Contexts Started", "tooltip": { "shared": true, "sort": 0, "value_type": "individual" }, "type": "graph", "xaxis": { "buckets": null, "mode": "time", "name": null, "show": true, "values": [] }, "yaxes": [ { "format": "short", "label": null, "logBase": 1, "max": null, "min": null, "show": true }, { "format": "short", "label": null, "logBase": 1, "max": null, "min": null, "show": true } ], "yaxis": { "align": false, "alignLevel": null } }, { "aliasColors": {}, "bars": false, "dashLength": 10, "dashes": false, "datasource": "${DS_PROMETHEUS}", "description": "Count of JVM garbage collector runs", "fieldConfig": { "defaults": { "custom": {} }, "overrides": [] }, "fill": 1, "fillGradient": 0, "gridPos": { "h": 8, "w": 12, "x": 0, "y": 12 }, "hiddenSeries": false, "id": 47, "legend": { "avg": false, "current": false, "max": false, "min": false, "show": true, "total": false, "values": false }, "lines": true, "linewidth": 1, "nullPointMode": "null", "options": { "alertThreshold": true }, "percentage": false, "pluginVersion": "7.3.6", "pointradius": 2, "points": false, "renderer": "flot", "seriesOverrides": [], "spaceLength": 10, "stack": false, "steppedLine": false, "targets": [ { "expr": "rate(jvm_gc_collection_seconds_count{instance=\"$node\",job=\"$job\"}[1m])*100", "interval": "", "intervalFactor": 1, "legendFormat": "{{gc}}", "refId": "A" } ], "thresholds": [], "timeFrom": null, "timeRegions": [], "timeShift": null, "title": "Garbage Collection Runs /sec over 1 min", "tooltip": { "shared": true, "sort": 0, "value_type": "individual" }, "type": "graph", "xaxis": { "buckets": null, "mode": "time", "name": null, "show": true, "values": [] }, "yaxes": [ { "format": "short", "label": null, "logBase": 1, "max": null, "min": null, "show": true }, { "format": "short", "label": null, "logBase": 1, "max": null, "min": null, "show": true } ], "yaxis": { "align": false, "alignLevel": null } }, { "aliasColors": {}, "bars": false, "dashLength": 10, "dashes": false, "datasource": "${DS_PROMETHEUS}", "description": "Time spent in a given JVM garbage collector in seconds.", "fieldConfig": { "defaults": { "custom": {} }, "overrides": [] }, "fill": 1, "fillGradient": 0, "gridPos": { "h": 8, "w": 12, "x": 0, "y": 20 }, "hiddenSeries": false, "id": 48, "legend": { "avg": false, "current": false, "max": false, "min": false, "show": true, "total": false, "values": false }, "lines": true, "linewidth": 1, "nullPointMode": "null", "options": { "alertThreshold": true }, "percentage": false, "pluginVersion": "7.3.6", "pointradius": 2, "points": false, "renderer": "flot", "seriesOverrides": [], "spaceLength": 10, "stack": false, "steppedLine": false, "targets": [ { "expr": "rate(jvm_gc_collection_seconds_sum{instance=\"$node\",job=\"$job\"}[1m])*100", "interval": "", "intervalFactor": 1, "legendFormat": "{{gc}}", "refId": "A" } ], "thresholds": [], "timeFrom": null, "timeRegions": [], "timeShift": null, "title": "GC time in sec over 1 min", "tooltip": { "shared": true, "sort": 0, "value_type": "individual" }, "type": "graph", "xaxis": { "buckets": null, "mode": "time", "name": null, "show": true, "values": [] }, "yaxes": [ { "format": "short", "label": null, "logBase": 1, "max": null, "min": null, "show": true }, { "format": "short", "label": null, "logBase": 1, "max": null, "min": null, "show": true } ], "yaxis": { "align": false, "alignLevel": null } }, { "cards": { "cardPadding": null, "cardRound": null }, "color": { "cardColor": "#b4ff00", "colorScale": "sqrt", "colorScheme": "interpolateOranges", "exponent": 0.5, "mode": "spectrum" }, "dataFormat": "timeseries", "datasource": "${DS_PROMETHEUS}", "description": "JVM garbage run times", "fieldConfig": { "defaults": { "custom": { "align": null, "filterable": false }, "mappings": [], "thresholds": { "mode": "absolute", "steps": [ { "color": "green", "value": null }, { "color": "red", "value": 80 } ] } }, "overrides": [] }, "gridPos": { "h": 8, "w": 12, "x": 0, "y": 28 }, "heatmap": {}, "hideZeroBuckets": false, "highlightCards": true, "id": 52, "legend": { "show": false }, "pluginVersion": "7.3.6", "reverseYBuckets": false, "targets": [ { "expr": "(rate(jvm_gc_collection_seconds_sum{instance=\"$node\",job=\"$job\"}[1m])*100 / rate(jvm_gc_collection_seconds_count{instance=\"$node\",job=\"$job\"}[1m])*100)", "instant": false, "interval": "", "intervalFactor": 1, "legendFormat": "{{gc}}", "refId": "A" } ], "timeFrom": null, "timeShift": null, "title": "Avg Time (ms) / GC 1 minute rate", "tooltip": { "show": true, "showHistogram": false }, "type": "heatmap", "xAxis": { "show": true }, "xBucketNumber": null, "xBucketSize": null, "yAxis": { "decimals": null, "format": "short", "logBase": 1, "max": null, "min": null, "show": true, "splitFactor": null }, "yBucketBound": "auto", "yBucketNumber": null, "yBucketSize": null }, { "collapsed": true, "datasource": "${DS_PROMETHEUS}", "gridPos": { "h": 1, "w": 24, "x": 0, "y": 36 }, "id": 5, "panels": [ { "datasource": "${DS_PROMETHEUS}", "description": "Started thread count of a JVM", "fieldConfig": { "defaults": { "custom": {}, "mappings": [ { "from": "-999999999999999", "id": 1, "text": "N/A", "to": "0", "type": 2, "value": "<0" } ], "thresholds": { "mode": "absolute", "steps": [ { "color": "green", "value": null } ] } }, "overrides": [] }, "gridPos": { "h": 4, "w": 3, "x": 0, "y": 37 }, "id": 18, "options": { "colorMode": "value", "graphMode": "area", "justifyMode": "auto", "orientation": "auto", "reduceOptions": { "calcs": [ "mean" ], "fields": "", "values": false }, "textMode": "auto" }, "pluginVersion": "7.3.6", "targets": [ { "expr": "jvm_threads_started_total{instance=\"$node\",job=\"$job\"}", "format": "table", "instant": true, "interval": "", "legendFormat": "", "refId": "A" } ], "timeFrom": null, "timeShift": null, "title": "JVM Threads Started Total", "type": "stat" }, { "datasource": "${DS_PROMETHEUS}", "description": "Current thread count of a JVM", "fieldConfig": { "defaults": { "custom": {}, "mappings": [ { "from": "-999999999999999", "id": 1, "text": "N/A", "to": "0", "type": 2, "value": "<0" } ], "thresholds": { "mode": "absolute", "steps": [ { "color": "green", "value": null } ] } }, "overrides": [] }, "gridPos": { "h": 4, "w": 3, "x": 3, "y": 37 }, "id": 20, "options": { "colorMode": "value", "graphMode": "area", "justifyMode": "auto", "orientation": "auto", "reduceOptions": { "calcs": [ "mean" ], "fields": "", "values": false }, "textMode": "auto" }, "pluginVersion": "7.3.6", "targets": [ { "expr": "jvm_threads_current{instance=\"$node\",job=\"$job\"}", "format": "table", "instant": true, "interval": "", "legendFormat": "", "refId": "A" } ], "timeFrom": null, "timeShift": null, "title": "JVM Threads Current", "type": "stat" }, { "datasource": "${DS_PROMETHEUS}", "description": "Peak thread count of a JVM", "fieldConfig": { "defaults": { "custom": {}, "mappings": [ { "from": "-999999999999999", "id": 1, "text": "N/A", "to": "0", "type": 2, "value": "<0" } ], "thresholds": { "mode": "absolute", "steps": [ { "color": "green", "value": null } ] } }, "overrides": [] }, "gridPos": { "h": 4, "w": 3, "x": 6, "y": 37 }, "id": 19, "options": { "colorMode": "value", "graphMode": "area", "justifyMode": "auto", "orientation": "auto", "reduceOptions": { "calcs": [ "mean" ], "fields": "", "values": false }, "textMode": "auto" }, "pluginVersion": "7.3.6", "targets": [ { "expr": "jvm_threads_peak{instance=\"$node\",job=\"$job\"}", "format": "table", "instant": true, "interval": "", "legendFormat": "", "refId": "A" } ], "timeFrom": null, "timeShift": null, "title": "JVM Threads Peak", "type": "stat" }, { "datasource": "${DS_PROMETHEUS}", "description": "Cycles of JVM-threads that are in deadlock waiting to acquire object monitors or ownable synchronizers", "fieldConfig": { "defaults": { "custom": {}, "mappings": [ { "from": "-999999999999999", "id": 1, "text": "N/A", "to": "0", "type": 2, "value": "<0" } ], "thresholds": { "mode": "absolute", "steps": [ { "color": "green", "value": null } ] } }, "overrides": [] }, "gridPos": { "h": 4, "w": 3, "x": 9, "y": 37 }, "id": 21, "options": { "colorMode": "value", "graphMode": "area", "justifyMode": "auto", "orientation": "auto", "reduceOptions": { "calcs": [ "mean" ], "fields": "", "values": false }, "textMode": "auto" }, "pluginVersion": "7.3.6", "targets": [ { "expr": "jvm_threads_deadlocked{instance=\"$node\",job=\"$job\"}", "format": "table", "instant": true, "interval": "", "legendFormat": "", "refId": "A" } ], "timeFrom": null, "timeShift": null, "title": "JVM Threads Deadlocked", "type": "stat" }, { "aliasColors": {}, "bars": false, "dashLength": 10, "dashes": false, "datasource": "${DS_PROMETHEUS}", "description": "Current count of threads by state", "fieldConfig": { "defaults": { "custom": {} }, "overrides": [] }, "fill": 1, "fillGradient": 0, "gridPos": { "h": 8, "w": 12, "x": 0, "y": 41 }, "hiddenSeries": false, "id": 2, "legend": { "avg": false, "current": false, "max": false, "min": false, "show": true, "total": false, "values": false }, "lines": true, "linewidth": 1, "nullPointMode": "null", "options": { "alertThreshold": true }, "percentage": false, "pluginVersion": "7.3.6", "pointradius": 2, "points": false, "renderer": "flot", "seriesOverrides": [], "spaceLength": 10, "stack": false, "steppedLine": false, "targets": [ { "expr": "jvm_threads_state{instance=\"$node\",job=\"$job\"}", "interval": "", "intervalFactor": 1, "legendFormat": "{{state}}", "refId": "A" } ], "thresholds": [], "timeFrom": null, "timeRegions": [], "timeShift": null, "title": "Thread State", "tooltip": { "shared": true, "sort": 0, "value_type": "individual" }, "type": "graph", "xaxis": { "buckets": null, "mode": "time", "name": null, "show": true, "values": [] }, "yaxes": [ { "format": "short", "label": null, "logBase": 1, "max": null, "min": null, "show": true }, { "format": "short", "label": null, "logBase": 1, "max": null, "min": null, "show": true } ], "yaxis": { "align": false, "alignLevel": null } } ], "title": "Threads", "type": "row" }, { "collapsed": true, "datasource": "${DS_PROMETHEUS}", "gridPos": { "h": 1, "w": 24, "x": 0, "y": 37 }, "id": 7, "panels": [ { "datasource": "${DS_PROMETHEUS}", "description": "Max (bytes) of a given JVM memory area.", "fieldConfig": { "defaults": { "custom": {}, "mappings": [ { "from": "-99999999999999", "id": 1, "text": "N/A", "to": "0", "type": 2 } ], "thresholds": { "mode": "absolute", "steps": [ { "color": "green", "value": null } ] } }, "overrides": [] }, "gridPos": { "h": 4, "w": 3, "x": 0, "y": 38 }, "id": 10, "options": { "colorMode": "value", "graphMode": "area", "justifyMode": "auto", "orientation": "auto", "reduceOptions": { "calcs": [ "mean" ], "fields": "", "values": false }, "textMode": "auto" }, "pluginVersion": "7.3.6", "targets": [ { "expr": "jvm_memory_bytes_max{instance=\"$node\",job=\"$job\",area=\"heap\"} /1024/1024", "format": "table", "instant": true, "interval": "", "legendFormat": "", "refId": "A" } ], "timeFrom": null, "timeShift": null, "title": "Heap Max (MB)", "type": "stat" }, { "datasource": "${DS_PROMETHEUS}", "description": "Max (bytes) of a given JVM memory area.", "fieldConfig": { "defaults": { "custom": {}, "mappings": [ { "from": "-999999999999999", "id": 1, "text": "N/A", "to": "0", "type": 2, "value": "<0" } ], "thresholds": { "mode": "absolute", "steps": [ { "color": "green", "value": null } ] } }, "overrides": [] }, "gridPos": { "h": 4, "w": 3, "x": 3, "y": 38 }, "id": 11, "options": { "colorMode": "value", "graphMode": "area", "justifyMode": "auto", "orientation": "auto", "reduceOptions": { "calcs": [ "mean" ], "fields": "", "values": false }, "textMode": "auto" }, "pluginVersion": "7.3.6", "targets": [ { "expr": "jvm_memory_bytes_max{instance=\"$node\",job=\"$job\",area=\"nonheap\"} /1024/1024", "format": "table", "instant": true, "interval": "", "legendFormat": "", "refId": "A" } ], "timeFrom": null, "timeShift": null, "title": "NonHeap Max (MB)", "type": "stat" }, { "datasource": "${DS_PROMETHEUS}", "fieldConfig": { "defaults": { "custom": {} }, "overrides": [] }, "gridPos": { "h": 1, "w": 20, "x": 0, "y": 42 }, "id": 13, "options": { "content": "", "mode": "markdown" }, "pluginVersion": "7.3.6", "timeFrom": null, "timeShift": null, "title": "Total JVM Memory", "type": "text" }, { "aliasColors": {}, "bars": false, "dashLength": 10, "dashes": false, "datasource": "${DS_PROMETHEUS}", "description": "Committed (bytes) of a given JVM memory area.", "fieldConfig": { "defaults": { "custom": {} }, "overrides": [] }, "fill": 1, "fillGradient": 0, "gridPos": { "h": 8, "w": 10, "x": 0, "y": 43 }, "hiddenSeries": false, "id": 8, "legend": { "avg": false, "current": false, "max": false, "min": false, "show": true, "total": false, "values": false }, "lines": true, "linewidth": 1, "nullPointMode": "null", "options": { "alertThreshold": true }, "percentage": false, "pluginVersion": "7.3.6", "pointradius": 2, "points": false, "renderer": "flot", "seriesOverrides": [], "spaceLength": 10, "stack": false, "steppedLine": false, "targets": [ { "expr": "jvm_memory_bytes_committed{instance=\"$node\",job=\"$job\"} /1024/1024", "interval": "", "intervalFactor": 1, "legendFormat": "{{area}}", "refId": "A" } ], "thresholds": [], "timeFrom": null, "timeRegions": [], "timeShift": null, "title": "JVM Total Memory Committed (MB)", "tooltip": { "shared": true, "sort": 0, "value_type": "individual" }, "type": "graph", "xaxis": { "buckets": null, "mode": "time", "name": null, "show": true, "values": [] }, "yaxes": [ { "format": "short", "label": null, "logBase": 1, "max": null, "min": null, "show": true }, { "format": "short", "label": null, "logBase": 1, "max": null, "min": null, "show": true } ], "yaxis": { "align": false, "alignLevel": null } }, { "aliasColors": {}, "bars": false, "dashLength": 10, "dashes": false, "datasource": "${DS_PROMETHEUS}", "description": "Used bytes of a given JVM memory area.", "fieldConfig": { "defaults": { "custom": {} }, "overrides": [] }, "fill": 1, "fillGradient": 0, "gridPos": { "h": 8, "w": 10, "x": 10, "y": 43 }, "hiddenSeries": false, "id": 3, "legend": { "avg": false, "current": false, "max": false, "min": false, "show": true, "total": false, "values": false }, "lines": true, "linewidth": 1, "nullPointMode": "null", "options": { "alertThreshold": true }, "percentage": false, "pluginVersion": "7.3.6", "pointradius": 2, "points": false, "renderer": "flot", "seriesOverrides": [], "spaceLength": 10, "stack": false, "steppedLine": false, "targets": [ { "expr": "jvm_memory_bytes_used{instance=\"$node\",job=\"$job\"} /1024/1024", "interval": "", "intervalFactor": 1, "legendFormat": "{{area}}", "refId": "A" } ], "thresholds": [], "timeFrom": null, "timeRegions": [], "timeShift": null, "title": "JVM Total Memory Used (MB)", "tooltip": { "shared": true, "sort": 0, "value_type": "individual" }, "type": "graph", "xaxis": { "buckets": null, "mode": "time", "name": null, "show": true, "values": [] }, "yaxes": [ { "format": "short", "label": null, "logBase": 1, "max": null, "min": null, "show": true }, { "format": "short", "label": null, "logBase": 1, "max": null, "min": null, "show": true } ], "yaxis": { "align": false, "alignLevel": null } }, { "datasource": "${DS_PROMETHEUS}", "fieldConfig": { "defaults": { "custom": {} }, "overrides": [] }, "gridPos": { "h": 1, "w": 20, "x": 0, "y": 51 }, "id": 14, "options": { "content": "", "mode": "markdown" }, "pluginVersion": "7.3.6", "timeFrom": null, "timeShift": null, "title": "JVM Memory Pool", "type": "text" }, { "aliasColors": {}, "bars": false, "dashLength": 10, "dashes": false, "datasource": "${DS_PROMETHEUS}", "description": "Committed bytes of a given JVM memory pool.", "fieldConfig": { "defaults": { "custom": {} }, "overrides": [] }, "fill": 1, "fillGradient": 0, "gridPos": { "h": 8, "w": 10, "x": 0, "y": 52 }, "hiddenSeries": false, "id": 15, "legend": { "avg": false, "current": false, "max": false, "min": false, "show": true, "total": false, "values": false }, "lines": true, "linewidth": 1, "nullPointMode": "null", "options": { "alertThreshold": true }, "percentage": false, "pluginVersion": "7.3.6", "pointradius": 2, "points": false, "renderer": "flot", "seriesOverrides": [], "spaceLength": 10, "stack": false, "steppedLine": false, "targets": [ { "expr": "jvm_memory_pool_bytes_committed{instance=\"$node\",job=\"$job\"} /1024/1024", "interval": "", "intervalFactor": 1, "legendFormat": "{{pool}}", "refId": "A" } ], "thresholds": [], "timeFrom": null, "timeRegions": [], "timeShift": null, "title": "JVM Memory Pool Committed (MB)", "tooltip": { "shared": true, "sort": 0, "value_type": "individual" }, "type": "graph", "xaxis": { "buckets": null, "mode": "time", "name": null, "show": true, "values": [] }, "yaxes": [ { "format": "short", "label": null, "logBase": 1, "max": null, "min": null, "show": true }, { "format": "short", "label": null, "logBase": 1, "max": null, "min": null, "show": true } ], "yaxis": { "align": false, "alignLevel": null } }, { "aliasColors": {}, "bars": false, "dashLength": 10, "dashes": false, "datasource": "${DS_PROMETHEUS}", "description": "Used bytes of a given JVM memory pool.", "fieldConfig": { "defaults": { "custom": {} }, "overrides": [] }, "fill": 1, "fillGradient": 0, "gridPos": { "h": 8, "w": 10, "x": 10, "y": 52 }, "hiddenSeries": false, "id": 16, "legend": { "avg": false, "current": false, "max": false, "min": false, "show": true, "total": false, "values": false }, "lines": true, "linewidth": 1, "nullPointMode": "null", "options": { "alertThreshold": true }, "percentage": false, "pluginVersion": "7.3.6", "pointradius": 2, "points": false, "renderer": "flot", "seriesOverrides": [], "spaceLength": 10, "stack": false, "steppedLine": false, "targets": [ { "expr": "jvm_memory_pool_bytes_used{instance=\"$node\",job=\"$job\"} /1024/1024", "interval": "", "intervalFactor": 1, "legendFormat": "{{pool}}", "refId": "A" } ], "thresholds": [], "timeFrom": null, "timeRegions": [], "timeShift": null, "title": "JVM Memory Pool Used (MB)", "tooltip": { "shared": true, "sort": 0, "value_type": "individual" }, "type": "graph", "xaxis": { "buckets": null, "mode": "time", "name": null, "show": true, "values": [] }, "yaxes": [ { "format": "short", "label": null, "logBase": 1, "max": null, "min": null, "show": true }, { "format": "short", "label": null, "logBase": 1, "max": null, "min": null, "show": true } ], "yaxis": { "align": false, "alignLevel": null } }, { "aliasColors": {}, "bars": false, "dashLength": 10, "dashes": false, "datasource": "${DS_PROMETHEUS}", "description": "Max bytes of a given JVM memory pool.\n", "fieldConfig": { "defaults": { "custom": {} }, "overrides": [] }, "fill": 1, "fillGradient": 0, "gridPos": { "h": 8, "w": 10, "x": 0, "y": 60 }, "hiddenSeries": false, "id": 17, "legend": { "avg": false, "current": false, "max": false, "min": false, "show": true, "total": false, "values": false }, "lines": true, "linewidth": 1, "nullPointMode": "null", "options": { "alertThreshold": true }, "percentage": false, "pluginVersion": "7.3.6", "pointradius": 2, "points": false, "renderer": "flot", "seriesOverrides": [], "spaceLength": 10, "stack": false, "steppedLine": false, "targets": [ { "expr": "jvm_memory_pool_bytes_max{instance=\"$node\",job=\"$job\"} /1024/1024", "interval": "", "intervalFactor": 1, "legendFormat": "{{pool}}", "refId": "A" } ], "thresholds": [], "timeFrom": null, "timeRegions": [], "timeShift": null, "title": "JVM Memory Pool Max (MB)", "tooltip": { "shared": true, "sort": 0, "value_type": "individual" }, "type": "graph", "xaxis": { "buckets": null, "mode": "time", "name": null, "show": true, "values": [] }, "yaxes": [ { "format": "short", "label": null, "logBase": 1, "max": null, "min": null, "show": true }, { "format": "short", "label": null, "logBase": 1, "max": null, "min": null, "show": true } ], "yaxis": { "align": false, "alignLevel": null } } ], "title": "JVM Memory", "type": "row" }, { "collapsed": false, "datasource": "${DS_PROMETHEUS}", "gridPos": { "h": 1, "w": 24, "x": 0, "y": 38 }, "id": 54, "panels": [], "title": "Servlet Responses (if enabled)", "type": "row" }, { "aliasColors": {}, "bars": false, "dashLength": 10, "dashes": false, "datasource": "${DS_PROMETHEUS}", "description": "Number of requests for given context and status code", "fieldConfig": { "defaults": { "custom": {} }, "overrides": [] }, "fill": 1, "fillGradient": 0, "gridPos": { "h": 8, "w": 12, "x": 0, "y": 39 }, "hiddenSeries": false, "id": 56, "legend": { "avg": false, "current": false, "max": false, "min": false, "show": true, "total": false, "values": false }, "lines": true, "linewidth": 1, "nullPointMode": "null", "options": { "alertThreshold": true }, "percentage": false, "pluginVersion": "7.3.6", "pointradius": 2, "points": false, "renderer": "flot", "seriesOverrides": [], "spaceLength": 10, "stack": false, "steppedLine": false, "targets": [ { "expr": "rate(servlet_response_status_total{instance=\"$node\",job=\"$job\"}[5m])", "interval": "", "legendFormat": "{{context}} HTTP {{status}}", "refId": "A" } ], "thresholds": [], "timeFrom": null, "timeRegions": [], "timeShift": null, "title": "Servlet Response Status /s over 5 min", "tooltip": { "shared": true, "sort": 0, "value_type": "individual" }, "type": "graph", "xaxis": { "buckets": null, "mode": "time", "name": null, "show": true, "values": [] }, "yaxes": [ { "format": "short", "label": null, "logBase": 1, "max": null, "min": null, "show": true }, { "format": "short", "label": null, "logBase": 1, "max": null, "min": null, "show": true } ], "yaxis": { "align": false, "alignLevel": null } }, { "collapsed": true, "datasource": "${DS_PROMETHEUS}", "gridPos": { "h": 1, "w": 24, "x": 0, "y": 47 }, "id": 27, "panels": [ { "aliasColors": {}, "bars": false, "dashLength": 10, "dashes": false, "datasource": "${DS_PROMETHEUS}", "description": "Number of sessions created", "fieldConfig": { "defaults": { "custom": {} }, "overrides": [] }, "fill": 1, "fillGradient": 0, "gridPos": { "h": 8, "w": 10, "x": 0, "y": 40 }, "hiddenSeries": false, "id": 28, "legend": { "avg": false, "current": false, "max": false, "min": false, "show": true, "total": false, "values": false }, "lines": true, "linewidth": 1, "nullPointMode": "null", "options": { "alertThreshold": true }, "percentage": false, "pluginVersion": "7.3.6", "pointradius": 2, "points": false, "renderer": "flot", "seriesOverrides": [], "spaceLength": 10, "stack": false, "steppedLine": false, "targets": [ { "expr": "rate(tomcat_session_created_total{instance=\"$node\",job=\"$job\"}[1m])*100", "interval": "", "intervalFactor": 1, "legendFormat": "{{context}}", "refId": "A" } ], "thresholds": [], "timeFrom": null, "timeRegions": [], "timeShift": null, "title": "Sessions Created Total /sec over 1 min", "tooltip": { "shared": true, "sort": 0, "value_type": "individual" }, "type": "graph", "xaxis": { "buckets": null, "mode": "time", "name": null, "show": true, "values": [] }, "yaxes": [ { "format": "short", "label": null, "logBase": 1, "max": null, "min": null, "show": true }, { "format": "short", "label": null, "logBase": 1, "max": null, "min": null, "show": true } ], "yaxis": { "align": false, "alignLevel": null } }, { "aliasColors": {}, "bars": false, "dashLength": 10, "dashes": false, "datasource": "${DS_PROMETHEUS}", "description": "Number of active sessions", "fieldConfig": { "defaults": { "custom": {} }, "overrides": [] }, "fill": 1, "fillGradient": 0, "gridPos": { "h": 8, "w": 10, "x": 10, "y": 40 }, "hiddenSeries": false, "id": 31, "legend": { "avg": false, "current": false, "max": false, "min": false, "show": true, "total": false, "values": false }, "lines": true, "linewidth": 1, "nullPointMode": "null", "options": { "alertThreshold": true }, "percentage": false, "pluginVersion": "7.3.6", "pointradius": 2, "points": false, "renderer": "flot", "seriesOverrides": [], "spaceLength": 10, "stack": false, "steppedLine": false, "targets": [ { "expr": "rate(tomcat_session_active_total{instance=\"$node\",job=\"$job\"}[1m])*100", "interval": "", "intervalFactor": 1, "legendFormat": "{{context}}", "refId": "A" } ], "thresholds": [], "timeFrom": null, "timeRegions": [], "timeShift": null, "title": "Sessions Active Total /sec over 1 min", "tooltip": { "shared": true, "sort": 0, "value_type": "individual" }, "type": "graph", "xaxis": { "buckets": null, "mode": "time", "name": null, "show": true, "values": [] }, "yaxes": [ { "format": "short", "label": null, "logBase": 1, "max": null, "min": null, "show": true }, { "format": "short", "label": null, "logBase": 1, "max": null, "min": null, "show": true } ], "yaxis": { "align": false, "alignLevel": null } }, { "aliasColors": {}, "bars": false, "dashLength": 10, "dashes": false, "datasource": "${DS_PROMETHEUS}", "description": "Number of sessions rejected due to maxActive being reached", "fieldConfig": { "defaults": { "custom": {} }, "overrides": [] }, "fill": 1, "fillGradient": 0, "gridPos": { "h": 8, "w": 10, "x": 0, "y": 48 }, "hiddenSeries": false, "id": 30, "legend": { "avg": false, "current": false, "max": false, "min": false, "show": true, "total": false, "values": false }, "lines": true, "linewidth": 1, "nullPointMode": "null", "options": { "alertThreshold": true }, "percentage": false, "pluginVersion": "7.3.6", "pointradius": 2, "points": false, "renderer": "flot", "seriesOverrides": [], "spaceLength": 10, "stack": false, "steppedLine": false, "targets": [ { "expr": "rate(tomcat_session_rejected_total{instance=\"$node\",job=\"$job\"}[1m]) *100", "interval": "", "intervalFactor": 1, "legendFormat": "{{context}}", "refId": "A" } ], "thresholds": [], "timeFrom": null, "timeRegions": [], "timeShift": null, "title": "Sessions Rejected Total /sec over 1 min", "tooltip": { "shared": true, "sort": 0, "value_type": "individual" }, "type": "graph", "xaxis": { "buckets": null, "mode": "time", "name": null, "show": true, "values": [] }, "yaxes": [ { "format": "short", "label": null, "logBase": 1, "max": null, "min": null, "show": true }, { "format": "short", "label": null, "logBase": 1, "max": null, "min": null, "show": true } ], "yaxis": { "align": false, "alignLevel": null } }, { "aliasColors": {}, "bars": false, "dashLength": 10, "dashes": false, "datasource": "${DS_PROMETHEUS}", "description": "Number of sessions that expired", "fieldConfig": { "defaults": { "custom": {} }, "overrides": [] }, "fill": 1, "fillGradient": 0, "gridPos": { "h": 8, "w": 10, "x": 10, "y": 48 }, "hiddenSeries": false, "id": 29, "legend": { "avg": false, "current": false, "max": false, "min": false, "show": true, "total": false, "values": false }, "lines": true, "linewidth": 1, "nullPointMode": "null", "options": { "alertThreshold": true }, "percentage": false, "pluginVersion": "7.3.6", "pointradius": 2, "points": false, "renderer": "flot", "seriesOverrides": [], "spaceLength": 10, "stack": false, "steppedLine": false, "targets": [ { "expr": "rate(tomcat_session_expired_total{instance=\"$node\",job=\"$job\"}[1m])*100", "interval": "", "intervalFactor": 1, "legendFormat": "{{context}}", "refId": "A" } ], "thresholds": [], "timeFrom": null, "timeRegions": [], "timeShift": null, "title": "Sessions Expired Total /sec over 1 min", "tooltip": { "shared": true, "sort": 0, "value_type": "individual" }, "type": "graph", "xaxis": { "buckets": null, "mode": "time", "name": null, "show": true, "values": [] }, "yaxes": [ { "format": "short", "label": null, "logBase": 1, "max": null, "min": null, "show": true }, { "format": "short", "label": null, "logBase": 1, "max": null, "min": null, "show": true } ], "yaxis": { "align": false, "alignLevel": null } }, { "aliasColors": {}, "bars": false, "dashLength": 10, "dashes": false, "datasource": "${DS_PROMETHEUS}", "description": "Maximum time an expired session had been alive", "fieldConfig": { "defaults": { "custom": {} }, "overrides": [] }, "fill": 1, "fillGradient": 0, "gridPos": { "h": 8, "w": 10, "x": 0, "y": 56 }, "hiddenSeries": false, "id": 32, "legend": { "avg": false, "current": false, "max": false, "min": false, "show": true, "total": false, "values": false }, "lines": true, "linewidth": 1, "nullPointMode": "null", "options": { "alertThreshold": true }, "percentage": false, "pluginVersion": "7.3.6", "pointradius": 2, "points": false, "renderer": "flot", "seriesOverrides": [], "spaceLength": 10, "stack": false, "steppedLine": false, "targets": [ { "expr": "rate(tomcat_session_alivetime_seconds_max{instance=\"$node\",job=\"$job\"}[5m])", "interval": "", "intervalFactor": 1, "legendFormat": "{{context}}", "refId": "A" } ], "thresholds": [], "timeFrom": null, "timeRegions": [], "timeShift": null, "title": "Sessions Alive Time Max over 5 min (in seconds)", "tooltip": { "shared": true, "sort": 0, "value_type": "individual" }, "type": "graph", "xaxis": { "buckets": null, "mode": "time", "name": null, "show": true, "values": [] }, "yaxes": [ { "format": "short", "label": null, "logBase": 1, "max": null, "min": null, "show": true }, { "format": "short", "label": null, "logBase": 1, "max": null, "min": null, "show": true } ], "yaxis": { "align": false, "alignLevel": null } }, { "aliasColors": {}, "bars": false, "dashLength": 10, "dashes": false, "datasource": "${DS_PROMETHEUS}", "description": "Average time an expired session had been alive", "fieldConfig": { "defaults": { "custom": {} }, "overrides": [] }, "fill": 1, "fillGradient": 0, "gridPos": { "h": 8, "w": 10, "x": 10, "y": 56 }, "hiddenSeries": false, "id": 33, "legend": { "avg": false, "current": false, "max": false, "min": false, "show": true, "total": false, "values": false }, "lines": true, "linewidth": 1, "nullPointMode": "null", "options": { "alertThreshold": true }, "percentage": false, "pluginVersion": "7.3.6", "pointradius": 2, "points": false, "renderer": "flot", "seriesOverrides": [], "spaceLength": 10, "stack": false, "steppedLine": false, "targets": [ { "expr": "rate(tomcat_session_alivetime_seconds_avg{instance=\"$node\",job=\"$job\"}[5m])", "interval": "", "intervalFactor": 1, "legendFormat": "{{context}}", "refId": "A" } ], "thresholds": [], "timeFrom": null, "timeRegions": [], "timeShift": null, "title": "Sessions Alive Time Avg /sec over 5 min", "tooltip": { "shared": true, "sort": 0, "value_type": "individual" }, "type": "graph", "xaxis": { "buckets": null, "mode": "time", "name": null, "show": true, "values": [] }, "yaxes": [ { "format": "short", "label": null, "logBase": 1, "max": null, "min": null, "show": true }, { "format": "short", "label": null, "logBase": 1, "max": null, "min": null, "show": true } ], "yaxis": { "align": false, "alignLevel": null } } ], "title": "Tomcat Sessions", "type": "row" }, { "collapsed": true, "datasource": "${DS_PROMETHEUS}", "gridPos": { "h": 1, "w": 24, "x": 0, "y": 48 }, "id": 36, "panels": [ { "aliasColors": {}, "bars": false, "dashLength": 10, "dashes": false, "datasource": "${DS_PROMETHEUS}", "description": "Maximum number of concurrent connections served by this pool.", "fieldConfig": { "defaults": { "custom": {} }, "overrides": [] }, "fill": 1, "fillGradient": 0, "gridPos": { "h": 8, "w": 10, "x": 0, "y": 41 }, "hiddenSeries": false, "id": 37, "legend": { "avg": false, "current": false, "max": false, "min": false, "show": true, "total": false, "values": false }, "lines": true, "linewidth": 1, "nullPointMode": "null", "options": { "alertThreshold": true }, "percentage": false, "pluginVersion": "7.3.6", "pointradius": 2, "points": false, "renderer": "flot", "seriesOverrides": [], "spaceLength": 10, "stack": false, "steppedLine": false, "targets": [ { "expr": "tomcat_connections_active_max{instance=\"$node\",job=\"$job\"}", "interval": "", "intervalFactor": 1, "legendFormat": "{{name}}", "refId": "A" } ], "thresholds": [], "timeFrom": null, "timeRegions": [], "timeShift": null, "title": "Tomcat Connections Active Max", "tooltip": { "shared": true, "sort": 0, "value_type": "individual" }, "type": "graph", "xaxis": { "buckets": null, "mode": "time", "name": null, "show": true, "values": [] }, "yaxes": [ { "format": "short", "label": null, "logBase": 1, "max": null, "min": null, "show": true }, { "format": "short", "label": null, "logBase": 1, "max": null, "min": null, "show": true } ], "yaxis": { "align": false, "alignLevel": null } }, { "aliasColors": {}, "bars": false, "dashLength": 10, "dashes": false, "datasource": "${DS_PROMETHEUS}", "description": "Number of connections served by this pool.", "fieldConfig": { "defaults": { "custom": {} }, "overrides": [] }, "fill": 1, "fillGradient": 0, "gridPos": { "h": 8, "w": 10, "x": 10, "y": 41 }, "hiddenSeries": false, "id": 38, "legend": { "avg": false, "current": false, "max": false, "min": false, "show": true, "total": false, "values": false }, "lines": true, "linewidth": 1, "nullPointMode": "null", "options": { "alertThreshold": true }, "percentage": false, "pluginVersion": "7.3.6", "pointradius": 2, "points": false, "renderer": "flot", "seriesOverrides": [], "spaceLength": 10, "stack": false, "steppedLine": false, "targets": [ { "expr": "tomcat_connections_active_total{instance=\"$node\",job=\"$job\"}", "interval": "", "intervalFactor": 1, "legendFormat": "{{name}}", "refId": "A" } ], "thresholds": [], "timeFrom": null, "timeRegions": [], "timeShift": null, "title": "Tomcat Connections Active Total", "tooltip": { "shared": true, "sort": 0, "value_type": "individual" }, "type": "graph", "xaxis": { "buckets": null, "mode": "time", "name": null, "show": true, "values": [] }, "yaxes": [ { "format": "short", "label": null, "logBase": 1, "max": null, "min": null, "show": true }, { "format": "short", "label": null, "logBase": 1, "max": null, "min": null, "show": true } ], "yaxis": { "align": false, "alignLevel": null } } ], "title": "Tomcat Connections", "type": "row" }, { "collapsed": true, "datasource": "${DS_PROMETHEUS}", "gridPos": { "h": 1, "w": 24, "x": 0, "y": 49 }, "id": 40, "panels": [ { "aliasColors": {}, "bars": false, "dashLength": 10, "dashes": false, "datasource": "${DS_PROMETHEUS}", "description": "The number of request served by this request processor", "fieldConfig": { "defaults": { "custom": {} }, "overrides": [] }, "fill": 1, "fillGradient": 0, "gridPos": { "h": 8, "w": 10, "x": 0, "y": 42 }, "hiddenSeries": false, "id": 41, "legend": { "avg": false, "current": false, "max": false, "min": false, "show": true, "total": false, "values": false }, "lines": true, "linewidth": 1, "nullPointMode": "null", "options": { "alertThreshold": true }, "percentage": false, "pluginVersion": "7.3.6", "pointradius": 2, "points": false, "renderer": "flot", "seriesOverrides": [], "spaceLength": 10, "stack": false, "steppedLine": false, "targets": [ { "expr": "rate(tomcat_requestprocessor_request_count{instance=\"$node\",job=\"$job\"}[5m])", "format": "time_series", "interval": "", "intervalFactor": 1, "legendFormat": "{{name}}", "refId": "A" } ], "thresholds": [], "timeFrom": null, "timeRegions": [], "timeShift": null, "title": "Requests /sec per 5 minutes", "tooltip": { "shared": true, "sort": 0, "value_type": "individual" }, "type": "graph", "xaxis": { "buckets": null, "mode": "time", "name": null, "show": true, "values": [] }, "yaxes": [ { "format": "short", "label": null, "logBase": 1, "max": null, "min": null, "show": true }, { "format": "short", "label": null, "logBase": 1, "max": null, "min": null, "show": true } ], "yaxis": { "align": false, "alignLevel": null } }, { "aliasColors": {}, "bars": false, "dashLength": 10, "dashes": false, "datasource": "${DS_PROMETHEUS}", "description": "The number of error request served by this request processor", "fieldConfig": { "defaults": { "custom": {} }, "overrides": [] }, "fill": 1, "fillGradient": 0, "gridPos": { "h": 8, "w": 10, "x": 10, "y": 42 }, "hiddenSeries": false, "id": 42, "legend": { "avg": false, "current": false, "max": false, "min": false, "show": true, "total": false, "values": false }, "lines": true, "linewidth": 1, "nullPointMode": "null", "options": { "alertThreshold": true }, "percentage": false, "pluginVersion": "7.3.6", "pointradius": 2, "points": false, "renderer": "flot", "seriesOverrides": [], "spaceLength": 10, "stack": false, "steppedLine": false, "targets": [ { "expr": "rate(tomcat_requestprocessor_error_count{instance=\"$node\",job=\"$job\"}[5m])", "interval": "", "intervalFactor": 1, "legendFormat": "{{name}}", "refId": "A" } ], "thresholds": [], "timeFrom": null, "timeRegions": [], "timeShift": null, "title": "Request Errors /sec per 5 minutes", "tooltip": { "shared": true, "sort": 0, "value_type": "individual" }, "type": "graph", "xaxis": { "buckets": null, "mode": "time", "name": null, "show": true, "values": [] }, "yaxes": [ { "format": "short", "label": null, "logBase": 1, "max": null, "min": null, "show": true }, { "format": "short", "label": null, "logBase": 1, "max": null, "min": null, "show": true } ], "yaxis": { "align": false, "alignLevel": null } }, { "aliasColors": {}, "bars": false, "dashLength": 10, "dashes": false, "datasource": "${DS_PROMETHEUS}", "description": "Rate of errors compared to total requests for the request processor", "fieldConfig": { "defaults": { "custom": {} }, "overrides": [] }, "fill": 1, "fillGradient": 0, "gridPos": { "h": 8, "w": 10, "x": 0, "y": 50 }, "hiddenSeries": false, "id": 43, "legend": { "avg": false, "current": false, "max": false, "min": false, "show": true, "total": false, "values": false }, "lines": true, "linewidth": 1, "nullPointMode": "null", "options": { "alertThreshold": true }, "percentage": false, "pluginVersion": "7.3.6", "pointradius": 2, "points": false, "renderer": "flot", "seriesOverrides": [], "spaceLength": 10, "stack": false, "steppedLine": false, "targets": [ { "expr": "sum(rate(tomcat_requestprocessor_error_count{instance=\"$node\",job=\"$job\"}[1m])) by (instance,name) \n/ sum(rate(tomcat_requestprocessor_request_count{instance=\"$node\",job=\"$job\"}[1m])) by (instance,name) *100", "interval": "", "intervalFactor": 1, "legendFormat": "{{name}}", "refId": "A" } ], "thresholds": [], "timeFrom": null, "timeRegions": [], "timeShift": null, "title": "Percent Errors/Requests", "tooltip": { "shared": true, "sort": 0, "value_type": "individual" }, "type": "graph", "xaxis": { "buckets": null, "mode": "time", "name": null, "show": true, "values": [] }, "yaxes": [ { "format": "short", "label": null, "logBase": 1, "max": null, "min": null, "show": true }, { "format": "short", "label": null, "logBase": 1, "max": null, "min": null, "show": true } ], "yaxis": { "align": false, "alignLevel": null } }, { "aliasColors": {}, "bars": false, "dashLength": 10, "dashes": false, "datasource": "${DS_PROMETHEUS}", "description": "Number of bytes received by this request processor", "fieldConfig": { "defaults": { "custom": {} }, "overrides": [] }, "fill": 1, "fillGradient": 0, "gridPos": { "h": 8, "w": 10, "x": 10, "y": 50 }, "hiddenSeries": false, "id": 44, "legend": { "avg": false, "current": false, "max": false, "min": false, "show": true, "total": false, "values": false }, "lines": true, "linewidth": 1, "nullPointMode": "null", "options": { "alertThreshold": true }, "percentage": false, "pluginVersion": "7.3.6", "pointradius": 2, "points": false, "renderer": "flot", "seriesOverrides": [], "spaceLength": 10, "stack": false, "steppedLine": false, "targets": [ { "expr": "rate(tomcat_requestprocessor_received_bytes{instance=\"$node\",job=\"$job\"}[5m]) /1024/1024", "interval": "", "intervalFactor": 1, "legendFormat": "{{name}}", "refId": "A" } ], "thresholds": [], "timeFrom": null, "timeRegions": [], "timeShift": null, "title": "Request Received Bytes (MB) /sec over 5 min", "tooltip": { "shared": true, "sort": 0, "value_type": "individual" }, "type": "graph", "xaxis": { "buckets": null, "mode": "time", "name": null, "show": true, "values": [] }, "yaxes": [ { "format": "short", "label": null, "logBase": 1, "max": null, "min": null, "show": true }, { "format": "short", "label": null, "logBase": 1, "max": null, "min": null, "show": true } ], "yaxis": { "align": false, "alignLevel": null } }, { "aliasColors": {}, "bars": false, "dashLength": 10, "dashes": false, "datasource": "${DS_PROMETHEUS}", "description": "Number of bytes sent by this request processor", "fieldConfig": { "defaults": { "custom": {} }, "overrides": [] }, "fill": 1, "fillGradient": 0, "gridPos": { "h": 8, "w": 10, "x": 0, "y": 58 }, "hiddenSeries": false, "id": 45, "legend": { "avg": false, "current": false, "max": false, "min": false, "show": true, "total": false, "values": false }, "lines": true, "linewidth": 1, "nullPointMode": "null", "options": { "alertThreshold": true }, "percentage": false, "pluginVersion": "7.3.6", "pointradius": 2, "points": false, "renderer": "flot", "seriesOverrides": [], "spaceLength": 10, "stack": false, "steppedLine": false, "targets": [ { "expr": "rate(tomcat_requestprocessor_sent_bytes{instance=\"$node\",job=\"$job\"}[5m]) /1024/1024 ", "interval": "", "intervalFactor": 1, "legendFormat": "{{name}}", "refId": "A" } ], "thresholds": [], "timeFrom": null, "timeRegions": [], "timeShift": null, "title": "Request Sent Bytes (MB) /sec over 5 min", "tooltip": { "shared": true, "sort": 0, "value_type": "individual" }, "type": "graph", "xaxis": { "buckets": null, "mode": "time", "name": null, "show": true, "values": [] }, "yaxes": [ { "format": "short", "label": null, "logBase": 1, "max": null, "min": null, "show": true }, { "format": "short", "label": null, "logBase": 1, "max": null, "min": null, "show": true } ], "yaxis": { "align": false, "alignLevel": null } } ], "title": "Tomcat Request Processor", "type": "row" }, { "collapsed": false, "datasource": "${DS_PROMETHEUS}", "gridPos": { "h": 1, "w": 24, "x": 0, "y": 50 }, "id": 58, "panels": [], "title": "Tomcat JDBC (if enabled)", "type": "row" }, { "datasource": "${DS_PROMETHEUS}", "description": "Maximum number of active connections that can be allocated from this pool at the same time", "fieldConfig": { "defaults": { "custom": { "align": null, "filterable": false }, "mappings": [], "thresholds": { "mode": "absolute", "steps": [ { "color": "green", "value": null } ] } }, "overrides": [] }, "gridPos": { "h": 3, "w": 18, "x": 0, "y": 51 }, "id": 60, "options": { "colorMode": "value", "graphMode": "none", "justifyMode": "auto", "orientation": "auto", "reduceOptions": { "calcs": [ "mean" ], "fields": "", "values": false }, "textMode": "auto" }, "pluginVersion": "7.3.6", "targets": [ { "expr": "tomcat_jdbc_connections_max{instance=\"$node\",job=\"$job\"}", "instant": true, "interval": "", "legendFormat": "{{pool}}", "refId": "A" } ], "timeFrom": null, "timeShift": null, "title": "JDBC Max Connections", "type": "stat" }, { "aliasColors": {}, "bars": false, "dashLength": 10, "dashes": false, "datasource": "${DS_PROMETHEUS}", "description": "Total number of connections in this pool", "fieldConfig": { "defaults": { "custom": { "align": null, "filterable": false }, "mappings": [], "thresholds": { "mode": "absolute", "steps": [ { "color": "green", "value": null } ] } }, "overrides": [] }, "fill": 1, "fillGradient": 0, "gridPos": { "h": 7, "w": 9, "x": 0, "y": 54 }, "hiddenSeries": false, "id": 63, "legend": { "avg": false, "current": false, "max": false, "min": false, "show": true, "total": false, "values": false }, "lines": true, "linewidth": 1, "nullPointMode": "null", "options": { "alertThreshold": true }, "percentage": false, "pluginVersion": "7.3.6", "pointradius": 2, "points": false, "renderer": "flot", "seriesOverrides": [], "spaceLength": 10, "stack": false, "steppedLine": false, "targets": [ { "expr": "tomcat_jdbc_connections_total{instance=\"$node\",job=\"$job\"}", "instant": false, "interval": "", "legendFormat": "{{pool}}", "refId": "A" } ], "thresholds": [], "timeFrom": null, "timeRegions": [], "timeShift": null, "title": "JDBC Total Connections", "tooltip": { "shared": true, "sort": 0, "value_type": "individual" }, "type": "graph", "xaxis": { "buckets": null, "mode": "time", "name": null, "show": true, "values": [] }, "yaxes": [ { "format": "short", "label": null, "logBase": 1, "max": null, "min": null, "show": true }, { "format": "short", "label": null, "logBase": 1, "max": null, "min": null, "show": true } ], "yaxis": { "align": false, "alignLevel": null } }, { "aliasColors": {}, "bars": false, "dashLength": 10, "dashes": false, "datasource": "${DS_PROMETHEUS}", "description": "Number of active connections allocated from this pool", "fieldConfig": { "defaults": { "custom": { "align": null, "filterable": false }, "mappings": [], "thresholds": { "mode": "absolute", "steps": [ { "color": "green", "value": null } ] } }, "overrides": [] }, "fill": 1, "fillGradient": 0, "gridPos": { "h": 7, "w": 9, "x": 9, "y": 54 }, "hiddenSeries": false, "id": 61, "legend": { "avg": false, "current": false, "max": false, "min": false, "show": true, "total": false, "values": false }, "lines": true, "linewidth": 1, "nullPointMode": "null", "options": { "alertThreshold": true }, "percentage": false, "pluginVersion": "7.3.6", "pointradius": 2, "points": false, "renderer": "flot", "seriesOverrides": [], "spaceLength": 10, "stack": false, "steppedLine": false, "targets": [ { "expr": "tomcat_jdbc_connections_active_total{instance=\"$node\",job=\"$job\"}", "instant": false, "interval": "", "legendFormat": "{{pool}}", "refId": "A" } ], "thresholds": [], "timeFrom": null, "timeRegions": [], "timeShift": null, "title": "JDBC Active Connections", "tooltip": { "shared": true, "sort": 0, "value_type": "individual" }, "type": "graph", "xaxis": { "buckets": null, "mode": "time", "name": null, "show": true, "values": [] }, "yaxes": [ { "format": "short", "label": null, "logBase": 1, "max": null, "min": null, "show": true }, { "format": "short", "label": null, "logBase": 1, "max": null, "min": null, "show": true } ], "yaxis": { "align": false, "alignLevel": null } }, { "aliasColors": {}, "bars": false, "dashLength": 10, "dashes": false, "datasource": "${DS_PROMETHEUS}", "description": "Number of idle connections in this pool", "fieldConfig": { "defaults": { "custom": { "align": null, "filterable": false }, "mappings": [], "thresholds": { "mode": "absolute", "steps": [ { "color": "green", "value": null } ] } }, "overrides": [] }, "fill": 1, "fillGradient": 0, "gridPos": { "h": 7, "w": 9, "x": 0, "y": 61 }, "hiddenSeries": false, "id": 62, "legend": { "avg": false, "current": false, "max": false, "min": false, "show": true, "total": false, "values": false }, "lines": true, "linewidth": 1, "nullPointMode": "null", "options": { "alertThreshold": true }, "percentage": false, "pluginVersion": "7.3.6", "pointradius": 2, "points": false, "renderer": "flot", "seriesOverrides": [], "spaceLength": 10, "stack": false, "steppedLine": false, "targets": [ { "expr": "tomcat_jdbc_connections_idle_total{instance=\"$node\",job=\"$job\"}", "instant": false, "interval": "", "legendFormat": "{{pool}}", "refId": "A" } ], "thresholds": [], "timeFrom": null, "timeRegions": [], "timeShift": null, "title": "JDBC Idle Connections", "tooltip": { "shared": true, "sort": 0, "value_type": "individual" }, "type": "graph", "xaxis": { "buckets": null, "mode": "time", "name": null, "show": true, "values": [] }, "yaxes": [ { "format": "short", "label": null, "logBase": 1, "max": null, "min": null, "show": true }, { "format": "short", "label": null, "logBase": 1, "max": null, "min": null, "show": true } ], "yaxis": { "align": false, "alignLevel": null } }, { "aliasColors": {}, "bars": false, "dashLength": 10, "dashes": false, "datasource": "${DS_PROMETHEUS}", "description": "Number of threads waiting for connections from this pool", "fieldConfig": { "defaults": { "custom": { "align": null, "filterable": false }, "mappings": [], "thresholds": { "mode": "absolute", "steps": [ { "color": "green", "value": null } ] } }, "overrides": [] }, "fill": 1, "fillGradient": 0, "gridPos": { "h": 7, "w": 9, "x": 9, "y": 61 }, "hiddenSeries": false, "id": 64, "legend": { "avg": false, "current": false, "max": false, "min": false, "show": true, "total": false, "values": false }, "lines": true, "linewidth": 1, "nullPointMode": "null", "options": { "alertThreshold": true }, "percentage": false, "pluginVersion": "7.3.6", "pointradius": 2, "points": false, "renderer": "flot", "seriesOverrides": [], "spaceLength": 10, "stack": false, "steppedLine": false, "targets": [ { "expr": "tomcat_jdbc_waitingthreads_total{instance=\"$node\",job=\"$job\"}", "instant": false, "interval": "", "legendFormat": "{{pool}}", "refId": "A" } ], "thresholds": [], "timeFrom": null, "timeRegions": [], "timeShift": null, "title": "JDBC Waiting Threads Total", "tooltip": { "shared": true, "sort": 0, "value_type": "individual" }, "type": "graph", "xaxis": { "buckets": null, "mode": "time", "name": null, "show": true, "values": [] }, "yaxes": [ { "format": "short", "label": null, "logBase": 1, "max": null, "min": null, "show": true }, { "format": "short", "label": null, "logBase": 1, "max": null, "min": null, "show": true } ], "yaxis": { "align": false, "alignLevel": null } }, { "aliasColors": {}, "bars": false, "dashLength": 10, "dashes": false, "datasource": "${DS_PROMETHEUS}", "description": "Number of connections borrowed from this pool", "fieldConfig": { "defaults": { "custom": { "align": null, "filterable": false }, "mappings": [], "thresholds": { "mode": "absolute", "steps": [ { "color": "green", "value": null } ] } }, "overrides": [] }, "fill": 1, "fillGradient": 0, "gridPos": { "h": 7, "w": 9, "x": 0, "y": 68 }, "hiddenSeries": false, "id": 65, "legend": { "avg": false, "current": false, "max": false, "min": false, "show": true, "total": false, "values": false }, "lines": true, "linewidth": 1, "nullPointMode": "null", "options": { "alertThreshold": true }, "percentage": false, "pluginVersion": "7.3.6", "pointradius": 2, "points": false, "renderer": "flot", "seriesOverrides": [], "spaceLength": 10, "stack": false, "steppedLine": false, "targets": [ { "expr": "rate(tomcat_jdbc_connections_borrowed_total{instance=\"$node\",job=\"$job\"}[5m])", "instant": false, "interval": "", "legendFormat": "{{pool}}", "refId": "A" } ], "thresholds": [], "timeFrom": null, "timeRegions": [], "timeShift": null, "title": "JDBC Connections Borrowed /s over 5 min", "tooltip": { "shared": true, "sort": 0, "value_type": "individual" }, "type": "graph", "xaxis": { "buckets": null, "mode": "time", "name": null, "show": true, "values": [] }, "yaxes": [ { "format": "short", "label": null, "logBase": 1, "max": null, "min": null, "show": true }, { "format": "short", "label": null, "logBase": 1, "max": null, "min": null, "show": true } ], "yaxis": { "align": false, "alignLevel": null } }, { "aliasColors": {}, "bars": false, "dashLength": 10, "dashes": false, "datasource": "${DS_PROMETHEUS}", "description": "Number of connections returned to this pool", "fieldConfig": { "defaults": { "custom": { "align": null, "filterable": false }, "mappings": [], "thresholds": { "mode": "absolute", "steps": [ { "color": "green", "value": null } ] } }, "overrides": [] }, "fill": 1, "fillGradient": 0, "gridPos": { "h": 7, "w": 9, "x": 9, "y": 68 }, "hiddenSeries": false, "id": 66, "legend": { "avg": false, "current": false, "max": false, "min": false, "show": true, "total": false, "values": false }, "lines": true, "linewidth": 1, "nullPointMode": "null", "options": { "alertThreshold": true }, "percentage": false, "pluginVersion": "7.3.6", "pointradius": 2, "points": false, "renderer": "flot", "seriesOverrides": [], "spaceLength": 10, "stack": false, "steppedLine": false, "targets": [ { "expr": "rate(tomcat_jdbc_connections_returned_total{instance=\"$node\",job=\"$job\"}[5m])", "instant": false, "interval": "", "legendFormat": "{{pool}}", "refId": "A" } ], "thresholds": [], "timeFrom": null, "timeRegions": [], "timeShift": null, "title": "JDBC Connections Returned /s over 5 min", "tooltip": { "shared": true, "sort": 0, "value_type": "individual" }, "type": "graph", "xaxis": { "buckets": null, "mode": "time", "name": null, "show": true, "values": [] }, "yaxes": [ { "format": "short", "label": null, "logBase": 1, "max": null, "min": null, "show": true }, { "format": "short", "label": null, "logBase": 1, "max": null, "min": null, "show": true } ], "yaxis": { "align": false, "alignLevel": null } }, { "aliasColors": {}, "bars": false, "dashLength": 10, "dashes": false, "datasource": "${DS_PROMETHEUS}", "description": "Number of connections created by this pool", "fieldConfig": { "defaults": { "custom": { "align": null, "filterable": false }, "mappings": [], "thresholds": { "mode": "absolute", "steps": [ { "color": "green", "value": null } ] } }, "overrides": [] }, "fill": 1, "fillGradient": 0, "gridPos": { "h": 7, "w": 9, "x": 0, "y": 75 }, "hiddenSeries": false, "id": 67, "legend": { "avg": false, "current": false, "max": false, "min": false, "show": true, "total": false, "values": false }, "lines": true, "linewidth": 1, "nullPointMode": "null", "options": { "alertThreshold": true }, "percentage": false, "pluginVersion": "7.3.6", "pointradius": 2, "points": false, "renderer": "flot", "seriesOverrides": [], "spaceLength": 10, "stack": false, "steppedLine": false, "targets": [ { "expr": "rate(tomcat_jdbc_connections_created_total{instance=\"$node\",job=\"$job\"}[5m])", "instant": false, "interval": "", "legendFormat": "{{pool}}", "refId": "A" } ], "thresholds": [], "timeFrom": null, "timeRegions": [], "timeShift": null, "title": "JDBC Connections Created /s over 5 min", "tooltip": { "shared": true, "sort": 0, "value_type": "individual" }, "type": "graph", "xaxis": { "buckets": null, "mode": "time", "name": null, "show": true, "values": [] }, "yaxes": [ { "format": "short", "label": null, "logBase": 1, "max": null, "min": null, "show": true }, { "format": "short", "label": null, "logBase": 1, "max": null, "min": null, "show": true } ], "yaxis": { "align": false, "alignLevel": null } }, { "aliasColors": {}, "bars": false, "dashLength": 10, "dashes": false, "datasource": "${DS_PROMETHEUS}", "description": "Number of connections released by this pool", "fieldConfig": { "defaults": { "custom": { "align": null, "filterable": false }, "mappings": [], "thresholds": { "mode": "absolute", "steps": [ { "color": "green", "value": null } ] } }, "overrides": [] }, "fill": 1, "fillGradient": 0, "gridPos": { "h": 7, "w": 9, "x": 9, "y": 75 }, "hiddenSeries": false, "id": 68, "legend": { "avg": false, "current": false, "max": false, "min": false, "show": true, "total": false, "values": false }, "lines": true, "linewidth": 1, "nullPointMode": "null", "options": { "alertThreshold": true }, "percentage": false, "pluginVersion": "7.3.6", "pointradius": 2, "points": false, "renderer": "flot", "seriesOverrides": [], "spaceLength": 10, "stack": false, "steppedLine": false, "targets": [ { "expr": "rate(tomcat_jdbc_connections_released_total{instance=\"$node\",job=\"$job\"}[5m])", "instant": false, "interval": "", "legendFormat": "{{pool}}", "refId": "A" } ], "thresholds": [], "timeFrom": null, "timeRegions": [], "timeShift": null, "title": "JDBC Connections Released /s over 5 min", "tooltip": { "shared": true, "sort": 0, "value_type": "individual" }, "type": "graph", "xaxis": { "buckets": null, "mode": "time", "name": null, "show": true, "values": [] }, "yaxes": [ { "format": "short", "label": null, "logBase": 1, "max": null, "min": null, "show": true }, { "format": "short", "label": null, "logBase": 1, "max": null, "min": null, "show": true } ], "yaxis": { "align": false, "alignLevel": null } }, { "aliasColors": {}, "bars": false, "dashLength": 10, "dashes": false, "datasource": "${DS_PROMETHEUS}", "description": "Number of reconnected connections by this pool", "fieldConfig": { "defaults": { "custom": { "align": null, "filterable": false }, "mappings": [], "thresholds": { "mode": "absolute", "steps": [ { "color": "green", "value": null } ] } }, "overrides": [] }, "fill": 1, "fillGradient": 0, "gridPos": { "h": 7, "w": 9, "x": 0, "y": 82 }, "hiddenSeries": false, "id": 69, "legend": { "avg": false, "current": false, "max": false, "min": false, "show": true, "total": false, "values": false }, "lines": true, "linewidth": 1, "nullPointMode": "null", "options": { "alertThreshold": true }, "percentage": false, "pluginVersion": "7.3.6", "pointradius": 2, "points": false, "renderer": "flot", "seriesOverrides": [], "spaceLength": 10, "stack": false, "steppedLine": false, "targets": [ { "expr": "rate(tomcat_jdbc_connections_reconnected_total{instance=\"$node\",job=\"$job\"}[5m])", "instant": false, "interval": "", "legendFormat": "{{pool}}", "refId": "A" } ], "thresholds": [], "timeFrom": null, "timeRegions": [], "timeShift": null, "title": "JDBC Connections Reconnected /s over 5 min", "tooltip": { "shared": true, "sort": 0, "value_type": "individual" }, "type": "graph", "xaxis": { "buckets": null, "mode": "time", "name": null, "show": true, "values": [] }, "yaxes": [ { "format": "short", "label": null, "logBase": 1, "max": null, "min": null, "show": true }, { "format": "short", "label": null, "logBase": 1, "max": null, "min": null, "show": true } ], "yaxis": { "align": false, "alignLevel": null } }, { "aliasColors": {}, "bars": false, "dashLength": 10, "dashes": false, "datasource": "${DS_PROMETHEUS}", "description": "Number of abandoned connections that have been removed", "fieldConfig": { "defaults": { "custom": { "align": null, "filterable": false }, "mappings": [], "thresholds": { "mode": "absolute", "steps": [ { "color": "green", "value": null } ] } }, "overrides": [] }, "fill": 1, "fillGradient": 0, "gridPos": { "h": 7, "w": 9, "x": 9, "y": 82 }, "hiddenSeries": false, "id": 70, "legend": { "avg": false, "current": false, "max": false, "min": false, "show": true, "total": false, "values": false }, "lines": true, "linewidth": 1, "nullPointMode": "null", "options": { "alertThreshold": true }, "percentage": false, "pluginVersion": "7.3.6", "pointradius": 2, "points": false, "renderer": "flot", "seriesOverrides": [], "spaceLength": 10, "stack": false, "steppedLine": false, "targets": [ { "expr": "rate(tomcat_jdbc_connections_removeabandoned_total{instance=\"$node\",job=\"$job\"}[5m])", "instant": false, "interval": "", "legendFormat": "{{pool}}", "refId": "A" } ], "thresholds": [], "timeFrom": null, "timeRegions": [], "timeShift": null, "title": "JDBC Connections Removed/Abandoned /sec over 5 min", "tooltip": { "shared": true, "sort": 0, "value_type": "individual" }, "type": "graph", "xaxis": { "buckets": null, "mode": "time", "name": null, "show": true, "values": [] }, "yaxes": [ { "format": "short", "label": null, "logBase": 1, "max": null, "min": null, "show": true }, { "format": "short", "label": null, "logBase": 1, "max": null, "min": null, "show": true } ], "yaxis": { "align": false, "alignLevel": null } }, { "aliasColors": {}, "bars": false, "dashLength": 10, "dashes": false, "datasource": "${DS_PROMETHEUS}", "description": "Number of idle connections that have been released", "fieldConfig": { "defaults": { "custom": { "align": null, "filterable": false }, "mappings": [], "thresholds": { "mode": "absolute", "steps": [ { "color": "green", "value": null } ] } }, "overrides": [] }, "fill": 1, "fillGradient": 0, "gridPos": { "h": 7, "w": 9, "x": 0, "y": 89 }, "hiddenSeries": false, "id": 71, "legend": { "avg": false, "current": false, "max": false, "min": false, "show": true, "total": false, "values": false }, "lines": true, "linewidth": 1, "nullPointMode": "null", "options": { "alertThreshold": true }, "percentage": false, "pluginVersion": "7.3.6", "pointradius": 2, "points": false, "renderer": "flot", "seriesOverrides": [], "spaceLength": 10, "stack": false, "steppedLine": false, "targets": [ { "expr": "rate(tomcat_jdbc_connections_releasedidle_total{instance=\"$node\",job=\"$job\"}[5m])", "instant": false, "interval": "", "legendFormat": "{{pool}}", "refId": "A" } ], "thresholds": [], "timeFrom": null, "timeRegions": [], "timeShift": null, "title": "JDBC Connections Released/Idle /s over 5 min", "tooltip": { "shared": true, "sort": 0, "value_type": "individual" }, "type": "graph", "xaxis": { "buckets": null, "mode": "time", "name": null, "show": true, "values": [] }, "yaxes": [ { "format": "short", "label": null, "logBase": 1, "max": null, "min": null, "show": true }, { "format": "short", "label": null, "logBase": 1, "max": null, "min": null, "show": true } ], "yaxis": { "align": false, "alignLevel": null } }, { "datasource": "${DS_PROMETHEUS}", "description": "Number of errors for give JDBC query", "fieldConfig": { "defaults": { "custom": { "align": null, "filterable": false }, "mappings": [], "thresholds": { "mode": "absolute", "steps": [ { "color": "green", "value": null } ] } }, "overrides": [] }, "gridPos": { "h": 8, "w": 18, "x": 0, "y": 96 }, "id": 72, "options": { "showHeader": true }, "pluginVersion": "7.3.6", "targets": [ { "expr": "tomcat_jdbc_failedquery_total{instance=\"$node\",job=\"$job\"}", "format": "table", "instant": false, "interval": "", "legendFormat": "{{query}}", "refId": "A" } ], "timeFrom": null, "timeShift": null, "title": "JDBC Failed Query Totals", "transformations": [ { "id": "organize", "options": { "excludeByName": { "Time": false, "__name__": true, "env_severity": true, "hostname": true, "instance": true, "job": true }, "indexByName": {}, "renameByName": { "__name__": "" } } }, { "id": "groupBy", "options": { "fields": { "Value": { "aggregations": [ "sum" ], "operation": "aggregate" }, "query": { "aggregations": [], "operation": "groupby" } } } } ], "type": "table" }, { "datasource": "${DS_PROMETHEUS}", "description": "Number of errors for give JDBC query", "fieldConfig": { "defaults": { "custom": { "align": null, "filterable": false }, "mappings": [], "thresholds": { "mode": "absolute", "steps": [ { "color": "green", "value": null } ] } }, "overrides": [] }, "gridPos": { "h": 8, "w": 18, "x": 0, "y": 104 }, "id": 73, "options": { "showHeader": true }, "pluginVersion": "7.3.6", "targets": [ { "expr": "sum by(query) (tomcat_jdbc_failedquery_total{instance=\"$node\",job=\"$job\"})", "format": "table", "instant": false, "interval": "", "legendFormat": "{{query}}", "refId": "A" } ], "timeFrom": null, "timeShift": null, "title": "JDBC Failed Query Details", "transformations": [ { "id": "organize", "options": { "excludeByName": { "Time": false, "__name__": true, "env_severity": true, "hostname": true, "instance": true, "job": true }, "indexByName": {}, "renameByName": { "__name__": "" } } } ], "type": "table" }, { "aliasColors": {}, "bars": false, "dashLength": 10, "dashes": false, "datasource": "${DS_PROMETHEUS}", "description": "JDBC query duration", "fieldConfig": { "defaults": { "custom": {} }, "overrides": [] }, "fill": 1, "fillGradient": 0, "gridPos": { "h": 8, "w": 9, "x": 0, "y": 112 }, "hiddenSeries": false, "id": 75, "legend": { "avg": false, "current": false, "max": false, "min": false, "show": true, "total": false, "values": false }, "lines": true, "linewidth": 1, "nullPointMode": "null", "options": { "alertThreshold": true }, "percentage": false, "pluginVersion": "7.3.6", "pointradius": 2, "points": false, "renderer": "flot", "seriesOverrides": [], "spaceLength": 10, "stack": false, "steppedLine": false, "targets": [ { "expr": "rate(tomcat_jdbc_query_seconds_sum{instance=\"$node\",job=\"$job\"}[1m])", "format": "time_series", "instant": false, "interval": "", "intervalFactor": 1, "legendFormat": "{{status}}", "refId": "A" } ], "thresholds": [], "timeFrom": null, "timeRegions": [], "timeShift": null, "title": "JDBC query total duration /s over 1 min", "tooltip": { "shared": true, "sort": 0, "value_type": "individual" }, "type": "graph", "xaxis": { "buckets": null, "mode": "time", "name": null, "show": true, "values": [] }, "yaxes": [ { "format": "short", "label": null, "logBase": 1, "max": null, "min": null, "show": true }, { "format": "short", "label": null, "logBase": 1, "max": null, "min": null, "show": true } ], "yaxis": { "align": false, "alignLevel": null } }, { "aliasColors": {}, "bars": false, "dashLength": 10, "dashes": false, "datasource": "${DS_PROMETHEUS}", "description": "JDBC query counts", "fieldConfig": { "defaults": { "custom": {} }, "overrides": [] }, "fill": 1, "fillGradient": 0, "gridPos": { "h": 8, "w": 9, "x": 9, "y": 112 }, "hiddenSeries": false, "id": 76, "legend": { "avg": false, "current": false, "max": false, "min": false, "show": true, "total": false, "values": false }, "lines": true, "linewidth": 1, "nullPointMode": "null", "options": { "alertThreshold": true }, "percentage": false, "pluginVersion": "7.3.6", "pointradius": 2, "points": false, "renderer": "flot", "seriesOverrides": [], "spaceLength": 10, "stack": false, "steppedLine": false, "targets": [ { "expr": "rate(tomcat_jdbc_query_seconds_count{instance=\"$node\",job=\"$job\"}[1m])", "format": "time_series", "instant": false, "interval": "", "intervalFactor": 1, "legendFormat": "{{status}}", "refId": "A" } ], "thresholds": [], "timeFrom": null, "timeRegions": [], "timeShift": null, "title": "JDBC query count /s over 1 min", "tooltip": { "shared": true, "sort": 0, "value_type": "individual" }, "type": "graph", "xaxis": { "buckets": null, "mode": "time", "name": null, "show": true, "values": [] }, "yaxes": [ { "format": "short", "label": null, "logBase": 1, "max": null, "min": null, "show": true }, { "format": "short", "label": null, "logBase": 1, "max": null, "min": null, "show": true } ], "yaxis": { "align": false, "alignLevel": null } }, { "aliasColors": {}, "bars": false, "dashLength": 10, "dashes": false, "datasource": "${DS_PROMETHEUS}", "description": "JDBC avg query duration", "fieldConfig": { "defaults": { "custom": {} }, "overrides": [] }, "fill": 1, "fillGradient": 0, "gridPos": { "h": 8, "w": 12, "x": 0, "y": 120 }, "hiddenSeries": false, "id": 77, "legend": { "avg": false, "current": false, "max": false, "min": false, "show": true, "total": false, "values": false }, "lines": true, "linewidth": 1, "nullPointMode": "null", "options": { "alertThreshold": true }, "percentage": false, "pluginVersion": "7.3.6", "pointradius": 2, "points": false, "renderer": "flot", "seriesOverrides": [], "spaceLength": 10, "stack": false, "steppedLine": false, "targets": [ { "expr": "rate(tomcat_jdbc_query_seconds_sum{instance=\"$node\",job=\"$job\"}[1m]) / rate(tomcat_jdbc_query_seconds_count{instance=\"$node\",job=\"$job\"}[1m])", "format": "time_series", "instant": false, "interval": "", "intervalFactor": 1, "legendFormat": "{{status}}", "refId": "A" } ], "thresholds": [], "timeFrom": null, "timeRegions": [], "timeShift": null, "title": "JDBC query average query duration over 1 min", "tooltip": { "shared": true, "sort": 0, "value_type": "individual" }, "type": "graph", "xaxis": { "buckets": null, "mode": "time", "name": null, "show": true, "values": [] }, "yaxes": [ { "format": "short", "label": null, "logBase": 1, "max": null, "min": null, "show": true }, { "format": "short", "label": null, "logBase": 1, "max": null, "min": null, "show": true } ], "yaxis": { "align": false, "alignLevel": null } } ], "schemaVersion": 26, "style": "dark", "tags": [], "templating": { "list": [ { "allValue": null, "current": {}, "datasource": "${DS_PROMETHEUS}", "definition": "label_values(tomcat_session_active_total, job)", "error": null, "hide": 0, "includeAll": false, "label": "Job", "multi": false, "name": "job", "options": [], "query": "label_values(tomcat_session_active_total, job)", "refresh": 1, "regex": "", "skipUrlSync": false, "sort": 1, "tagValuesQuery": "", "tags": [], "tagsQuery": "", "type": "query", "useTags": false }, { "allValue": null, "current": {}, "datasource": "${DS_PROMETHEUS}", "definition": "label_values(tomcat_session_active_total{job=\"$job\"}, instance)", "error": null, "hide": 0, "includeAll": false, "label": "Host:", "multi": false, "name": "node", "options": [], "query": "label_values(tomcat_session_active_total{job=\"$job\"}, instance)", "refresh": 1, "regex": "", "skipUrlSync": false, "sort": 1, "tagValuesQuery": "", "tags": [], "tagsQuery": "", "type": "query", "useTags": false } ] }, "time": { "from": "now-5m", "to": "now" }, "timepicker": {}, "timezone": "", "title": "Tomcat Exporter", "uid": "DVWnyqH7z", "version": 227 }
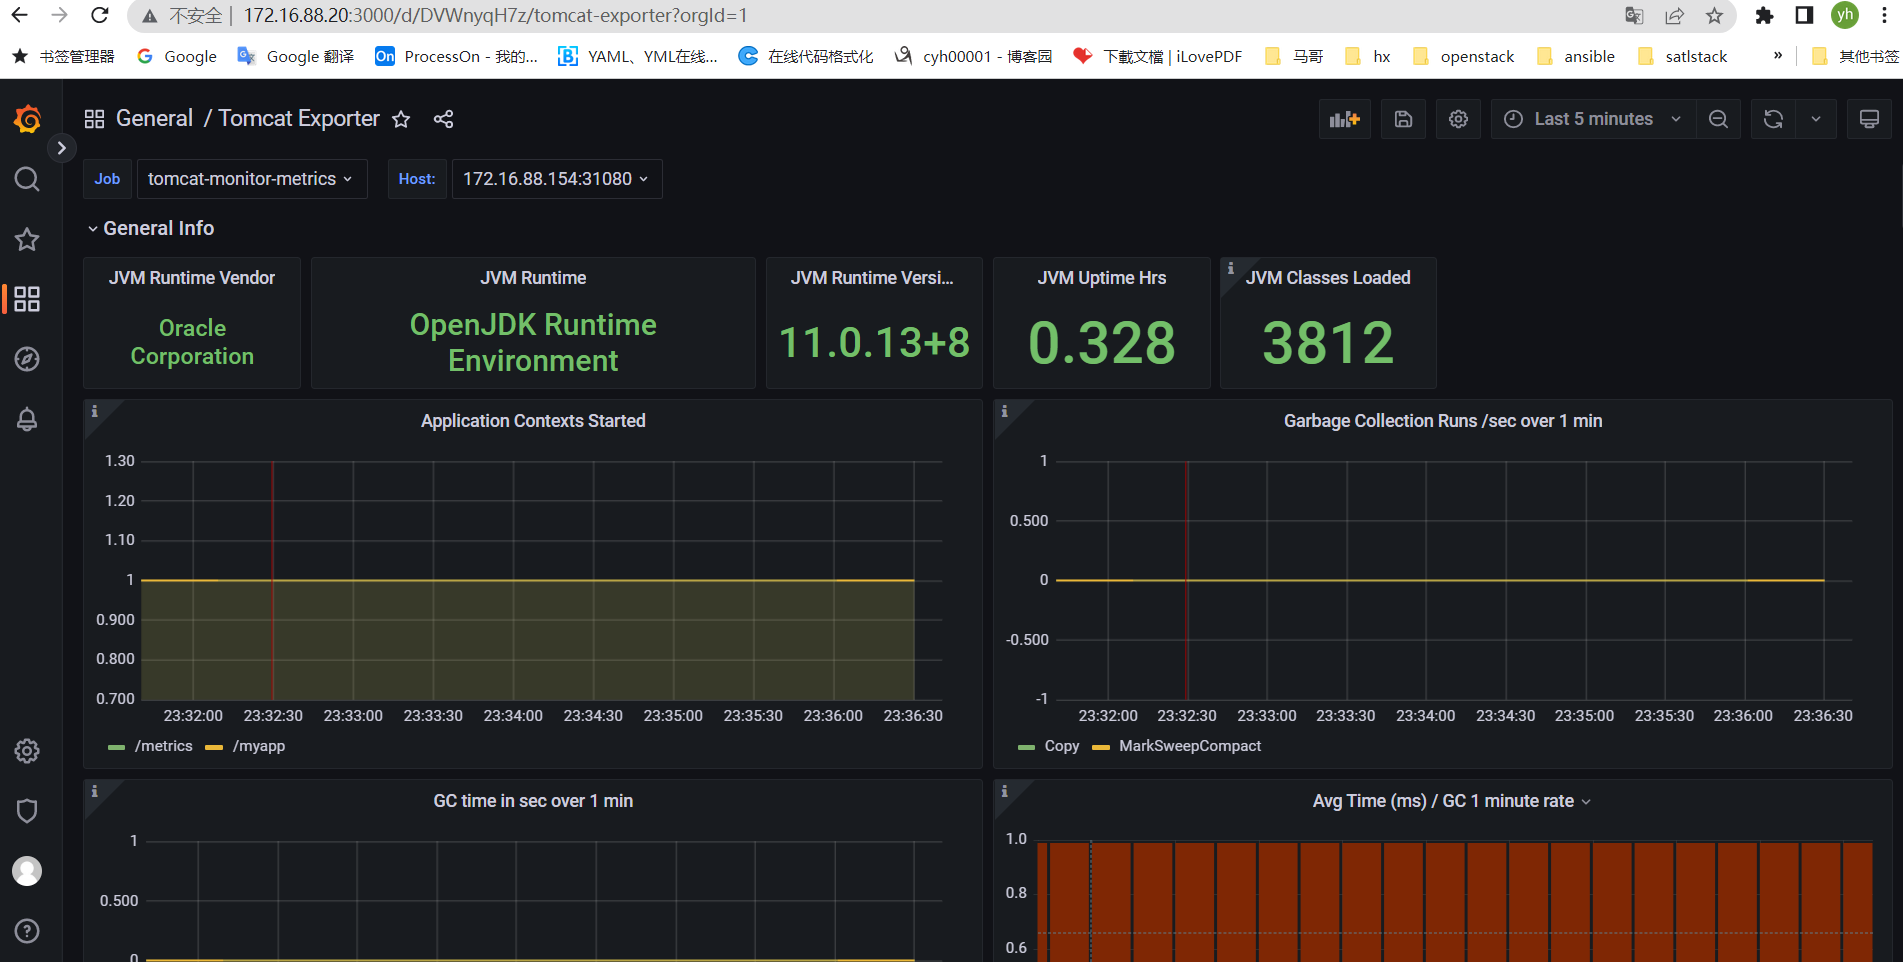
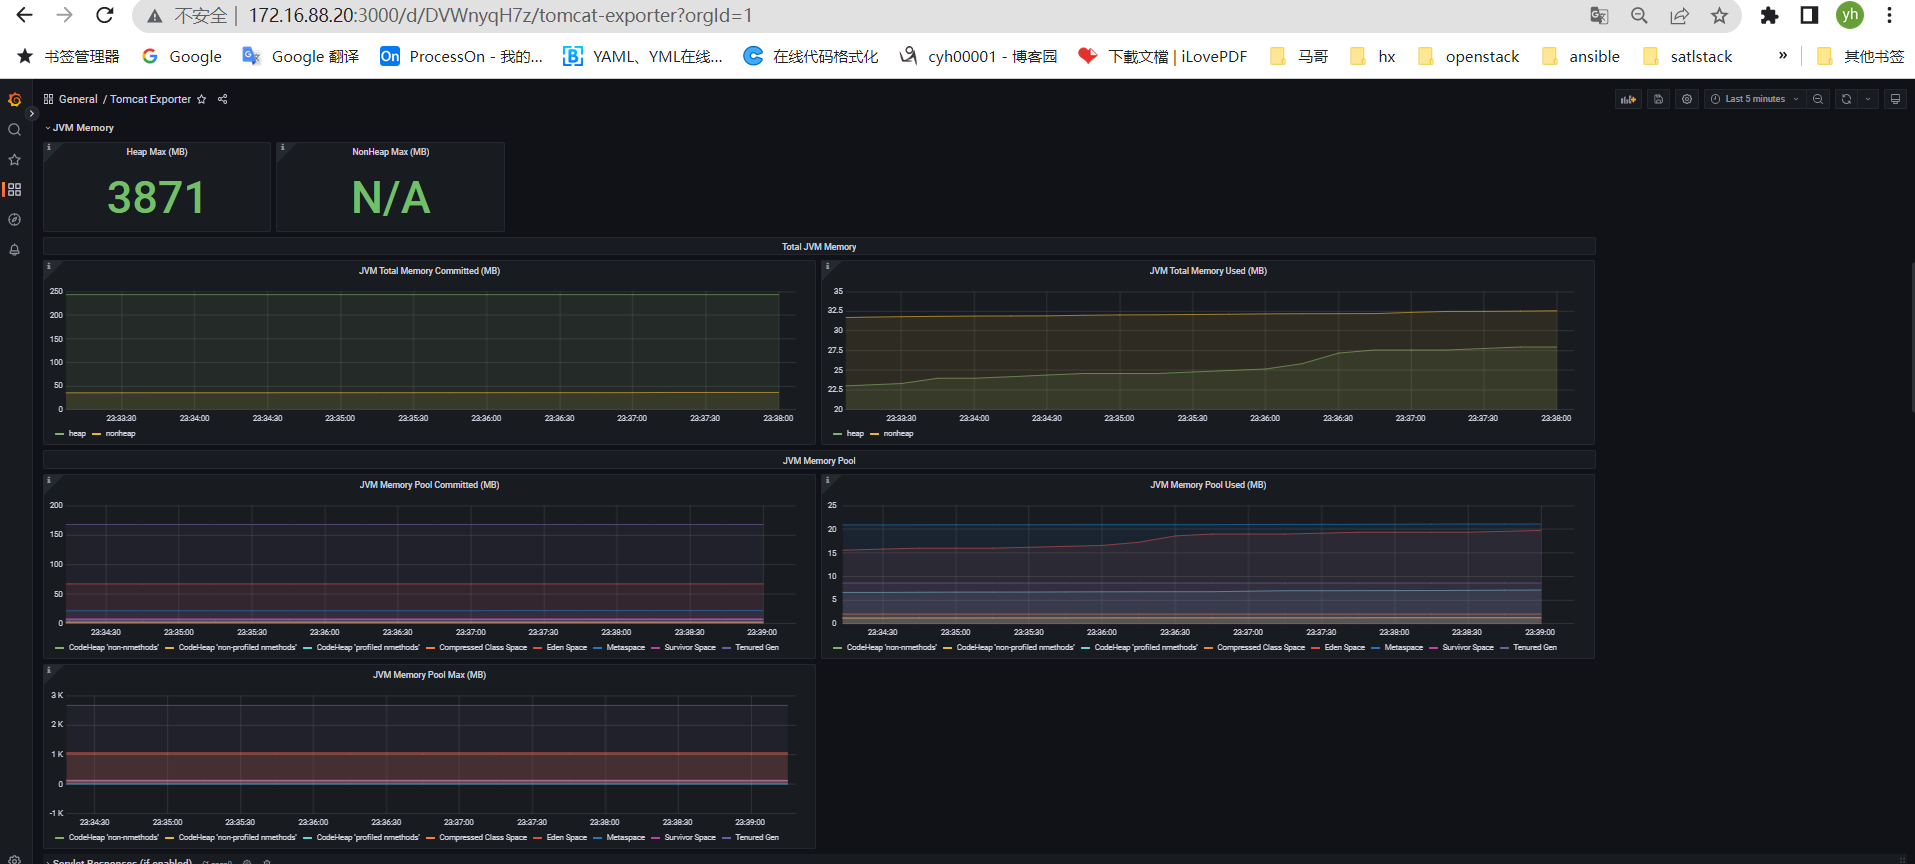
五、监控redis服务
5.1、准备部署文件
cat redis-deployment.yaml
apiVersion: apps/v1
kind: Deployment
metadata:
  name: redis
  namespace: studylinux-net
spec:
  replicas: 1
  selector:
    matchLabels:
      app: redis
  template:
    metadata:
      labels:
        app: redis
    spec:
      containers:
      - name: redis
        image: redis:4.0.14
        resources:
          requests:
            cpu: 100m
            memory: 100Mi
        ports:
        - containerPort: 6379
      - name: redis-exporter
        image: oliver006/redis_exporter:latest
        resources:
          requests:
            cpu: 100m
            memory: 100Mi
        ports:
        - containerPort: 9121
cat redis-exporter-svc.yaml
kind: Service  #service 类型
apiVersion: v1
metadata:
  annotations:
    prometheus.io/scrape: 'true'
    prometheus.io/port: "9121"
  name: redis-exporter-service
  namespace: studylinux-net
spec:
  selector:
    app: redis
  ports:
  - nodePort: 31082
    name: prom
    port: 9121
    protocol: TCP
    targetPort: 9121
  type: NodePort
cat redis-redis-svc.yaml
kind: Service  #service 类型
apiVersion: v1
metadata:
#  annotations:
#    prometheus.io/scrape: 'false'
  name: redis-redis-service
  namespace: studylinux-net
spec:
  selector:
    app: redis
  ports:
  - nodePort: 31081
    name: redis
    port: 6379
    protocol: TCP
    targetPort: 6379
  type: NodePort
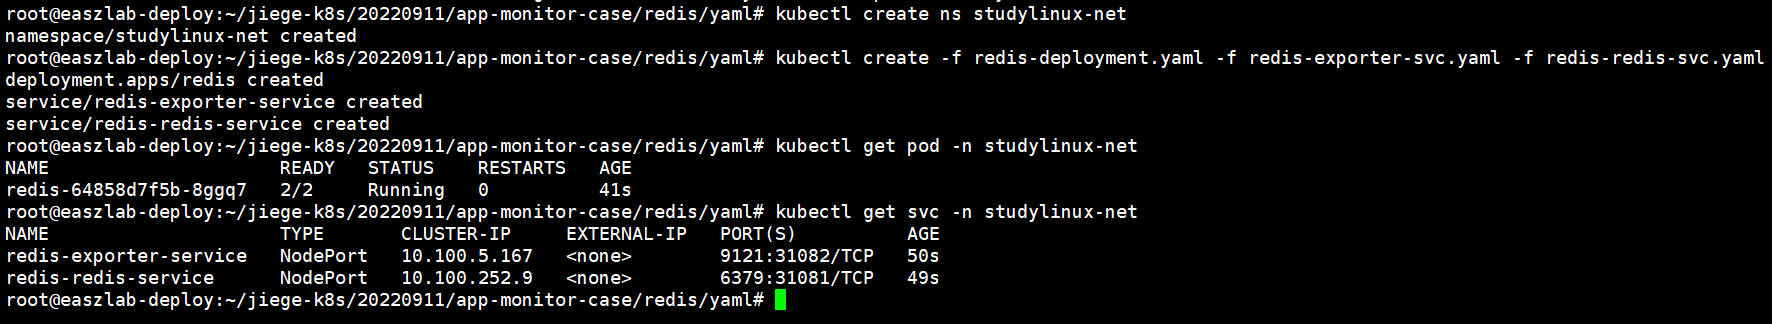
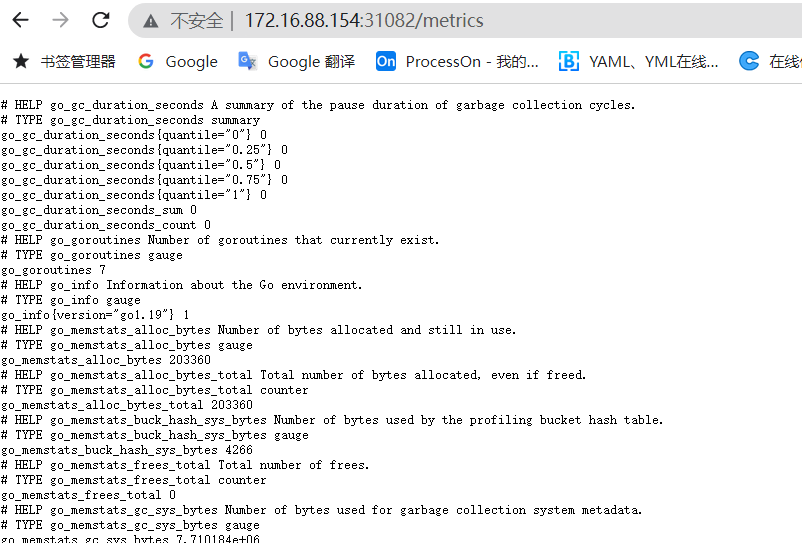
5.2、配置Prometheus文件
#tomcat服务采集
  - job_name: "tomcat-monitor-metrics"
    static_configs:
      - targets: ["172.16.88.154:31080"]

#redis服务采集
  - job_name: "redis-monitor-metrics"
    static_configs:
      - targets: ["172.16.88.154:31082"]
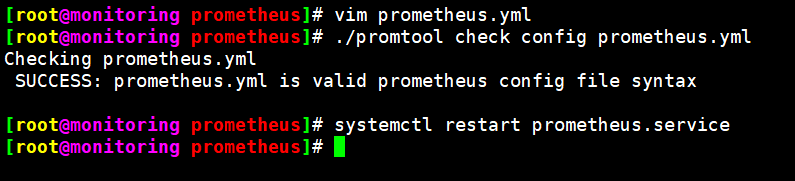
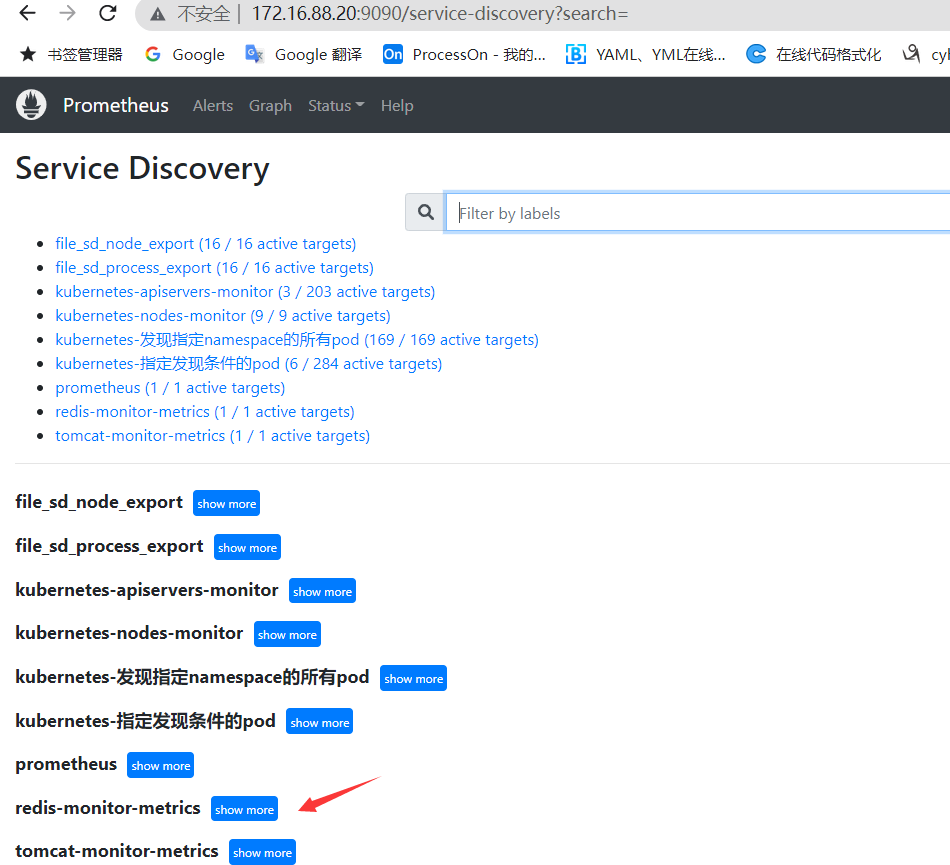
5.3、导入模板
{ "annotations": { "list": [ { "builtIn": 1, "datasource": "-- Grafana --", "enable": true, "hide": true, "iconColor": "rgba(0, 211, 255, 1)", "name": "Annotations & Alerts", "type": "dashboard" } ] }, "description": "Prometheus dashboard for Redis servers", "editable": true, "gnetId": 763, "graphTooltip": 0, "id": 50, "iteration": 1571393060553, "links": [], "panels": [ { "cacheTimeout": null, "colorBackground": false, "colorValue": false, "colors": [ "rgba(245, 54, 54, 0.9)", "rgba(237, 129, 40, 0.89)", "rgba(50, 172, 45, 0.97)" ], "datasource": "Prometheus", "decimals": 0, "editable": true, "error": false, "format": "s", "gauge": { "maxValue": 100, "minValue": 0, "show": false, "thresholdLabels": false, "thresholdMarkers": true }, "gridPos": { "h": 7, "w": 3, "x": 0, "y": 0 }, "id": 9, "interval": null, "isNew": true, "links": [], "mappingType": 1, "mappingTypes": [ { "name": "value to text", "value": 1 }, { "name": "range to text", "value": 2 } ], "maxDataPoints": 100, "nullPointMode": "connected", "nullText": null, "options": {}, "postfix": "", "postfixFontSize": "50%", "prefix": "", "prefixFontSize": "50%", "rangeMaps": [ { "from": "null", "text": "N/A", "to": "null" } ], "sparkline": { "fillColor": "rgba(31, 118, 189, 0.18)", "full": false, "lineColor": "rgb(31, 120, 193)", "show": false }, "tableColumn": "", "targets": [ { "expr": "redis_uptime_in_seconds{instance=~\"$node\"}", "format": "time_series", "intervalFactor": 2, "legendFormat": "", "metric": "", "refId": "A", "step": 1800 } ], "thresholds": "", "title": "Uptime", "type": "singlestat", "valueFontSize": "70%", "valueMaps": [ { "op": "=", "text": "N/A", "value": "null" } ], "valueName": "avg" }, { "cacheTimeout": null, "colorBackground": false, "colorValue": false, "colors": [ "rgba(50, 172, 45, 0.97)", "rgba(237, 129, 40, 0.89)", "rgba(245, 54, 54, 0.9)" ], "datasource": "Prometheus", "decimals": 0, "editable": true, "error": false, "format": "percent", "gauge": { "maxValue": 100, "minValue": 0, "show": true, "thresholdLabels": false, "thresholdMarkers": true }, "gridPos": { "h": 7, "w": 5, "x": 3, "y": 0 }, "hideTimeOverride": true, "id": 11, "interval": null, "isNew": true, "links": [], "mappingType": 1, "mappingTypes": [ { "name": "value to text", "value": 1 }, { "name": "range to text", "value": 2 } ], "maxDataPoints": 100, "nullPointMode": "connected", "nullText": null, "options": {}, "postfix": "", "postfixFontSize": "50%", "prefix": "", "prefixFontSize": "50%", "rangeMaps": [ { "from": "null", "text": "N/A", "to": "null" } ], "sparkline": { "fillColor": "rgba(31, 118, 189, 0.18)", "full": false, "lineColor": "rgb(31, 120, 193)", "show": true }, "tableColumn": "", "targets": [ { "expr": "100 * (redis_memory_used_bytes{instance=~\"$node\"} / redis_config_maxmemory{instance=~\"$node\"} )", "format": "time_series", "intervalFactor": 2, "legendFormat": "", "metric": "", "refId": "A", "step": 2 } ], "thresholds": "80,95", "timeFrom": "1m", "timeShift": null, "title": "Memory Usage", "type": "singlestat", "valueFontSize": "80%", "valueMaps": [ { "op": "=", "text": "N/A", "value": "null" } ], "valueName": "current" }, { "aliasColors": {}, "bars": false, "dashLength": 10, "dashes": false, "datasource": "Prometheus", "editable": true, "error": false, "fill": 1, "fillGradient": 0, "grid": {}, "gridPos": { "h": 7, "w": 8, "x": 8, "y": 0 }, "id": 2, "isNew": true, "legend": { "avg": false, "current": false, "max": false, "min": false, "show": false, "total": false, "values": false }, "lines": true, "linewidth": 2, "links": [], "nullPointMode": "connected", "options": { "dataLinks": [] }, "percentage": false, "pointradius": 5, "points": false, "renderer": "flot", "seriesOverrides": [], "spaceLength": 10, "stack": false, "steppedLine": false, "targets": [ { "expr": "rate(redis_commands_processed_total{instance=~\"$node\"}[5m])", "format": "time_series", "interval": "", "intervalFactor": 2, "legendFormat": "", "metric": "A", "refId": "A", "step": 240, "target": "" } ], "thresholds": [], "timeFrom": null, "timeRegions": [], "timeShift": null, "title": "Commands Executed / sec", "tooltip": { "msResolution": false, "shared": true, "sort": 0, "value_type": "cumulative" }, "type": "graph", "xaxis": { "buckets": null, "mode": "time", "name": null, "show": true, "values": [] }, "yaxes": [ { "format": "short", "label": null, "logBase": 1, "max": null, "min": null, "show": true }, { "format": "short", "label": null, "logBase": 1, "max": null, "min": null, "show": true } ], "yaxis": { "align": false, "alignLevel": null } }, { "aliasColors": {}, "bars": false, "dashLength": 10, "dashes": false, "datasource": "Prometheus", "decimals": 2, "editable": true, "error": false, "fill": 1, "fillGradient": 0, "grid": {}, "gridPos": { "h": 7, "w": 8, "x": 16, "y": 0 }, "id": 1, "isNew": true, "legend": { "avg": false, "current": false, "max": false, "min": false, "show": false, "total": false, "values": false }, "lines": true, "linewidth": 2, "links": [], "nullPointMode": "connected", "options": { "dataLinks": [] }, "percentage": true, "pointradius": 5, "points": false, "renderer": "flot", "seriesOverrides": [], "spaceLength": 10, "stack": false, "steppedLine": false, "targets": [ { "expr": "irate(redis_keyspace_hits_total{instance=~\"$node\"}[5m])", "format": "time_series", "hide": false, "interval": "", "intervalFactor": 2, "legendFormat": "hits", "metric": "", "refId": "A", "step": 240, "target": "" }, { "expr": "irate(redis_keyspace_misses_total{instance=~\"$node\"}[5m])", "format": "time_series", "hide": false, "interval": "", "intervalFactor": 2, "legendFormat": "misses", "metric": "", "refId": "B", "step": 240, "target": "" } ], "thresholds": [], "timeFrom": null, "timeRegions": [], "timeShift": null, "title": "Hits / Misses per Sec", "tooltip": { "msResolution": false, "shared": true, "sort": 0, "value_type": "individual" }, "type": "graph", "xaxis": { "buckets": null, "mode": "time", "name": null, "show": true, "values": [] }, "yaxes": [ { "format": "short", "label": "", "logBase": 1, "max": null, "min": 0, "show": true }, { "format": "short", "label": null, "logBase": 1, "max": null, "min": null, "show": true } ], "yaxis": { "align": false, "alignLevel": null } }, { "cacheTimeout": null, "colorBackground": false, "colorValue": false, "colors": [ "#299c46", "rgba(237, 129, 40, 0.89)", "#d44a3a" ], "datasource": "Prometheus", "format": "none", "gauge": { "maxValue": 100, "minValue": 0, "show": false, "thresholdLabels": false, "thresholdMarkers": true }, "gridPos": { "h": 7, "w": 3, "x": 0, "y": 7 }, "id": 16, "interval": null, "links": [], "mappingType": 1, "mappingTypes": [ { "name": "value to text", "value": 1 }, { "name": "range to text", "value": 2 } ], "maxDataPoints": 100, "nullPointMode": "connected", "nullText": null, "options": {}, "postfix": "", "postfixFontSize": "50%", "prefix": "", "prefixFontSize": "50%", "rangeMaps": [ { "from": "null", "text": "N/A", "to": "null" } ], "sparkline": { "fillColor": "rgba(31, 118, 189, 0.18)", "full": false, "lineColor": "rgb(31, 120, 193)", "show": false }, "tableColumn": "", "targets": [ { "expr": "redis_connected_slaves{instance=~\"$node\"}", "format": "time_series", "intervalFactor": 1, "legendFormat": "", "refId": "A" } ], "thresholds": "", "title": "slaves", "type": "singlestat", "valueFontSize": "80%", "valueMaps": [ { "op": "=", "text": "N/A", "value": "null" } ], "valueName": "avg" }, { "cacheTimeout": null, "colorBackground": false, "colorValue": false, "colors": [ "rgba(245, 54, 54, 0.9)", "rgba(237, 129, 40, 0.89)", "rgba(50, 172, 45, 0.97)" ], "datasource": "Prometheus", "decimals": 0, "editable": true, "error": false, "format": "none", "gauge": { "maxValue": 100, "minValue": 0, "show": false, "thresholdLabels": false, "thresholdMarkers": true }, "gridPos": { "h": 7, "w": 4, "x": 3, "y": 7 }, "hideTimeOverride": true, "id": 12, "interval": null, "isNew": true, "links": [], "mappingType": 1, "mappingTypes": [ { "name": "value to text", "value": 1 }, { "name": "range to text", "value": 2 } ], "maxDataPoints": 100, "nullPointMode": "connected", "nullText": null, "options": {}, "postfix": "", "postfixFontSize": "50%", "prefix": "", "prefixFontSize": "50%", "rangeMaps": [ { "from": "null", "text": "N/A", "to": "null" } ], "sparkline": { "fillColor": "rgba(31, 118, 189, 0.18)", "full": false, "lineColor": "rgb(31, 120, 193)", "show": true }, "tableColumn": "", "targets": [ { "expr": "redis_connected_clients{instance=~\"$node\"}", "format": "time_series", "intervalFactor": 2, "legendFormat": "", "metric": "", "refId": "A", "step": 2 } ], "thresholds": "", "timeFrom": "1m", "timeShift": null, "title": "Clients", "type": "singlestat", "valueFontSize": "80%", "valueMaps": [ { "op": "=", "text": "N/A", "value": "null" } ], "valueName": "current" }, { "cacheTimeout": null, "colorBackground": false, "colorValue": false, "colors": [ "#629e51", "rgba(237, 129, 40, 0.89)", "#d44a3a" ], "datasource": "Prometheus", "decimals": 0, "format": "percent", "gauge": { "maxValue": 100, "minValue": 0, "show": true, "thresholdLabels": false, "thresholdMarkers": true }, "gridPos": { "h": 7, "w": 5, "x": 7, "y": 7 }, "id": 18, "interval": null, "links": [], "mappingType": 1, "mappingTypes": [ { "name": "value to text", "value": 1 }, { "name": "range to text", "value": 2 } ], "maxDataPoints": 100, "nullPointMode": "connected", "nullText": null, "options": {}, "postfix": "", "postfixFontSize": "50%", "prefix": "", "prefixFontSize": "50%", "rangeMaps": [ { "from": "null", "text": "N/A", "to": "null" } ], "sparkline": { "fillColor": "rgba(31, 118, 189, 0.18)", "full": false, "lineColor": "rgb(31, 120, 193)", "show": false }, "tableColumn": "", "targets": [ { "expr": " redis_connected_clients{instance=~\"$node\"} / redis_config_maxclients{instance=~\"$node\"}", "format": "time_series", "intervalFactor": 1, "legendFormat": "", "refId": "A" } ], "thresholds": "80,90", "title": "connections used", "type": "singlestat", "valueFontSize": "80%", "valueMaps": [ { "op": "=", "text": "N/A", "value": "null" } ], "valueName": "current" }, { "aliasColors": {}, "bars": false, "dashLength": 10, "dashes": false, "datasource": "Prometheus", "editable": true, "error": false, "fill": 1, "fillGradient": 0, "grid": {}, "gridPos": { "h": 7, "w": 12, "x": 12, "y": 7 }, "id": 10, "isNew": true, "legend": { "avg": false, "current": false, "max": false, "min": false, "show": true, "total": false, "values": false }, "lines": true, "linewidth": 2, "links": [], "nullPointMode": "connected", "options": { "dataLinks": [] }, "percentage": false, "pointradius": 5, "points": false, "renderer": "flot", "seriesOverrides": [], "spaceLength": 10, "stack": false, "steppedLine": false, "targets": [ { "expr": "rate(redis_net_input_bytes_total{instance=~\"$node\"}[5m])", "format": "time_series", "intervalFactor": 2, "legendFormat": "{{ input }}", "refId": "A", "step": 240 }, { "expr": "rate(redis_net_output_bytes_total{instance=~\"$node\"}[5m])", "format": "time_series", "interval": "", "intervalFactor": 2, "legendFormat": "{{ output }}", "refId": "B", "step": 240 } ], "thresholds": [], "timeFrom": null, "timeRegions": [], "timeShift": null, "title": "Network I/O", "tooltip": { "msResolution": true, "shared": true, "sort": 0, "value_type": "cumulative" }, "type": "graph", "xaxis": { "buckets": null, "mode": "time", "name": null, "show": true, "values": [] }, "yaxes": [ { "format": "bytes", "label": null, "logBase": 1, "max": null, "min": null, "show": true }, { "format": "short", "label": null, "logBase": 1, "max": null, "min": null, "show": true } ], "yaxis": { "align": false, "alignLevel": null } }, { "aliasColors": { "max": "#BF1B00" }, "bars": false, "dashLength": 10, "dashes": false, "datasource": "Prometheus", "editable": true, "error": false, "fill": 1, "fillGradient": 0, "grid": {}, "gridPos": { "h": 7, "w": 12, "x": 0, "y": 14 }, "id": 7, "isNew": true, "legend": { "avg": false, "current": false, "hideEmpty": false, "hideZero": false, "max": false, "min": false, "show": true, "total": false, "values": false }, "lines": true, "linewidth": 2, "links": [], "nullPointMode": "null as zero", "options": { "dataLinks": [] }, "percentage": false, "pointradius": 5, "points": false, "renderer": "flot", "seriesOverrides": [], "spaceLength": 10, "stack": false, "steppedLine": false, "targets": [ { "expr": "redis_memory_used_bytes{instance=~\"$node\"} ", "format": "time_series", "intervalFactor": 2, "legendFormat": "used", "metric": "", "refId": "A", "step": 240, "target": "" }, { "expr": "redis_config_maxmemory{instance=~\"$node\"} ", "format": "time_series", "hide": false, "intervalFactor": 2, "legendFormat": "max", "refId": "B", "step": 240 } ], "thresholds": [], "timeFrom": null, "timeRegions": [], "timeShift": null, "title": "Total Memory Usage", "tooltip": { "msResolution": false, "shared": true, "sort": 0, "value_type": "cumulative" }, "type": "graph", "xaxis": { "buckets": null, "mode": "time", "name": null, "show": true, "values": [] }, "yaxes": [ { "format": "bytes", "label": null, "logBase": 1, "max": null, "min": 0, "show": true }, { "format": "short", "label": null, "logBase": 1, "max": null, "min": null, "show": true } ], "yaxis": { "align": false, "alignLevel": null } }, { "aliasColors": {}, "bars": false, "dashLength": 10, "dashes": false, "datasource": "Prometheus", "editable": true, "error": false, "fill": 7, "fillGradient": 0, "grid": {}, "gridPos": { "h": 7, "w": 12, "x": 12, "y": 14 }, "id": 13, "isNew": true, "legend": { "avg": false, "current": false, "max": false, "min": false, "show": true, "total": false, "values": false }, "lines": true, "linewidth": 2, "links": [], "nullPointMode": "connected", "options": { "dataLinks": [] }, "percentage": false, "pointradius": 5, "points": false, "renderer": "flot", "seriesOverrides": [], "spaceLength": 10, "stack": true, "steppedLine": false, "targets": [ { "expr": "sum (redis_db_keys{instance=~\"$node\"}) - sum (redis_db_keys_expiring{instance=~\"$node\"}) ", "format": "time_series", "interval": "", "intervalFactor": 2, "legendFormat": "not expiring", "refId": "A", "step": 240, "target": "" }, { "expr": "sum (redis_db_keys_expiring{instance=~\"$node\"}) ", "format": "time_series", "interval": "", "intervalFactor": 2, "legendFormat": "expiring", "metric": "", "refId": "B", "step": 240 } ], "thresholds": [], "timeFrom": null, "timeRegions": [], "timeShift": null, "title": "Expiring vs Not-Expiring Keys", "tooltip": { "msResolution": false, "shared": true, "sort": 0, "value_type": "individual" }, "type": "graph", "xaxis": { "buckets": null, "mode": "time", "name": null, "show": true, "values": [] }, "yaxes": [ { "format": "short", "label": null, "logBase": 1, "max": null, "min": null, "show": true }, { "format": "short", "label": null, "logBase": 1, "max": null, "min": null, "show": true } ], "yaxis": { "align": false, "alignLevel": null } }, { "aliasColors": {}, "bars": false, "dashLength": 10, "dashes": false, "datasource": "Prometheus", "editable": true, "error": false, "fill": 7, "fillGradient": 0, "grid": {}, "gridPos": { "h": 7, "w": 12, "x": 0, "y": 21 }, "id": 5, "isNew": true, "legend": { "alignAsTable": true, "avg": false, "current": true, "max": false, "min": false, "rightSide": true, "show": true, "total": false, "values": true }, "lines": true, "linewidth": 2, "links": [], "nullPointMode": "connected", "options": { "dataLinks": [] }, "percentage": false, "pointradius": 5, "points": false, "renderer": "flot", "seriesOverrides": [], "spaceLength": 10, "stack": true, "steppedLine": false, "targets": [ { "expr": "sum (redis_db_keys{instance=~\"$node\"}) by (db)", "format": "time_series", "interval": "", "intervalFactor": 2, "legendFormat": "{{ db }} ", "refId": "A", "step": 240, "target": "" } ], "thresholds": [], "timeFrom": null, "timeRegions": [], "timeShift": null, "title": "Total Items per DB", "tooltip": { "msResolution": false, "shared": true, "sort": 0, "value_type": "individual" }, "type": "graph", "xaxis": { "buckets": null, "mode": "time", "name": null, "show": true, "values": [] }, "yaxes": [ { "format": "none", "label": null, "logBase": 1, "max": null, "min": null, "show": true }, { "format": "short", "label": null, "logBase": 1, "max": null, "min": null, "show": true } ], "yaxis": { "align": false, "alignLevel": null } }, { "aliasColors": {}, "bars": false, "dashLength": 10, "dashes": false, "datasource": "Prometheus", "editable": true, "error": false, "fill": 8, "fillGradient": 0, "grid": {}, "gridPos": { "h": 7, "w": 12, "x": 12, "y": 21 }, "id": 14, "isNew": true, "legend": { "avg": false, "current": false, "max": false, "min": false, "show": true, "total": false, "values": false }, "lines": true, "linewidth": 1, "links": [], "nullPointMode": "connected", "options": { "dataLinks": [] }, "percentage": false, "pointradius": 5, "points": false, "renderer": "flot", "seriesOverrides": [], "spaceLength": 10, "stack": true, "steppedLine": false, "targets": [ { "expr": "topk(5, irate(redis_command_call_duration_seconds_count{instance=~\"$node\"} [1m]))", "format": "time_series", "interval": "", "intervalFactor": 2, "legendFormat": "{{ cmd }}", "metric": "redis_command_calls_total", "refId": "A", "step": 240 } ], "thresholds": [], "timeFrom": null, "timeRegions": [], "timeShift": null, "title": "Command Calls / sec", "tooltip": { "msResolution": true, "shared": true, "sort": 0, "value_type": "cumulative" }, "type": "graph", "xaxis": { "buckets": null, "mode": "time", "name": null, "show": true, "values": [] }, "yaxes": [ { "format": "short", "label": null, "logBase": 1, "max": null, "min": null, "show": true }, { "format": "short", "label": null, "logBase": 1, "max": null, "min": null, "show": true } ], "yaxis": { "align": false, "alignLevel": null } }, { "aliasColors": { "evicts": "#890F02", "memcached_items_evicted_total{instance=\"172.17.0.1:9150\",job=\"prometheus\"}": "#890F02", "reclaims": "#3F6833" }, "bars": false, "dashLength": 10, "dashes": false, "datasource": "Prometheus", "editable": true, "error": false, "fill": 1, "fillGradient": 0, "grid": {}, "gridPos": { "h": 7, "w": 12, "x": 0, "y": 28 }, "id": 8, "isNew": true, "legend": { "avg": false, "current": false, "max": false, "min": false, "show": true, "total": false, "values": false }, "lines": true, "linewidth": 2, "links": [], "nullPointMode": "connected", "options": { "dataLinks": [] }, "percentage": false, "pointradius": 5, "points": false, "renderer": "flot", "seriesOverrides": [ { "alias": "reclaims", "yaxis": 2 } ], "spaceLength": 10, "stack": false, "steppedLine": false, "targets": [ { "expr": "sum(rate(redis_expired_keys_total{instance=~\"$node\"}[5m])) by (addr)", "format": "time_series", "interval": "", "intervalFactor": 2, "legendFormat": "expired", "metric": "", "refId": "A", "step": 240, "target": "" }, { "expr": "sum(rate(redis_evicted_keys_total{instance=~\"$node\"}[5m])) by (addr)", "format": "time_series", "interval": "", "intervalFactor": 2, "legendFormat": "evicted", "refId": "B", "step": 240 } ], "thresholds": [], "timeFrom": null, "timeRegions": [], "timeShift": null, "title": "Expired / Evicted", "tooltip": { "msResolution": false, "shared": true, "sort": 0, "value_type": "cumulative" }, "type": "graph", "xaxis": { "buckets": null, "mode": "time", "name": null, "show": true, "values": [] }, "yaxes": [ { "format": "short", "label": null, "logBase": 1, "max": null, "min": null, "show": true }, { "format": "short", "label": null, "logBase": 1, "max": null, "min": null, "show": true } ], "yaxis": { "align": false, "alignLevel": null } } ], "refresh": "30s", "schemaVersion": 19, "style": "dark", "tags": [ "prometheus", "redis" ], "templating": { "list": [ { "allValue": null, "current": { "text": "HWAndroid", "value": "HWAndroid" }, "datasource": "Prometheus", "definition": "label_values(redis_up{project=~\"dk\"},cluster)", "hide": 0, "includeAll": false, "label": "cluster", "multi": false, "name": "cluster", "options": [], "query": "label_values(redis_up{project=~\"dk\"},cluster)", "refresh": 1, "regex": "", "skipUrlSync": false, "sort": 1, "tagValuesQuery": "", "tags": [], "tagsQuery": "", "type": "query", "useTags": false }, { "allValue": null, "current": { "text": "All", "value": "$__all" }, "datasource": "Prometheus", "definition": "label_values(redis_up{cluster=~\"$cluster\"}, sections)", "hide": 0, "includeAll": true, "label": "区组", "multi": false, "name": "sections", "options": [], "query": "label_values(redis_up{cluster=~\"$cluster\"}, sections)", "refresh": 1, "regex": "", "skipUrlSync": false, "sort": 1, "tagValuesQuery": "", "tags": [], "tagsQuery": "", "type": "query", "useTags": false }, { "allValue": null, "current": { "text": "redis://192.168.1.56:6379", "value": "redis://192.168.1.56:6379" }, "datasource": "Prometheus", "definition": "label_values(redis_up{cluster=~\"$cluster\", sections=~\"$sections\"},instance)", "hide": 0, "includeAll": false, "label": "Node", "multi": false, "name": "node", "options": [], "query": "label_values(redis_up{cluster=~\"$cluster\", sections=~\"$sections\"},instance)", "refresh": 1, "regex": "", "skipUrlSync": false, "sort": 1, "tagValuesQuery": "", "tags": [], "tagsQuery": "", "type": "query", "useTags": false } ] }, "time": { "from": "now-5m", "to": "now" }, "timepicker": { "refresh_intervals": [ "5s", "10s", "30s", "1m", "5m", "15m", "30m", "1h", "2h", "1d" ], "time_options": [ "5m", "15m", "1h", "6h", "12h", "24h", "2d", "7d", "30d" ] }, "timezone": "browser", "title": "Redis Cluster", "uid": "BZRxsw-ik", "version": 1 }
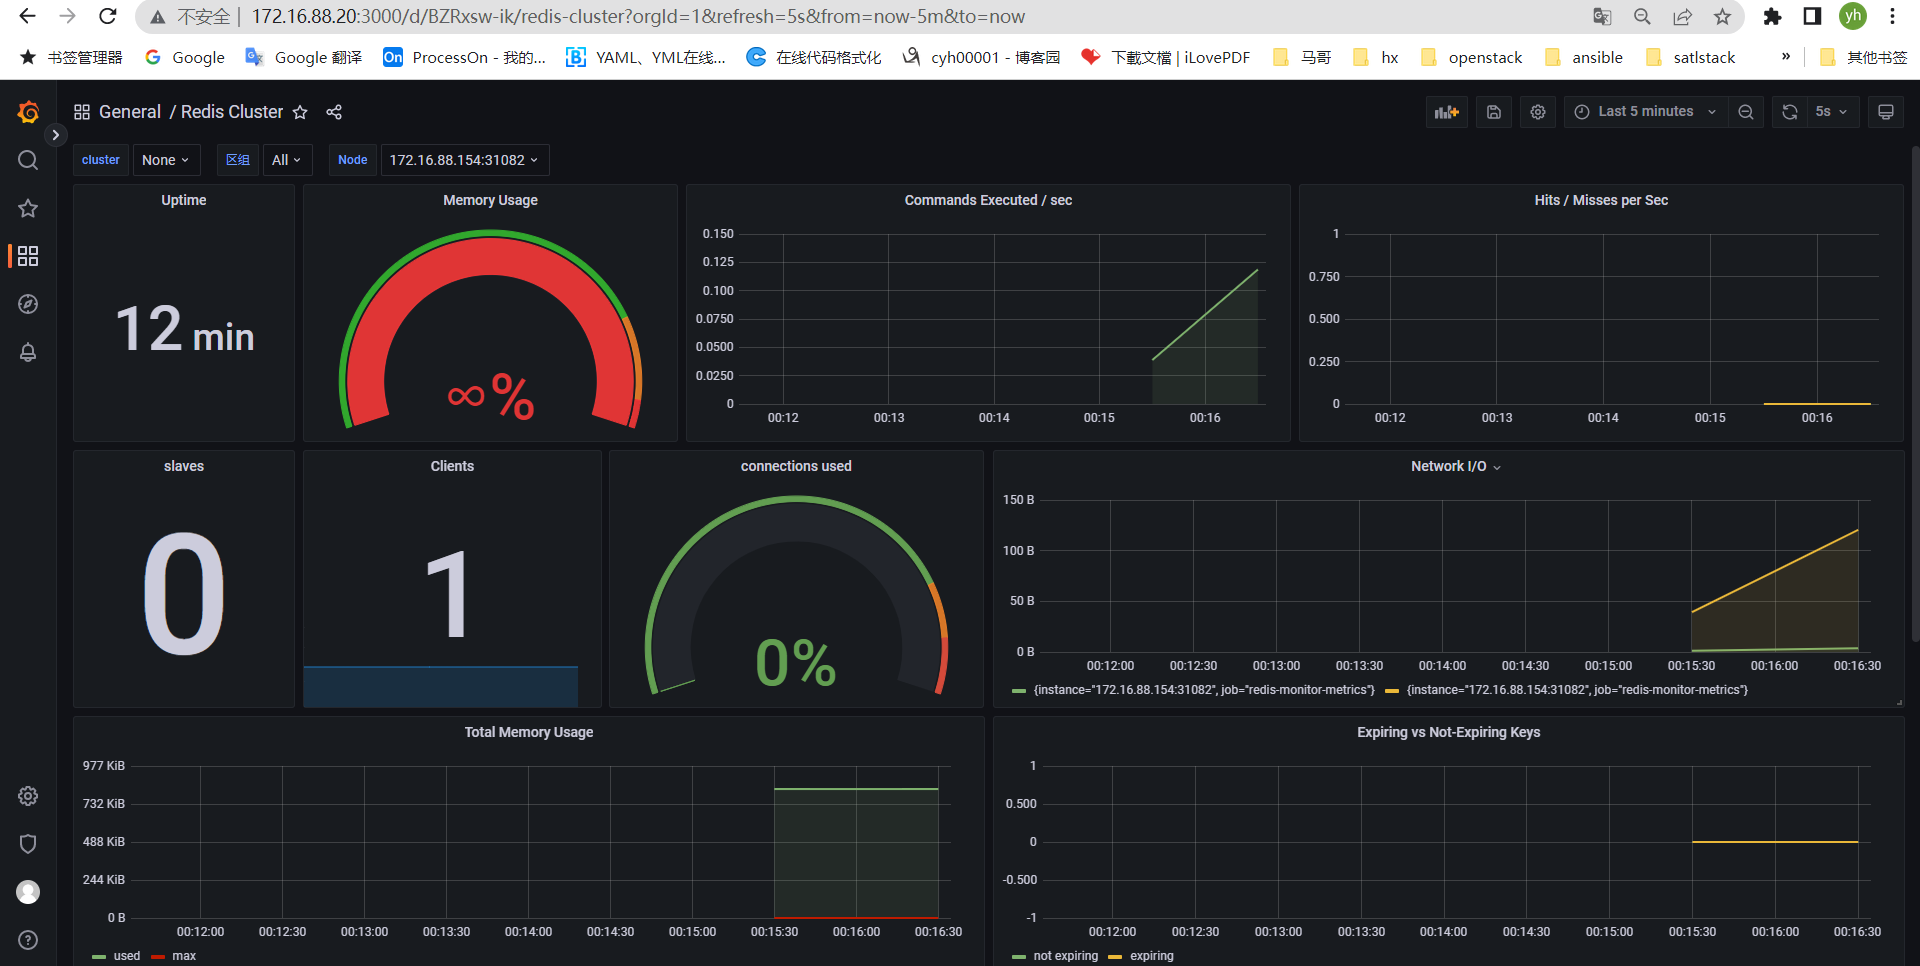
5.4、对redis数据写入测试
准备redis测试脚本,往redis数据库写入部分数据
cat redis_cli.py
#!/usr/bin/env python
#coding:utf-8

import redis
import time
pool = redis.ConnectionPool(host="172.16.88.154", port=31081,db=0,password="")
r = redis.Redis(connection_pool=pool)
for i in range(500):
    r.set("key%s" % i,"value-n70%s"% i)
    #time.sleep(0.1)
    data=r.get("key%s" % i)
    print(data)
redis环境运行准
安装python-redis模块并更新python版本
apt-get install python
apt install python3-pip
pip install redis

修改本地python环境
root@easzlab-deploy:/usr/bin# ll -h python
lrwxrwxrwx 1 root root 16 Jul 26 11:33 python -> /usr/bin/python3*
root@easzlab-deploy:/usr/bin# rm -fr python
root@easzlab-deploy:/usr/bin# ln -s /usr/bin/python3.8 python
root@easzlab-deploy:/usr/bin# ll -h python*
lrwxrwxrwx 1 root root   18 Sep 25 00:31 python -> /usr/bin/python3.8*
lrwxrwxrwx 1 root root    9 Mar 13  2020 python2 -> python2.7*
-rwxr-xr-x 1 root root 3.5M Jul  1 20:27 python2.7*
lrwxrwxrwx 1 root root    9 Mar 13  2020 python3 -> python3.8*
-rwxr-xr-x 1 root root 5.3M Jun 23 04:18 python3.8*
lrwxrwxrwx 1 root root   33 Jun 23 04:18 python3.8-config -> x86_64-linux-gnu-python3.8-config*
lrwxrwxrwx 1 root root   16 Mar 13  2020 python3-config -> python3.8-config*
-rwxr-xr-x 1 root root 2.5K Apr 14  2020 python-argcomplete-check-easy-install-script3*
-rwxr-xr-x 1 root root  314 Apr 14  2020 python-argcomplete-tcsh3*
root@easzlab-deploy:/usr/bin#
5.5、执行redis_cli.py测试数据写入
python redis_cli.py
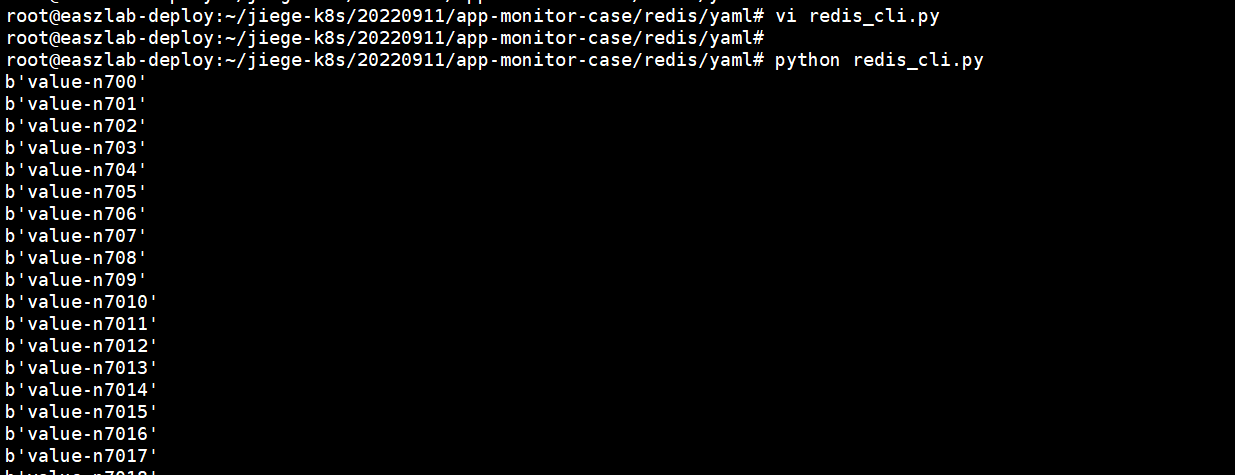
在db1写入500条数据
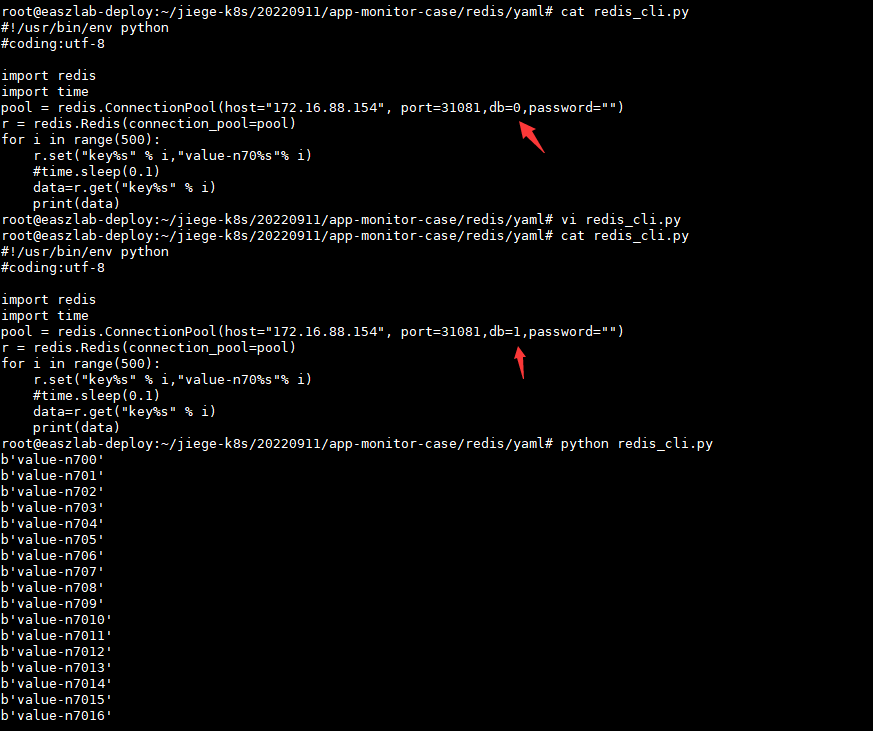
5.6、验证grafana数据
此时查看grafana监控,已发现db0、db1各自写入500条数据
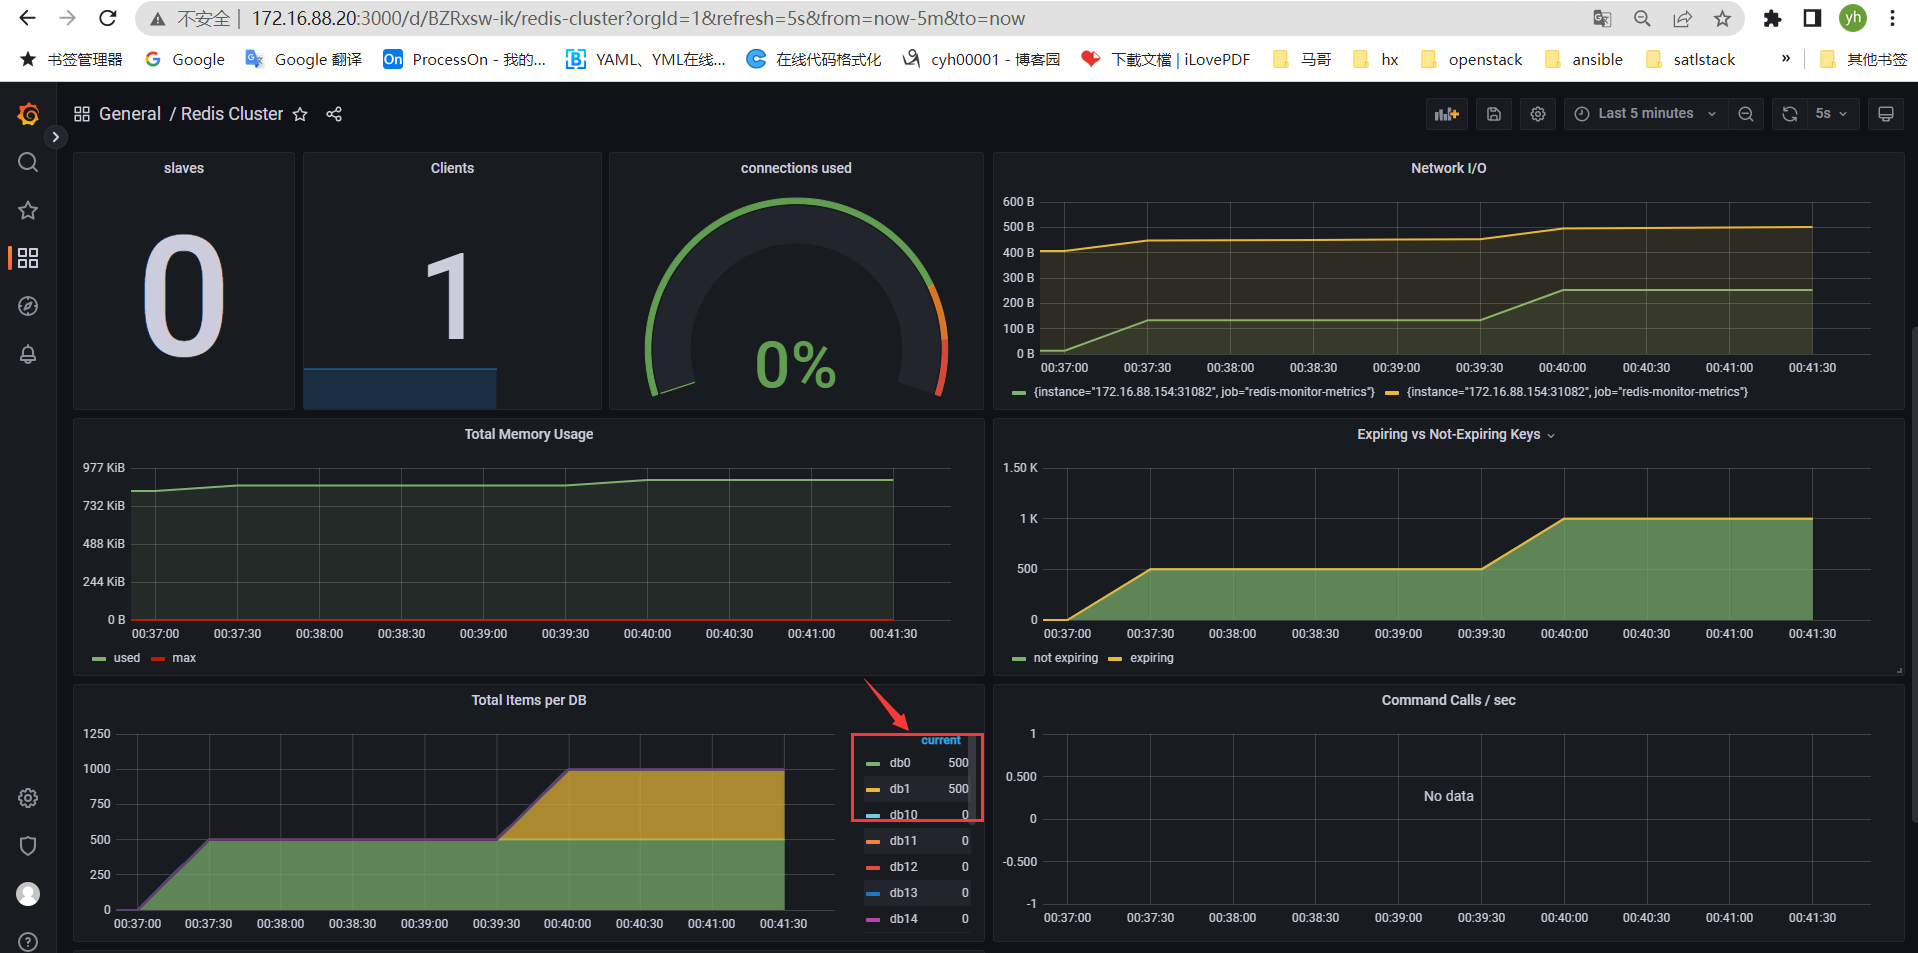
六、监控Haproxy服务
haproxy集群服务部署,略
6.1、安装haproxy-exporter
wget https://github.com/prometheus/haproxy_exporter/releases/download/v0.13.0/haproxy_exporter-0.13.0.linux-amd64.tar.gz
tar -xf haproxy_exporter-0.13.0.linux-amd64.tar.gz -C /opt/
cd /opt/
mv haproxy_exporter-0.13.0.linux-amd64/ haproxy_exporter
cat /etc/systemd/system/haproxy_exporter.service
[Unit]
Description=Prometheus haproxy_exporter daemon
After=network.target

[Service]
Type=simple
User=root
Group=root
ExecStart=/opt/haproxy_exporter/haproxy_exporter --haproxy.scrape-uri="http://admin:admin@172.16.88.200:1080/admin;csv"
Restart=on-failure

[Install]
WantedBy=multi-user.target
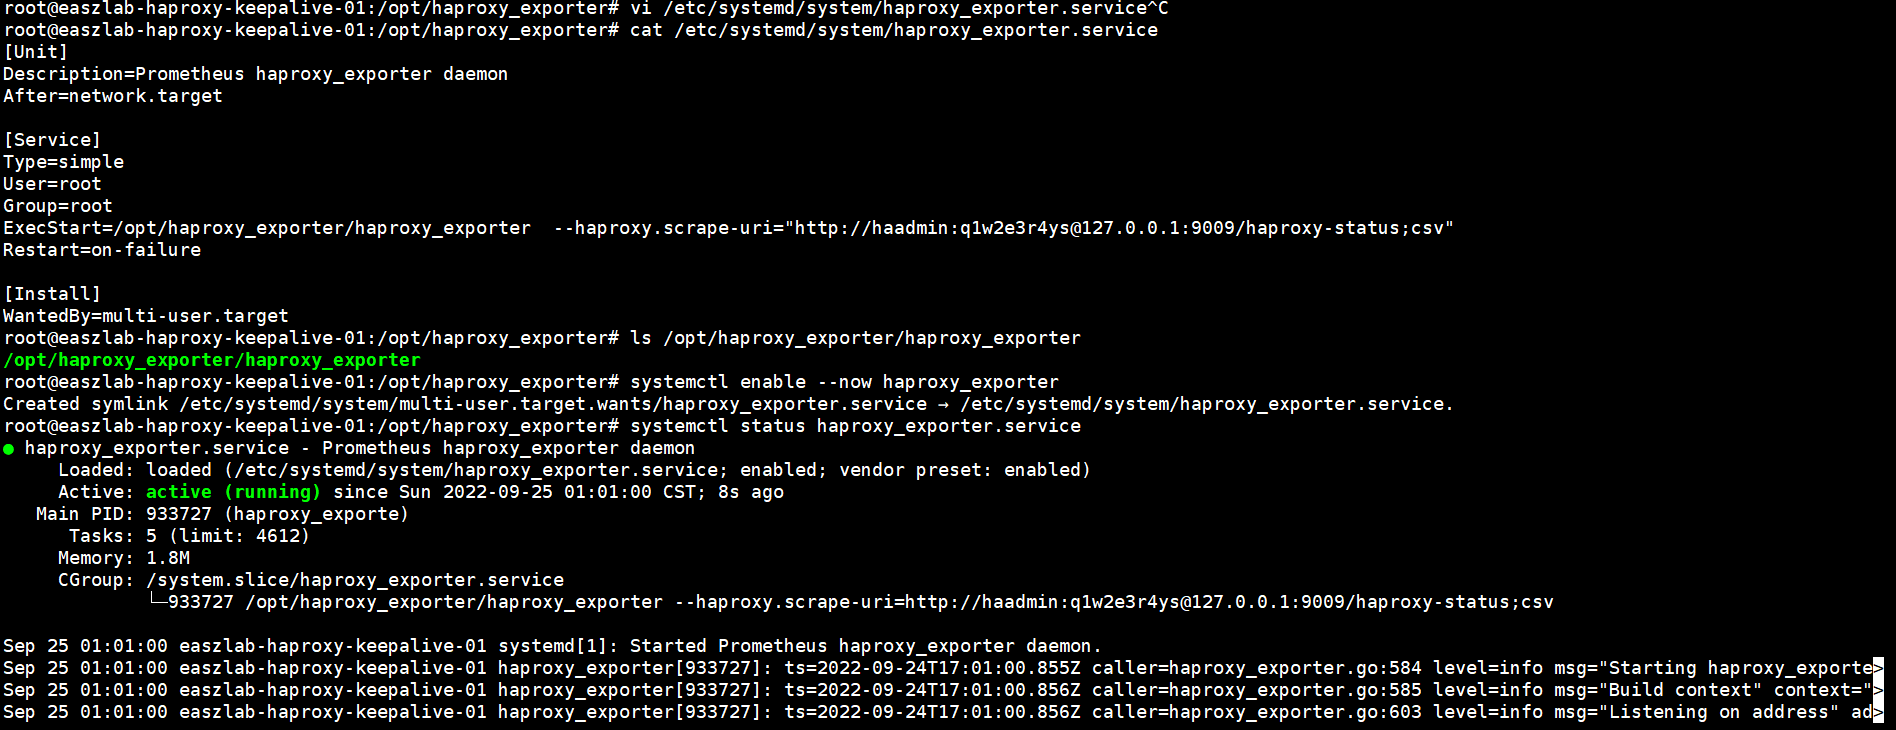
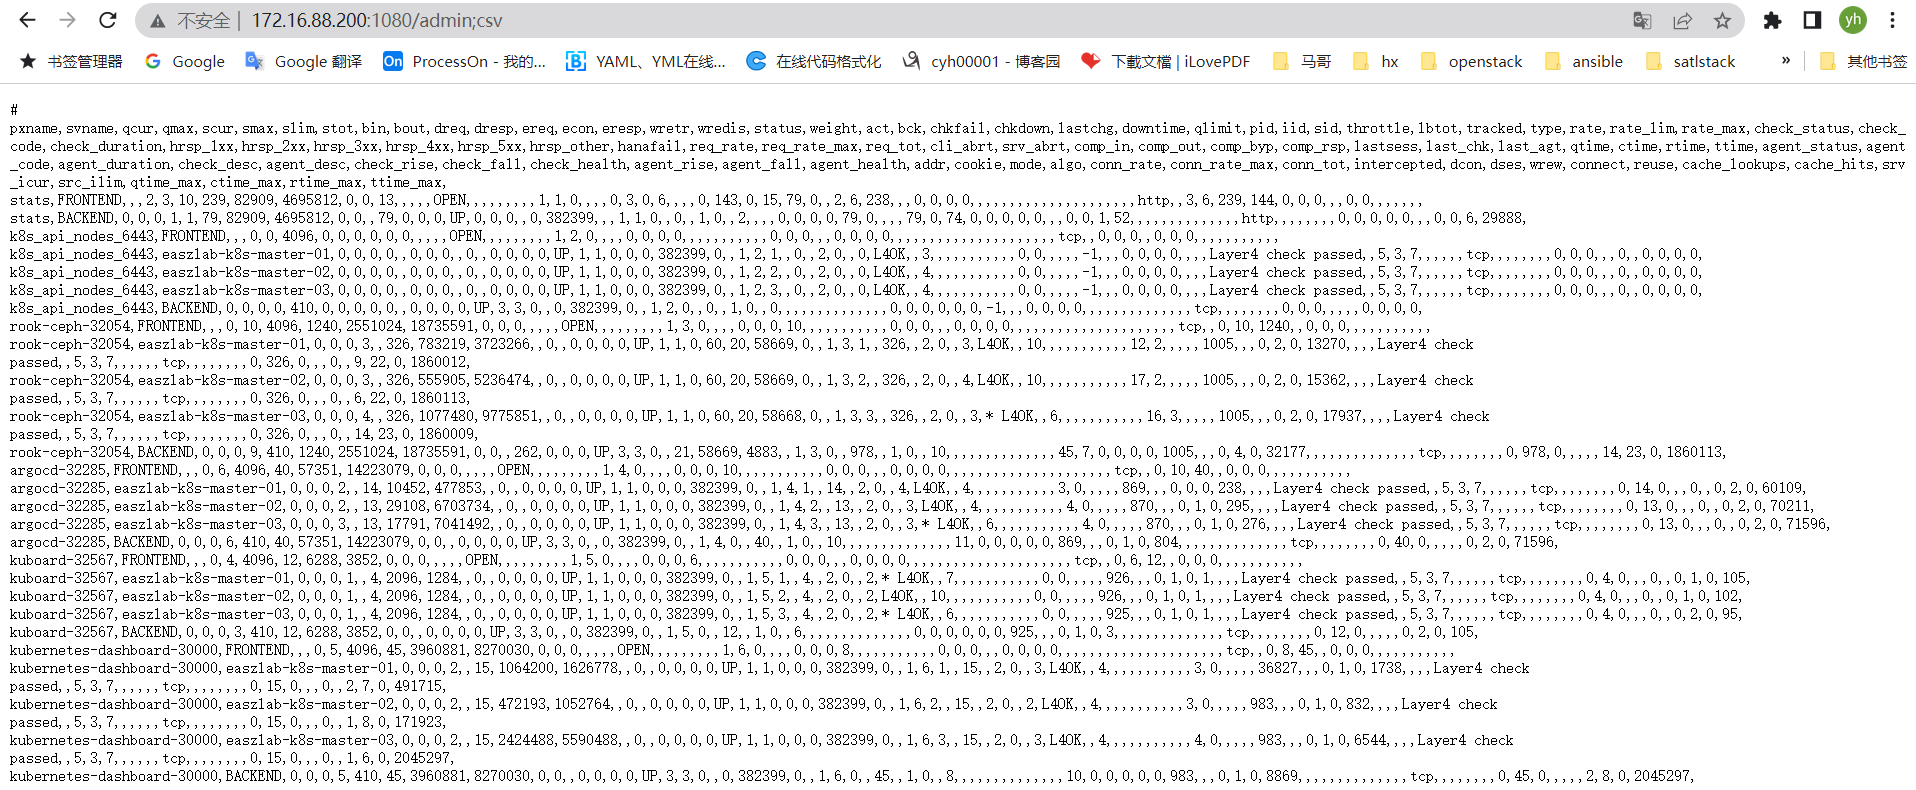
同步文件到其他节点
scp -r haproxy_exporter/ root@172.16.88.152:/opt
scp -r haproxy_exporter/ root@172.16.88.153:/opt
scp /etc/systemd/system/haproxy_exporter.service root@172.16.88.152:/etc/systemd/system/
scp /etc/systemd/system/haproxy_exporter.service root@172.16.88.153:/etc/systemd/system/
启动152、153 haproxy_exporter服务
6.2、验证采集数据
6.3、配置Prometheus
#tomcat服务采集
  - job_name: "tomcat-monitor-metrics"
    static_configs:
      - targets: ["172.16.88.154:31080"]

#redis服务采集
  - job_name: "redis-monitor-metrics"
    static_configs:
      - targets: ["172.16.88.154:31082"]

#haproxy服务采集
  - job_name: "haproxy-monitor-metrics"
    static_configs:
      - targets: ["172.16.88.151:9101","172.16.88.152:9101","172.16.88.153:9101"]
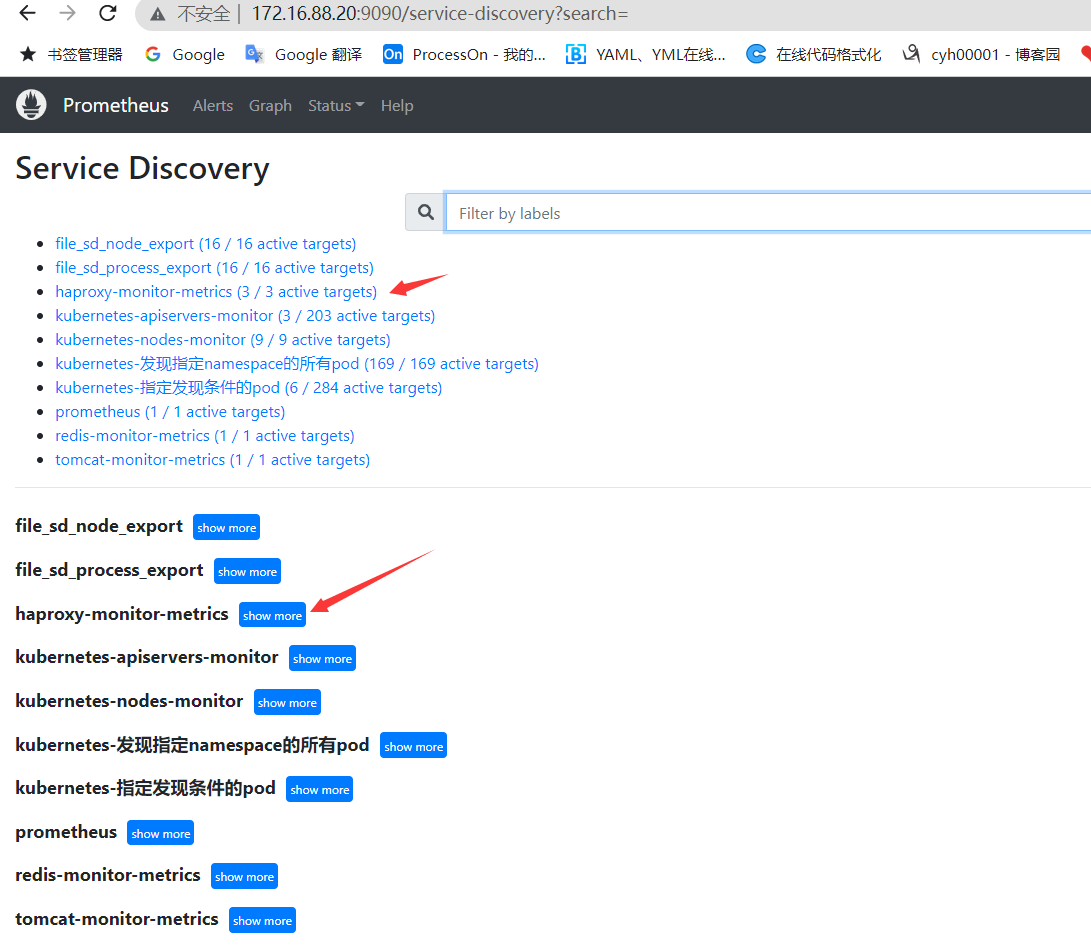
6.4、导入haproxy监控模板