二进制安装部署Grafana+Prometheus+Consul/file_sd_configs(服务发现)+Alertmanage告警
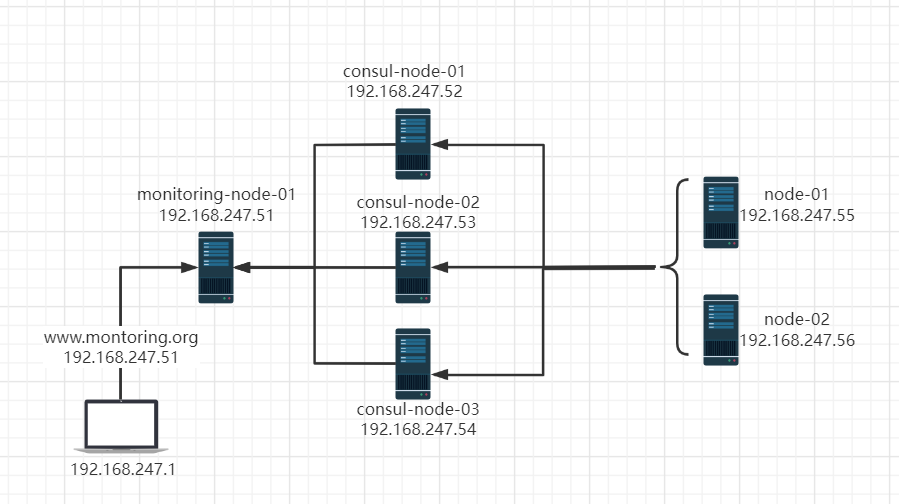
监控网络架构图
一、环境准备以及包下载
192.168.247.51  grafana-prometheus-01   4vcpu 8G 100G  部署:grafana+prometheus+node_export+process-export
192.168.247.52  consul-node-01          2vcpu 2G 100G  部署:consul+node_export+process-export
192.168.247.53  consul-node-02          2vcpu 2G 100G  部署:consul+node_export+process-export
192.168.247.54  consul-node-03          2vcpu 2G 100G  部署:consul+node_export+process-export
192.168.247.55  node-01                 2vcpu 2G 100G  部署:node_export+process-export
192.168.247.56  node-02                 2vcpu 2G 100G  部署:node_export+process-export
修改主机名
hostnamectl set-hostname monitoring-node-01
hostnamectl set-hostname consul-node-01
hostnamectl set-hostname consul-node-02
hostnamectl set-hostname consul-node-03
hostnamectl set-hostname node-01
hostnamectl set-hostname node-02
添加hosts
cat >> /etc/hosts <<EOF
192.168.247.51 monitoring-node-01
192.168.247.52 consul-node-01
192.168.247.53 consul-node-02
192.168.247.54 consul-node-03
192.168.247.55 node-01
192.168.247.56 node-02
EOF
下载所需包
wget https://dl.grafana.com/enterprise/release/grafana-enterprise-9.1.5-1.x86_64.rpm
wget https://github.com/prometheus/node_exporter/releases/download/v1.3.1/node_exporter-1.3.1.linux-amd64.tar.gz
wget https://github.com/ncabatoff/process-exporter/releases/download/v0.7.10/process-exporter-0.7.10.linux-amd64.tar.gz
wget https://github.com/prometheus/prometheus/releases/download/v2.37.1/prometheus-2.37.1.linux-amd64.tar.gz
wget https://github.com/prometheus/consul_exporter/releases/download/v0.8.0/consul_exporter-0.8.0.linux-amd64.tar.gz
scp拷贝安装包到相应节点
二、部署监控节点
[root@monitoring-node-01 ~]# mkdir /opt/{prometheus,node_exporter,process_exporter}
[root@monitoring-node-01 ~]# tar -xf node_exporter-1.3.1.linux-amd64.tar.gz -C /opt/node_exporter/
[root@monitoring-node-01 ~]# tar -xf process-exporter-0.7.10.linux-amd64.tar.gz -C /opt/process_exporter/
[root@monitoring-node-01 ~]# tar -xf prometheus-2.37.1.linux-amd64.tar.gz -C /opt/prometheus/
[root@monitoring-node-01 ~]# yum localinstall grafana-enterprise-9.1.5-1.x86_64.rpm -y
[root@monitoring-node-01 ~]# systemctl enable --now grafana-server
测试grafana http页面 http://<ip>:<port> admin admin

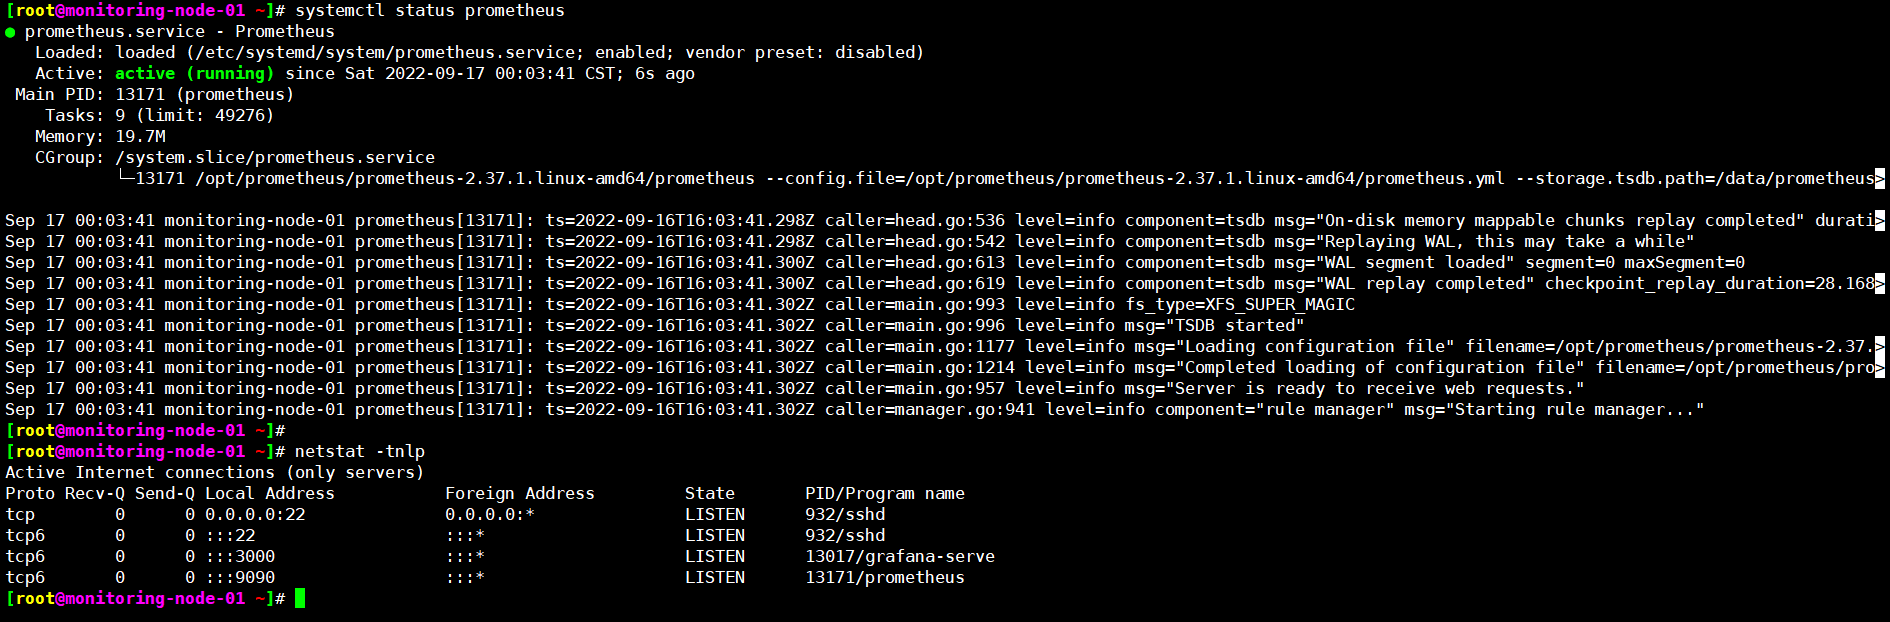
三、配置Prometheus、node_export启动文件
[root@monitoring-node-01 ~]# vi /etc/systemd/system/prometheus.service
[root@monitoring-node-01 ~]# cat /etc/systemd/system/prometheus.service
[Unit]
Description=Prometheus
After=network.target
[Service]
ExecStart=/opt/prometheus/prometheus-2.37.1.linux-amd64/prometheus --config.file=/opt/prometheus/prometheus-2.37.1.linux-amd64/prometheus.yml --storage.tsdb.path=/data/prometheus/data
User=prometheus

[Install]
WantedBy=multi-user.target
[root@monitoring-node-01 ~]#
[root@monitoring-node-01 ~]# mkdir -p /data/prometheus/data
[root@monitoring-node-01 ~]# systemctl daemon-reload
[root@monitoring-node-01 ~]# systemctl enable --now prometheus
Created symlink /etc/systemd/system/multi-user.target.wants/prometheus.service → /etc/systemd/system/prometheus.service.
[root@monitoring-node-01 ~]#
配置node-export、process-export
[root@monitoring-node-01 ~]# cat /etc/systemd/system/node_exporter.service
[Unit]
Description=Prometheus node_exporter daemon
After=network.target

[Service]
Type=simple
User=root
Group=root
ExecStart=/opt/node_exporter/node_exporter-1.3.1.linux-amd64/node_exporter  --collector.tcpstat --web.listen-address=:51234
Restart=on-failure

[Install]
WantedBy=multi-user.target
[root@monitoring-node-01 ~]#


[root@monitoring-node-01 ~]# cat /etc/systemd/system/process_exporter.service
[Unit]
Description=Prometheus Process Exporter
After=network.target

[Service]
ExecStart=/opt/process-exporter/process-exporter-0.7.10.linux-amd64/process-exporter --config.path /opt/process-exporter/process-name.yaml
User=root

[Install]
WantedBy=multi-user.target
[root@monitoring-node-01 ~]#
[root@monitoring-node-01 ~]# cat /opt/process-exporter/process-name.yaml
process_names:
  - name: "{{.Comm}}"
    cmdline:
    - '.+'
  - name: "{{.Matches}}"
    cmdline:
    - 'prometheus'
[root@monitoring-node-01 ~]#
配置注册脚本
[root@monitoring-node-01 ~]# cat /opt/node_exporter/register.sh
HOSTNAME=`hostname`
curl -X PUT -d '{"id":"node_exporter,'$1'","name":"node_exporter","address":"'$1'","meta": {"hostname": "'$HOSTNAME'","business": "test"},"port":51234,"checks": [{"http":"http://'$1':51234/","interval":"5s"}]}' "http://192.168.247.52:8500/v1/agent/service/register"
[root@monitoring-node-01 ~]#
[root@monitoring-node-01 ~]# cat /opt/process-exporter/register.sh
HOSTNAME=`hostname`
curl -X PUT -d '{"id":"process_exporter,'$1'","name":"process_exporter","address":"'$1'","meta": {"hostname": "'$HOSTNAME'"},"port":9256,"checks": [{"http":"http://'$1':9256/","interval":"5s"}]}' "http://192.168.247.52:8500/v1/agent/service/register"
[root@monitoring-node-01 ~]#
[root@monitoring-node-01 ~]#
拷贝node-export、process-export到其他节点
[root@monitoring-node-01 ~]# cd /opt
[root@monitoring-node-01 opt]# scp -r node_exporter/ process-exporter/ root@192.167.247.52:/opt
[root@monitoring-node-01 opt]# scp -r node_exporter/ process-exporter/ root@192.168.247.52:/opt
[root@monitoring-node-01 opt]# scp -r node_exporter/ process-exporter/ root@192.168.247.53:/opt
[root@monitoring-node-01 opt]# scp -r node_exporter/ process-exporter/ root@192.168.247.54:/opt
[root@monitoring-node-01 opt]# scp -r node_exporter/ process-exporter/ root@192.168.247.55:/opt
[root@monitoring-node-01 opt]# scp -r node_exporter/ process-exporter/ root@192.168.247.56:/opt

scp -r /etc/systemd/system/process_exporter.service /etc/systemd/system/node_exporter.service root@192.168.247.52:/etc/systemd/system/
scp -r /etc/systemd/system/process_exporter.service /etc/systemd/system/node_exporter.service root@192.168.247.53:/etc/systemd/system/
scp -r /etc/systemd/system/process_exporter.service /etc/systemd/system/node_exporter.service root@192.168.247.54:/etc/systemd/system/
scp -r /etc/systemd/system/process_exporter.service /etc/systemd/system/node_exporter.service root@192.168.247.55:/etc/systemd/system/
scp -r /etc/systemd/system/process_exporter.service /etc/systemd/system/node_exporter.service root@192.168.247.56:/etc/systemd/system/
四、配置consul集群
因为consul官网有提供rpm安装包,这里选择rpm方式安装consul,方便安装部署
yum install -y yum-utils
yum-config-manager --add-repo https://rpm.releases.hashicorp.com/RHEL/hashicorp.repo
yum install consul -y
systemctl enable --now consul
[root@consul-node-01 ~]# vi /usr/lib/systemd/system/consul.service
[root@consul-node-01 ~]# cat /usr/lib/systemd/system/consul.service
[Unit]
Description="HashiCorp Consul - A service mesh solution"
Documentation=https://www.consul.io/
Requires=network-online.target
After=network-online.target
ConditionFileNotEmpty=/etc/consul.d/consul.hcl

[Service]
EnvironmentFile=-/etc/consul.d/consul.env
User=consul
Group=consul
ExecStart=/usr/bin/consul agent -server -bootstrap-expect=2 -data-dir=/data/consul/data -node=consul-node-01 \
-bind=192.168.247.52 -config-dir=/etc/consul.d -enable-script-checks=true -datacenter=test \
-ui -rejoin -client=0.0.0.0
ExecReload=/bin/kill --signal HUP $MAINPID
KillMode=process
KillSignal=SIGTERM
Restart=on-failure
LimitNOFILE=65536

[Install]
WantedBy=multi-user.target

[root@consul-node-01 ~]# chown -R consul.consul /data/consul/data
[root@consul-node-01 ~]# systemctl daemon-reload && systemctl restart consul

[root@consul-node-02 ~]# vi /usr/lib/systemd/system/consul.service
[root@consul-node-02 ~]# cat /usr/lib/systemd/system/consul.service
[Unit]
Description="HashiCorp Consul - A service mesh solution"
Documentation=https://www.consul.io/
Requires=network-online.target
After=network-online.target
ConditionFileNotEmpty=/etc/consul.d/consul.hcl

[Service]
EnvironmentFile=-/etc/consul.d/consul.env
User=consul
Group=consul
ExecStart=/usr/bin/consul agent -server -data-dir=/data/consul/data -node=consul-node-02 -bind=192.168.247.53 \
-config-dir=/etc/consul.d -enable-script-checks=true -datacenter=test \
-rejoin -client=0.0.0.0 -join=192.168.247.52
ExecReload=/bin/kill --signal HUP $MAINPID
KillMode=process
KillSignal=SIGTERM
Restart=on-failure
LimitNOFILE=65536

[Install]
WantedBy=multi-user.target

[root@consul-node-02 ~]# chown -R consul.consul /data/consul/data
[root@consul-node-02 ~]# systemctl daemon-reload && systemctl restart consul

[root@consul-node-03 ~]# vi /usr/lib/systemd/system/consul.service
[root@consul-node-03 ~]# cat /usr/lib/systemd/system/consul.service
[Unit]
Description="HashiCorp Consul - A service mesh solution"
Documentation=https://www.consul.io/
Requires=network-online.target
After=network-online.target
ConditionFileNotEmpty=/etc/consul.d/consul.hcl

[Service]
EnvironmentFile=-/etc/consul.d/consul.env
User=consul
Group=consul
ExecStart=/usr/bin/consul agent -server -data-dir=/data/consul/data -node=consul-node-03 -bind=192.168.247.54 \
-config-dir=/etc/consul.d -enable-script-checks=true -datacenter=test \
-rejoin -client=0.0.0.0 -join=192.168.247.52
ExecReload=/bin/kill --signal HUP $MAINPID
KillMode=process
KillSignal=SIGTERM
Restart=on-failure
LimitNOFILE=65536

[Install]
WantedBy=multi-user.target

[root@consul-node-03 ~]# chown -R consul.consul /data/consul/data
[root@consul-node-03 ~]# systemctl daemon-reload && systemctl restart consul
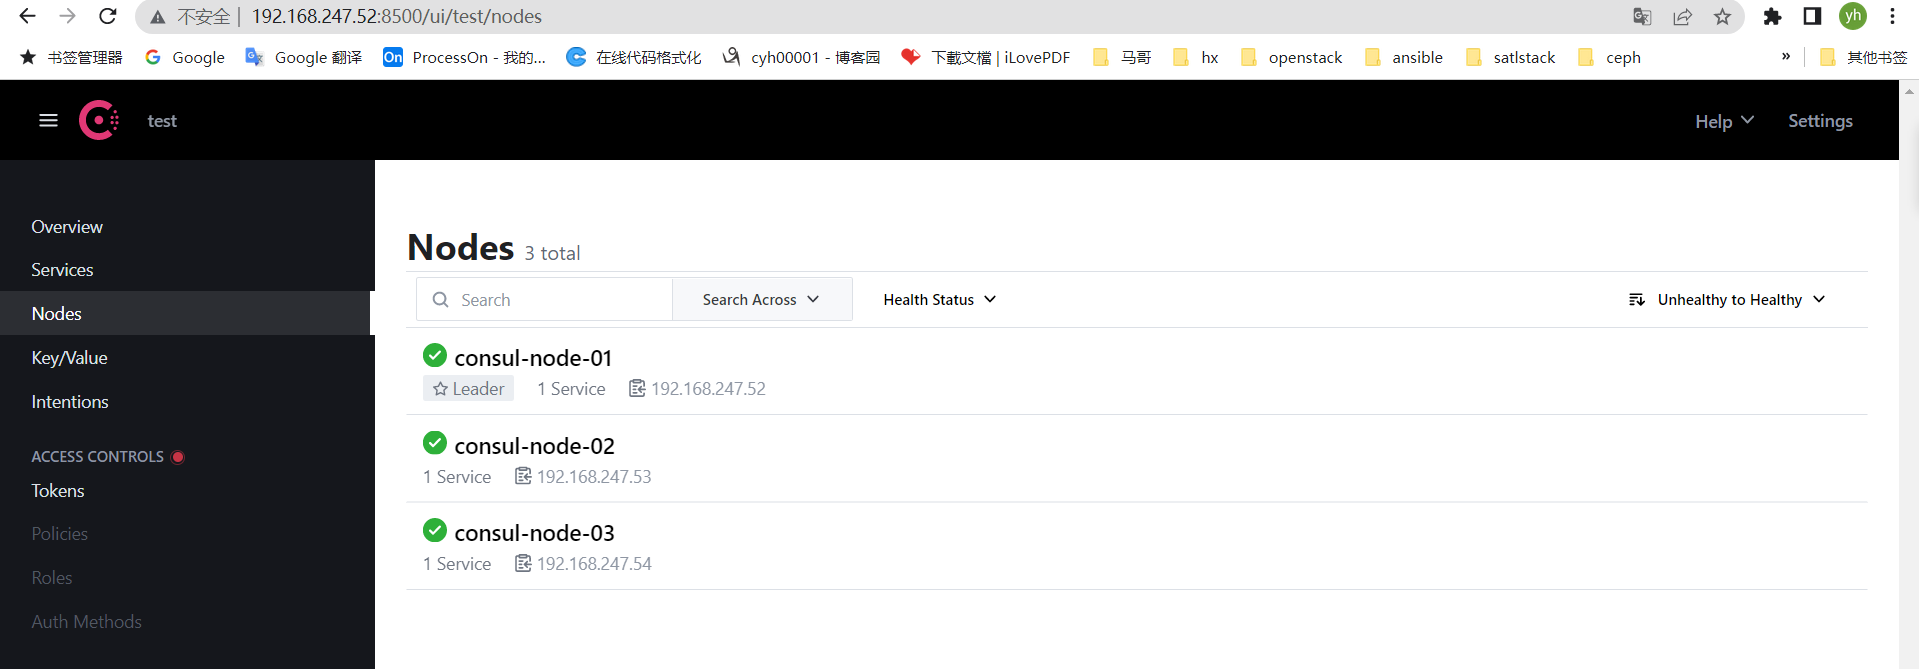
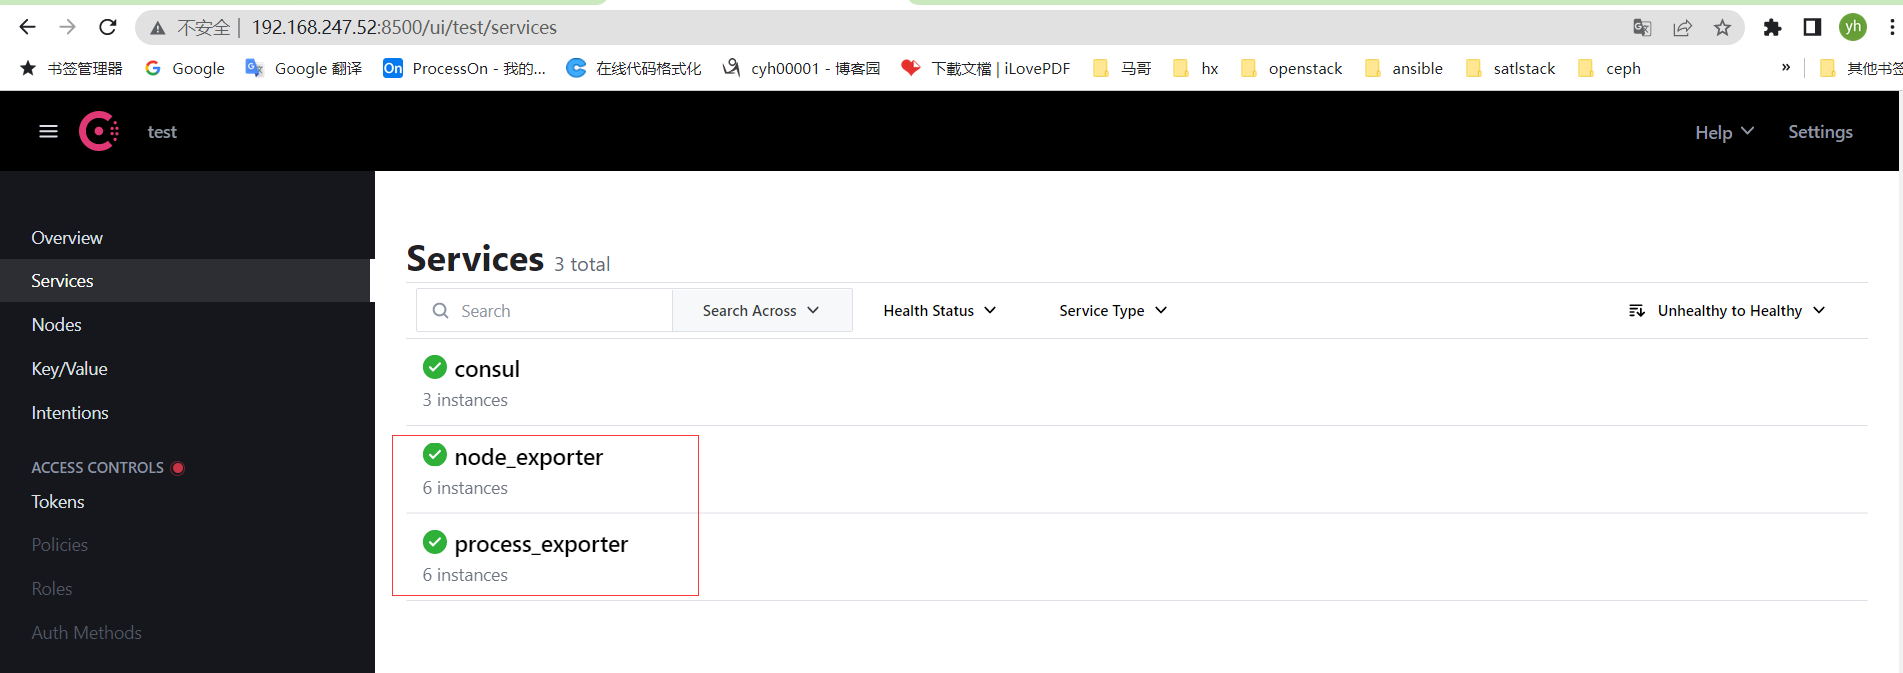
验证consul集群信息
启动node_exporter、process_exporter
systemctl enable --now node_exporter
systemctl enable --now process_exporter
五、将机器节点推送consul
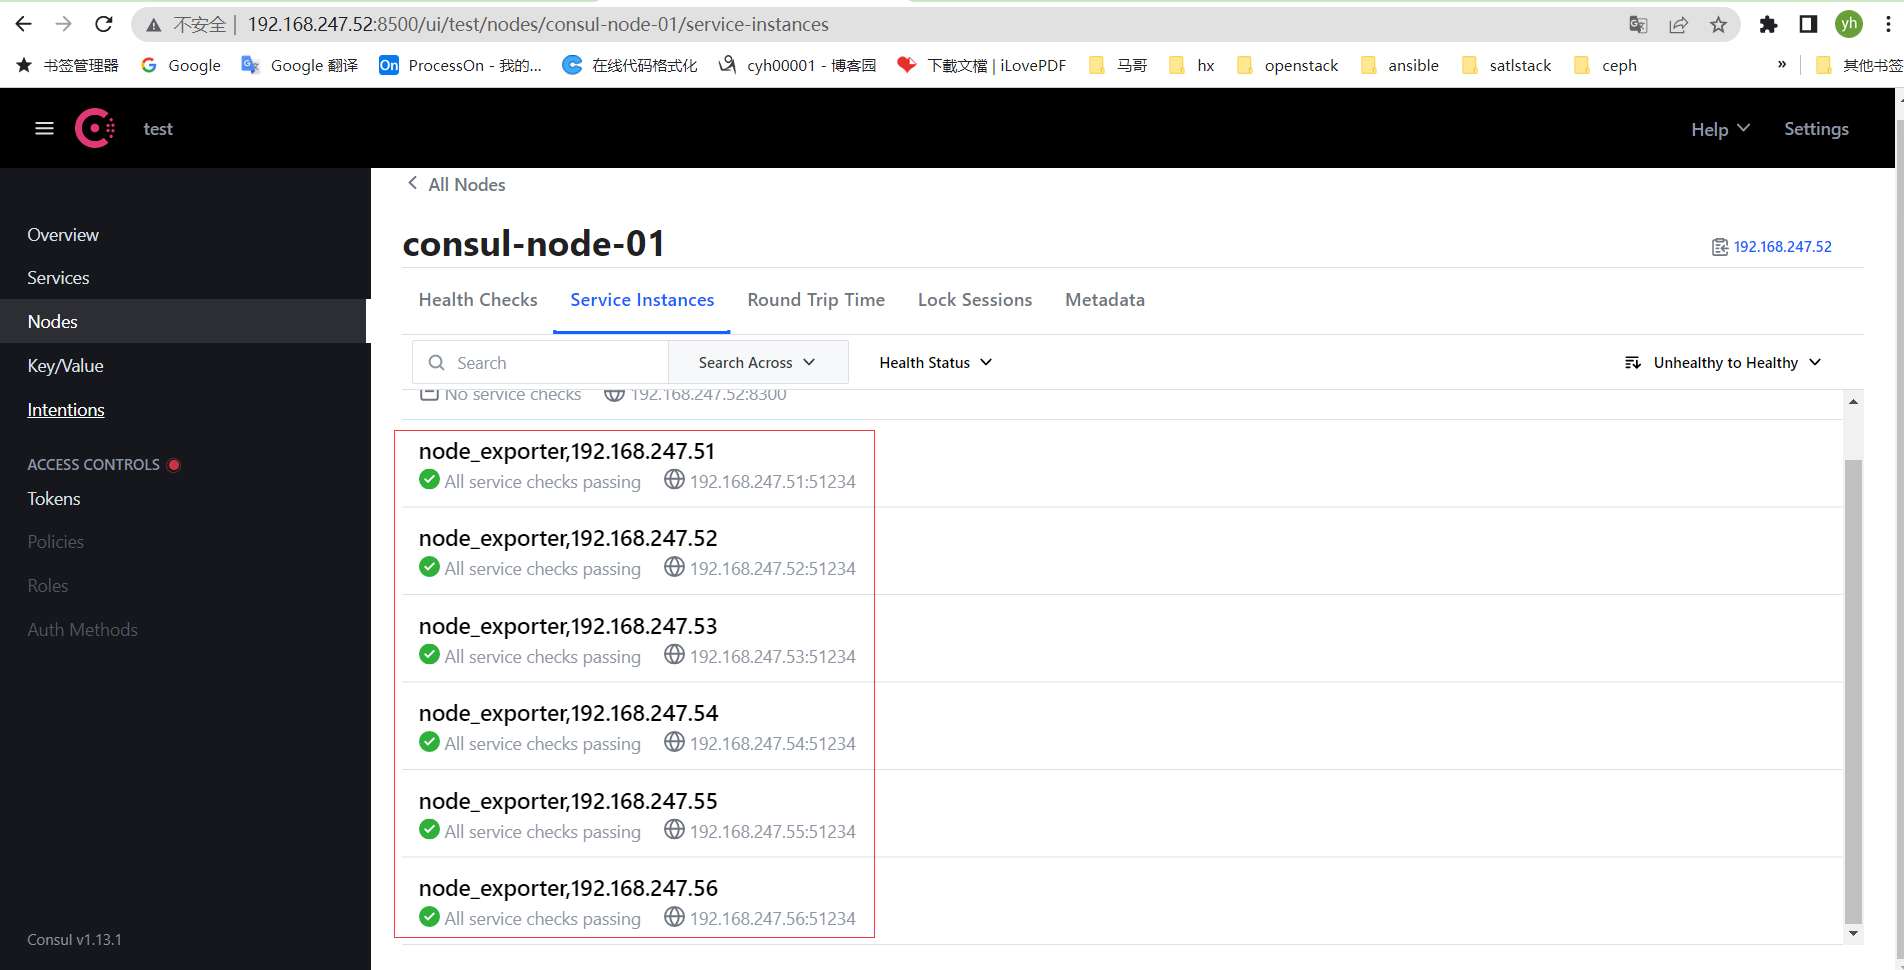
注册node_exporter信息
[root@monitoring-node-01 ~]# cd /opt/node_exporter
[root@monitoring-node-01 node_exporter]# ./register.sh 192.168.247.51

[root@consul-node-01 ~]# cd /opt/node_exporter
[root@consul-node-01 node_exporter]# ./register.sh 192.168.247.52

[root@consul-node-02 ~]# cd /opt/node_exporter
[root@consul-node-02 node_exporter]# ./register.sh 192.168.247.53

[root@consul-node-03 ~]# cd /opt/node_exporter
[root@consul-node-03 node_exporter]# ./register.sh 192.168.247.54

[root@node-01 ~]# cd /opt/node_exporter
[root@node-01 node_exporter]# ./register.sh 192.168.247.55

[root@node-02 ~]# cd /opt/node_exporter
[root@node-02 node_exporter]# ./register.sh 192.168.247.56
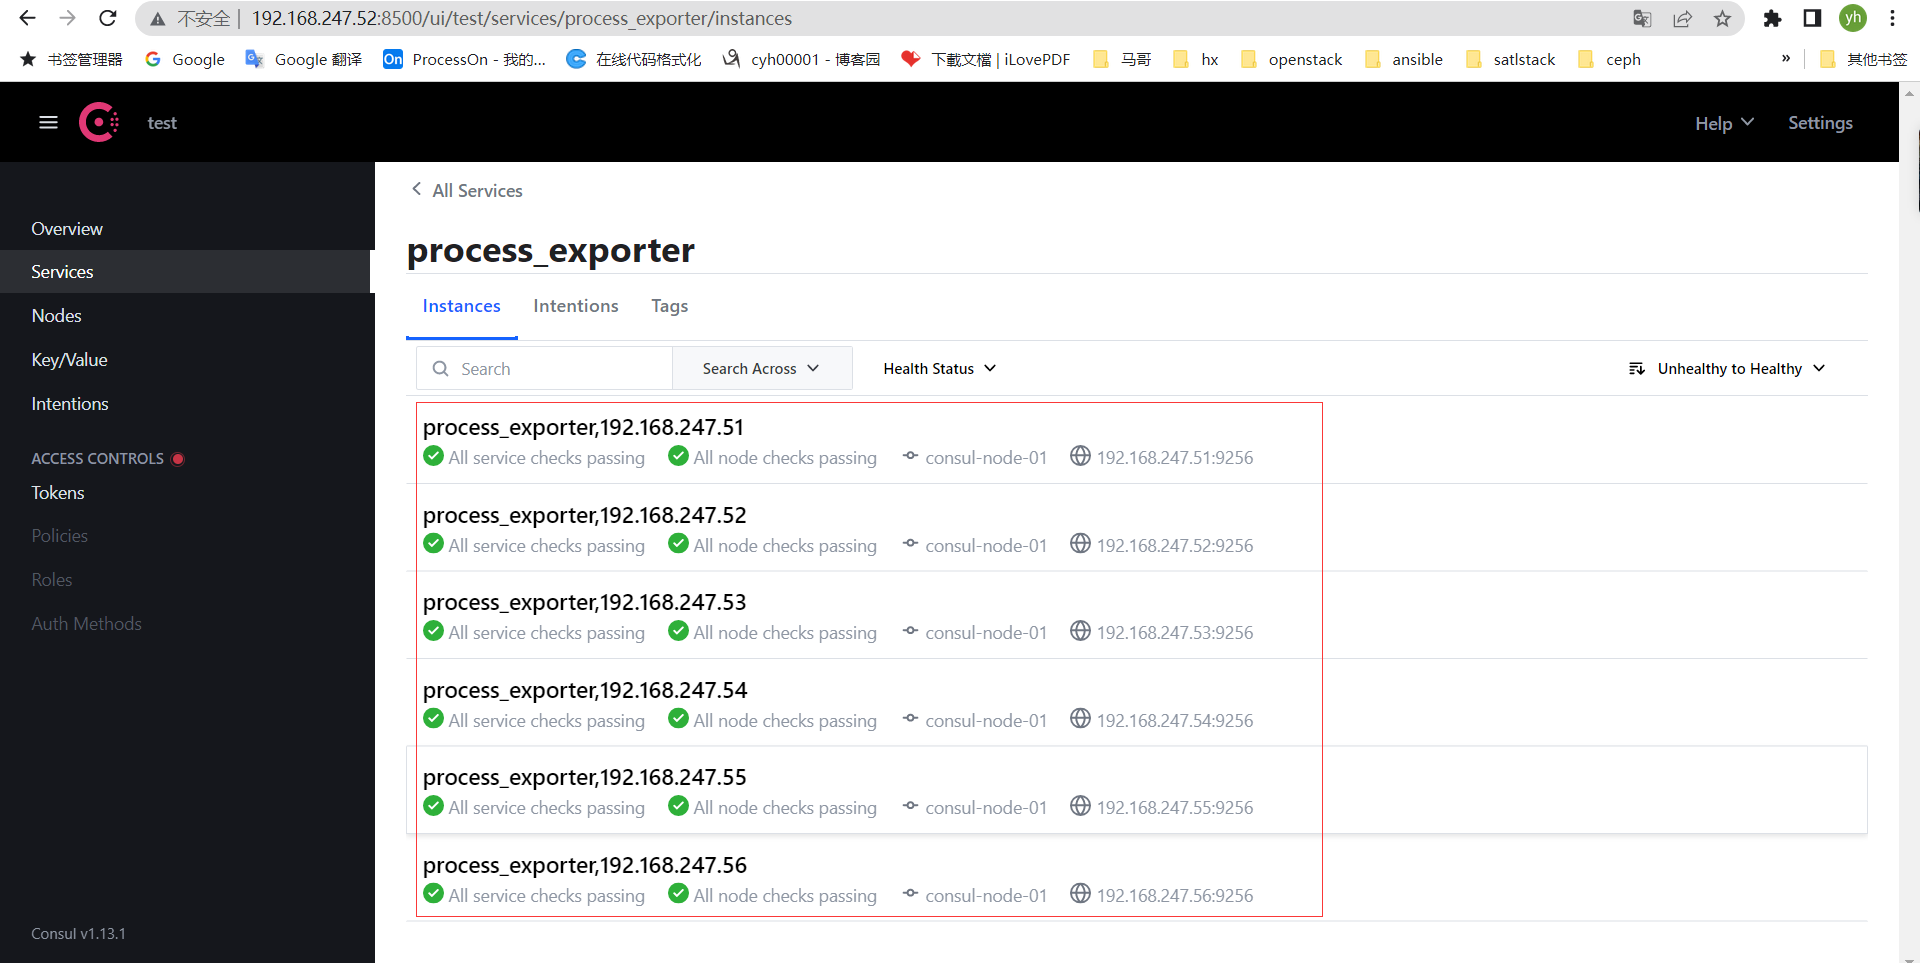
注册process_exporter信息
[root@monitoring-node-01 ~]# cd /opt/process-exporter
[root@monitoring-node-01 process-exporter]# ./register.sh 192.168.247.51

[root@consul-node-01 ~]# cd /opt/process-exporter
[root@consul-node-01 process-exporter]# ./register.sh 192.168.247.52

[root@consul-node-02 ~]# cd /opt/process-exporter
[root@consul-node-02 process-exporter]# ./register.sh 192.168.247.53

[root@consul-node-03 ~]# cd /opt/process-exporter
[root@consul-node-03 process-exporter]# ./register.sh 192.168.247.54

[root@node-01 ~]# cd /opt/process-exporter
[root@node-01 process-exporter]# ./register.sh 192.168.247.55

[root@node-02 ~]# cd /opt/process-exporter
[root@node-02 process-exporter]# ./register.sh 192.168.247.56
consul数据存放方式
[root@consul-node-01 ~]# cd /data/consul/data/
[root@consul-node-01 data]# ll -h
total 16K
-rw-r--r-- 1 consul consul  394 Sep 17 14:35 checkpoint-signature
drwx------ 2 consul consul 4.0K Sep 17 15:05 checks
-rw------- 1 consul consul   36 Sep 17 14:35 node-id
drwxr-xr-x 3 consul consul   56 Sep 17 14:35 raft
drwxr-xr-x 2 consul consul   51 Sep 17 14:35 serf
drwx------ 2 consul consul 4.0K Sep 17 15:05 services
[root@consul-node-01 data]# tree -h
.
├── [  394]  checkpoint-signature
├── [ 4.0K]  checks
│   ├── [  960]  015c1c728179d68f8fdfbcfa25ef2e511793a0530d96c928402bd2acf2de8f39
│   ├── [  960]  45646a14b1fa25b0826770d1ea564e7a190287ea7d3c3cf611c54dbecdfddf2d
│   ├── [  971]  505ccc81bd168927f6e8207c269d11063bd105ec7189671b2deaea2f546b2183
│   ├── [ 1.3K]  55fc97d6ee4b235f0421c6869596b4f7e775ccb8e9ca27e0d7dfc6179cdc659c
│   ├── [  960]  5d8b30934bbfbddebc0302be760d4db7faa52743688c7c31d75baa942b5ee18e
│   ├── [  971]  5ec113534732da6069f64315dfb59b1d330bf1f04b9aca0330ad60c8db0a8ee9
│   ├── [ 1.3K]  71e89a10776b14e5d6f11a109131cbab0a6424beead957142118859c64d290c3
│   ├── [  971]  77d794ead7ab1b17451a9e44999c2588d349a165e4fc9a852c9ab4655ef1bc5d
│   ├── [  971]  92532627c32cee752bddb1b4c1bf2721815d509931db4c3fc036990e281e5ca7
│   ├── [  971]  94bbc0962f29db5302759813cbe101befa37dc75430019f3683531ed3227b7b0
│   ├── [ 1.3K]  9da0bb96c54a1504994da3c96050f80b6501702075b667bd06b74e1e9ac835e0
│   └── [  971]  e6c01bd1f09fefcac2e8b9cf5ebbf7a71d604cf43059dafb09cdeddf7d92a1f0
├── [   36]  node-id
├── [   56]  raft
│   ├── [ 2.3K]  peers.info
│   ├── [ 512K]  raft.db
│   └── [    6]  snapshots
├── [   51]  serf
│   ├── [  150]  local.snapshot
│   └── [  168]  remote.snapshot
└── [ 4.0K]  services
    ├── [  492]  23547a97b5ae06e3a90a8ae729b9dbb06263a69d3045e82aa9c5fcc95dc84070
    ├── [  492]  5593c849cb3ff80d942224df8edce6012a6027b11a84412895de3d78ee7ac219
    ├── [  496]  63191ed59e6e39152ffa1d9ff701fec173194be409801cd4683f70b60e4ad02a
    ├── [  492]  6cd1901eacf35b2def880f0cca824ab8891cd8ab88d665d327b3a8f491a04921
    ├── [  506]  6d26302e402085eafb8c6e0449bcb6e4593c9ffe74521605ff5b1775a7ef810c
    ├── [  510]  8165fa46d8e9e3364524da341797caa4f08fed3c289c4073b509f0f06f3d2320
    ├── [  485]  ae9da4ed14840c1a1a241fd298045952302713efd7a45c27afcccb2c5f298b64
    ├── [  499]  b889243d465bbf0e7bbd7bf2e7c7fb136f3aef2053ac6e3ff6279893b7552417
    ├── [  506]  bff6eab78a38524802035594cae50eaaada1867f80961b467bf1e1cd9084376f
    ├── [  506]  c4ab53ae4c65fdd8fd885a33767a6d6c58fc3e98113b6e399d4ae1f76e5e50b6
    ├── [  485]  e1325b057f57db94c36cca480f9f496faf8c32b50096601fa786aedb65371dfb
    └── [  499]  e3f7afe1dbf6b3f19c20f4711035b0781906762dad03217fae238b84302b1538

5 directories, 30 files
[root@consul-node-01 data]#
[root@consul-node-02 ~]# cd /data/consul/data/
[root@consul-node-02 data]# ll -h
total 8.0K
-rw-r--r-- 1 consul consul 394 Sep 17 14:36 checkpoint-signature
-rw------- 1 consul consul  36 Sep 17 14:35 node-id
drwxr-xr-x 3 consul consul  56 Sep 17 14:35 raft
drwxr-xr-x 2 consul consul  51 Sep 17 14:35 serf
[root@consul-node-02 data]# tree
.
├── checkpoint-signature
├── node-id
├── raft
│   ├── peers.info
│   ├── raft.db
│   └── snapshots
└── serf
    ├── local.snapshot
    └── remote.snapshot

3 directories, 6 files
[root@consul-node-02 data]#
[root@consul-node-03 ~]# cd /data/consul/data/
[root@consul-node-03 data]# ll -h
total 8.0K
-rw-r--r-- 1 consul consul 394 Sep 17 14:36 checkpoint-signature
-rw------- 1 consul consul  36 Sep 17 14:35 node-id
drwxr-xr-x 3 consul consul  56 Sep 17 14:35 raft
drwxr-xr-x 2 consul consul  51 Sep 17 14:35 serf
[root@consul-node-03 data]# tree
.
├── checkpoint-signature
├── node-id
├── raft
│   ├── peers.info
│   ├── raft.db
│   └── snapshots
└── serf
    ├── local.snapshot
    └── remote.snapshot

3 directories, 6 files
[root@consul-node-03 data]#
六、配置监控节点Prometheus,进行数据采集
[root@monitoring-node-01 ~]# cd /opt/prometheus/prometheus-2.37.1.linux-amd64
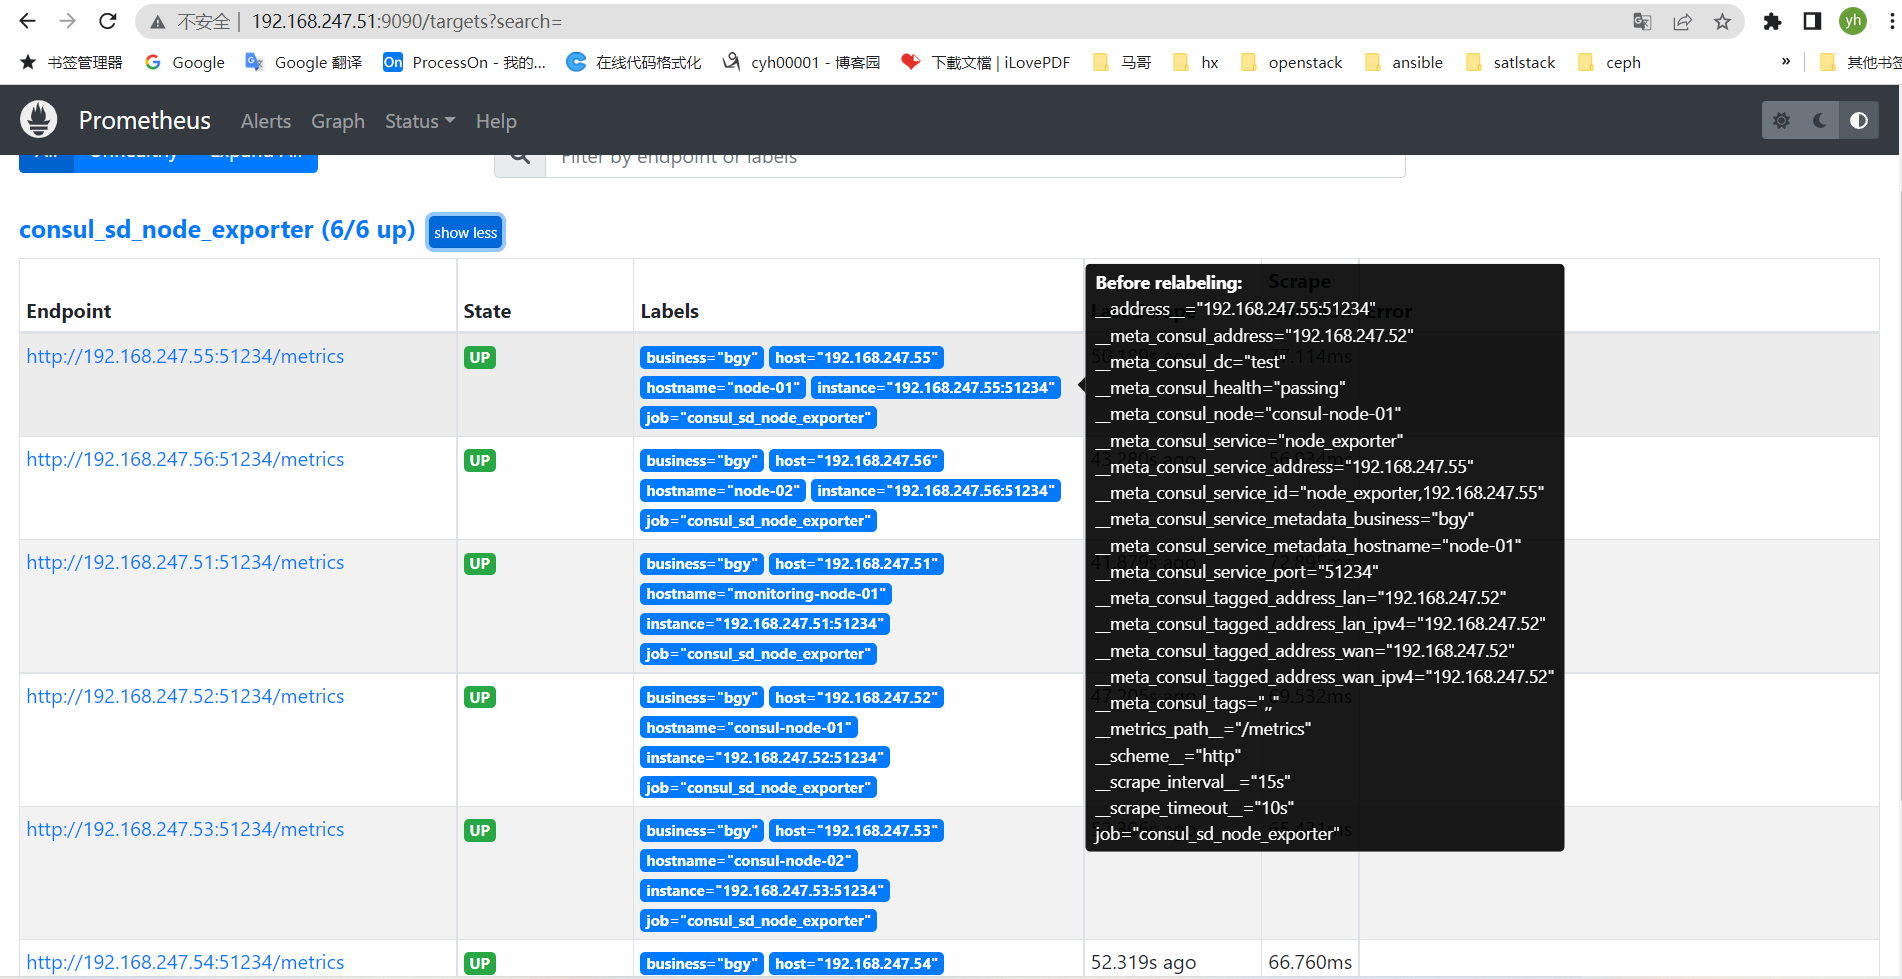
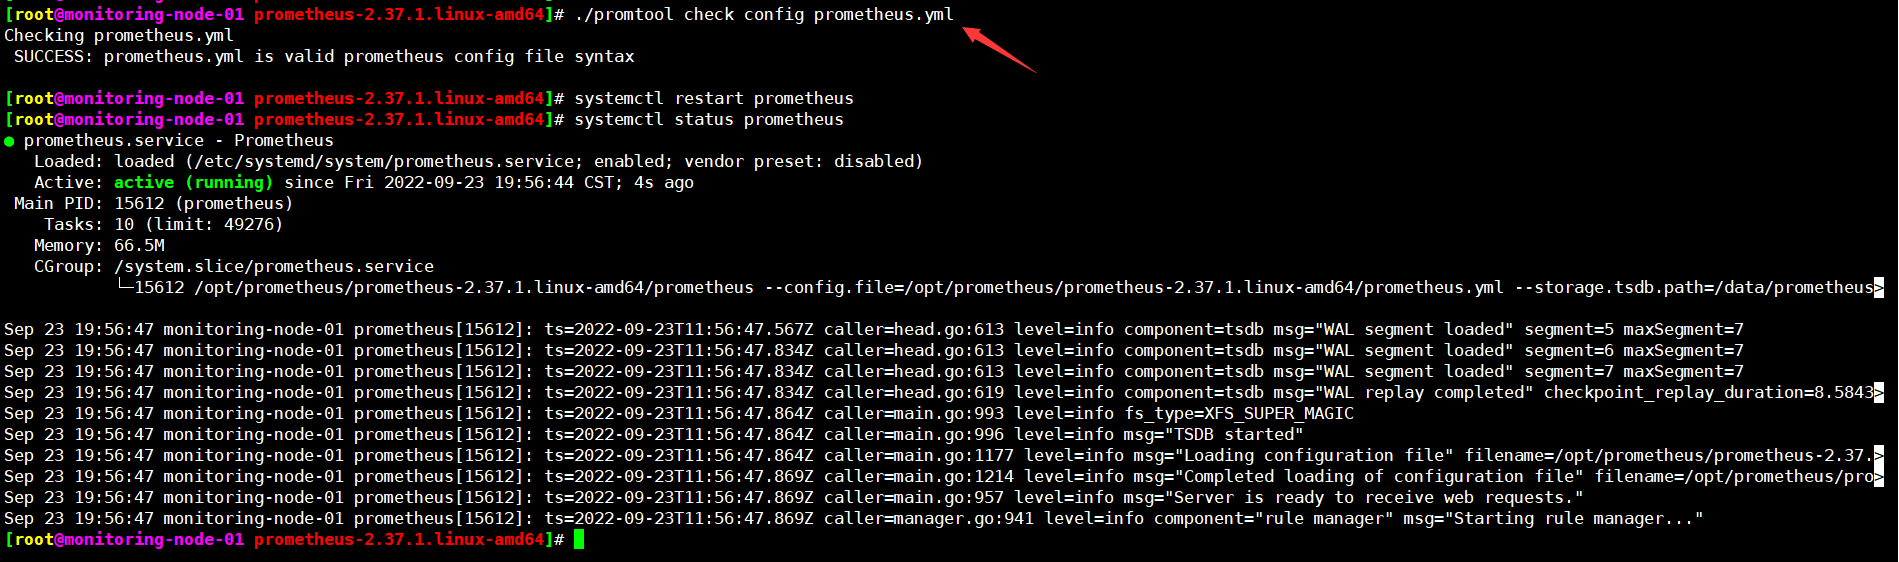
[root@monitoring-node-01 prometheus-2.37.1.linux-amd64]# vim prometheus.yml [root@monitoring-node-01 prometheus-2.37.1.linux-amd64]# cat prometheus.yml # my global config global: scrape_interval: 15s # Set the scrape interval to every 15 seconds. Default is every 1 minute. evaluation_interval: 15s # Evaluate rules every 15 seconds. The default is every 1 minute. # scrape_timeout is set to the global default (10s). # Alertmanager configuration alerting: alertmanagers: - static_configs: - targets: # - alertmanager:9093 # Load rules once and periodically evaluate them according to the global 'evaluation_interval'. rule_files: # - "first_rules.yml" # - "second_rules.yml" # A scrape configuration containing exactly one endpoint to scrape: # Here it's Prometheus itself. scrape_configs: # The job name is added as a label `job=<job_name>` to any timeseries scraped from this config. - job_name: "prometheus" # metrics_path defaults to '/metrics' # scheme defaults to 'http'. static_configs: - targets: ["192.168.247.51:9090"] - job_name: 'consul_sd_node_exporter' metrics_path: /metrics honor_labels: false consul_sd_configs: - server: '192.168.247.52:8500' scheme: http services: ['node_exporter'] relabel_configs: #根据实际监控所需添加label,并在注册时注册 - source_labels: ['__meta_consul_test'] # datacenter,会显示注册到的consul的datacenter target_label: 'test' - source_labels: ['__meta_consul_service_address'] target_label: 'host' - source_labels: ['__meta_consul_service_metadata_hostname'] target_label: 'hostname' - source_labels: ['__meta_consul_service_metadata_business'] target_label: 'business' - job_name: 'sa_process_exporter' scrape_interval: 10s honor_labels: false consul_sd_configs: - server: '192.168.247.52:8500' scheme: http services: ['process_exporter'] relabel_configs: - source_labels: ['__meta_consul_service_address'] target_label: 'host' - source_labels: ['__meta_consul_service_metadata_hostname'] target_label: 'hostname' [root@monitoring-node-01 prometheus-2.37.1.linux-amd64]# [root@monitoring-node-01 prometheus-2.37.1.linux-amd64]# [root@monitoring-node-01 prometheus-2.37.1.linux-amd64]# ./promtool check config prometheus.yml Checking prometheus.yml SUCCESS: prometheus.yml is valid prometheus config file syntax [root@monitoring-node-01 prometheus-2.37.1.linux-amd64]# [root@monitoring-node-01 prometheus-2.37.1.linux-amd64]#
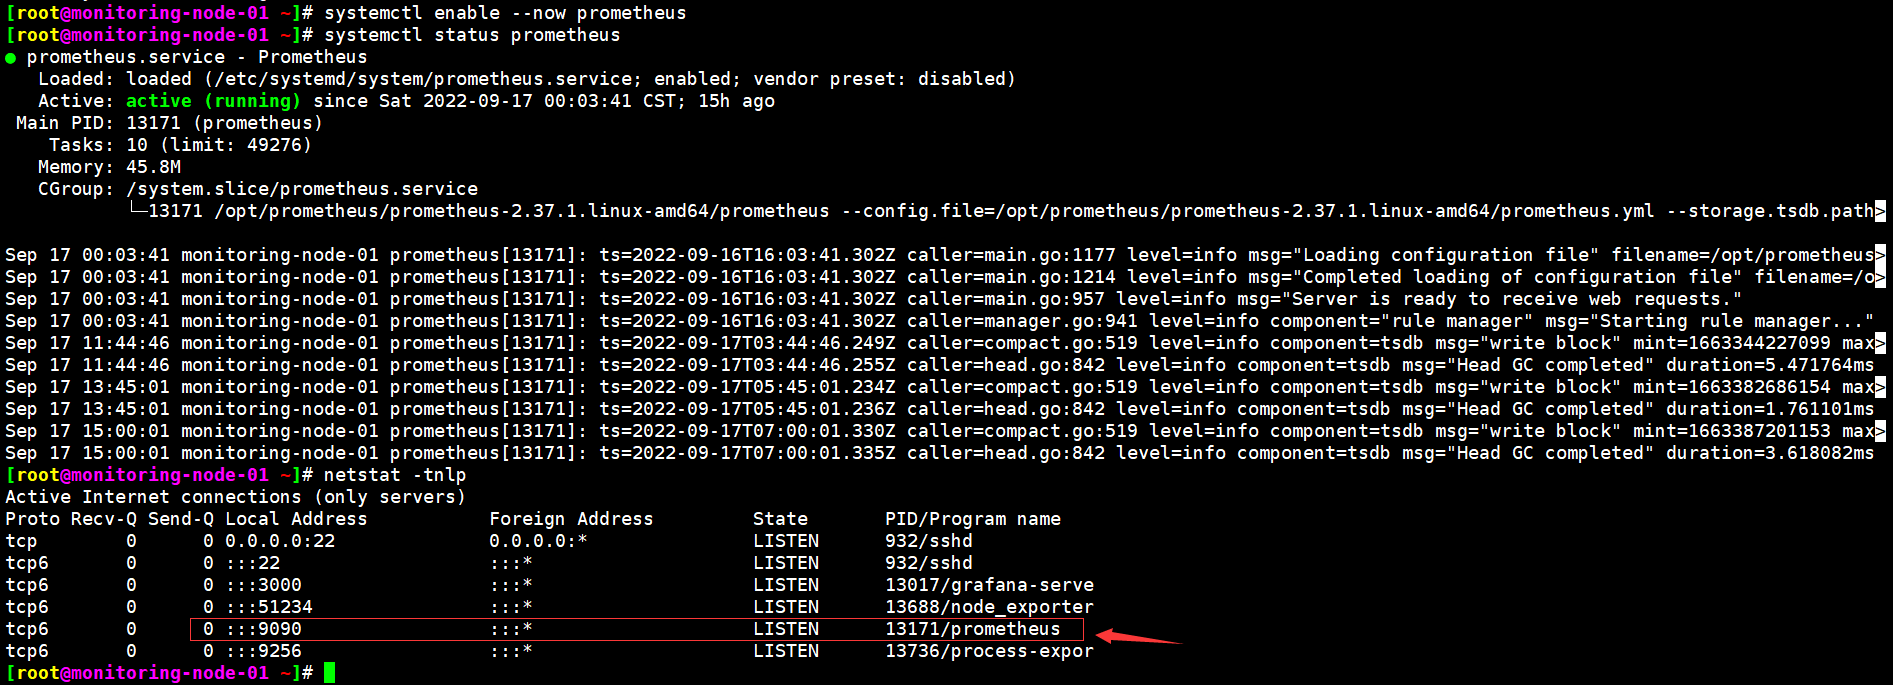
[root@monitoring-node-01 ~]# systemctl enable --now prometheus
Prometheus数据存放方法
[root@monitoring-node-01 ~]# cd /data/prometheus/data/
[root@monitoring-node-01 data]# ll -h
total 20K
drwxr-xr-x 3 root root  68 Sep 17 11:44 01GD4RRY32NTGGQ4W6FDVDCHKP
drwxr-xr-x 3 root root  68 Sep 17 13:45 01GD4ZN3ZAKQ9YE2ZMZVQ6WETX
drwxr-xr-x 3 root root  68 Sep 17 15:00 01GD53YEGER2EZ092E60KXPVMP
drwxr-xr-x 2 root root  20 Sep 17 15:00 chunks_head
-rw-r--r-- 1 root root   0 Sep 17 15:21 lock
-rw-r--r-- 1 root root 20K Sep 17 15:43 queries.active
drwxr-xr-x 2 root root  86 Sep 17 15:21 wal
[root@monitoring-node-01 data]# tree
.
├── 01GD4RRY32NTGGQ4W6FDVDCHKP
│   ├── chunks
│   │   └── 000001
│   ├── index
│   ├── meta.json
│   └── tombstones
├── 01GD4ZN3ZAKQ9YE2ZMZVQ6WETX
│   ├── chunks
│   │   └── 000001
│   ├── index
│   ├── meta.json
│   └── tombstones
├── 01GD53YEGER2EZ092E60KXPVMP
│   ├── chunks
│   │   └── 000001
│   ├── index
│   ├── meta.json
│   └── tombstones
├── chunks_head
│   └── 000003
├── lock
├── queries.active
└── wal
    ├── 00000000
    ├── 00000001
    ├── 00000002
    ├── 00000003
    └── 00000004

8 directories, 20 files
[root@monitoring-node-01 data]#
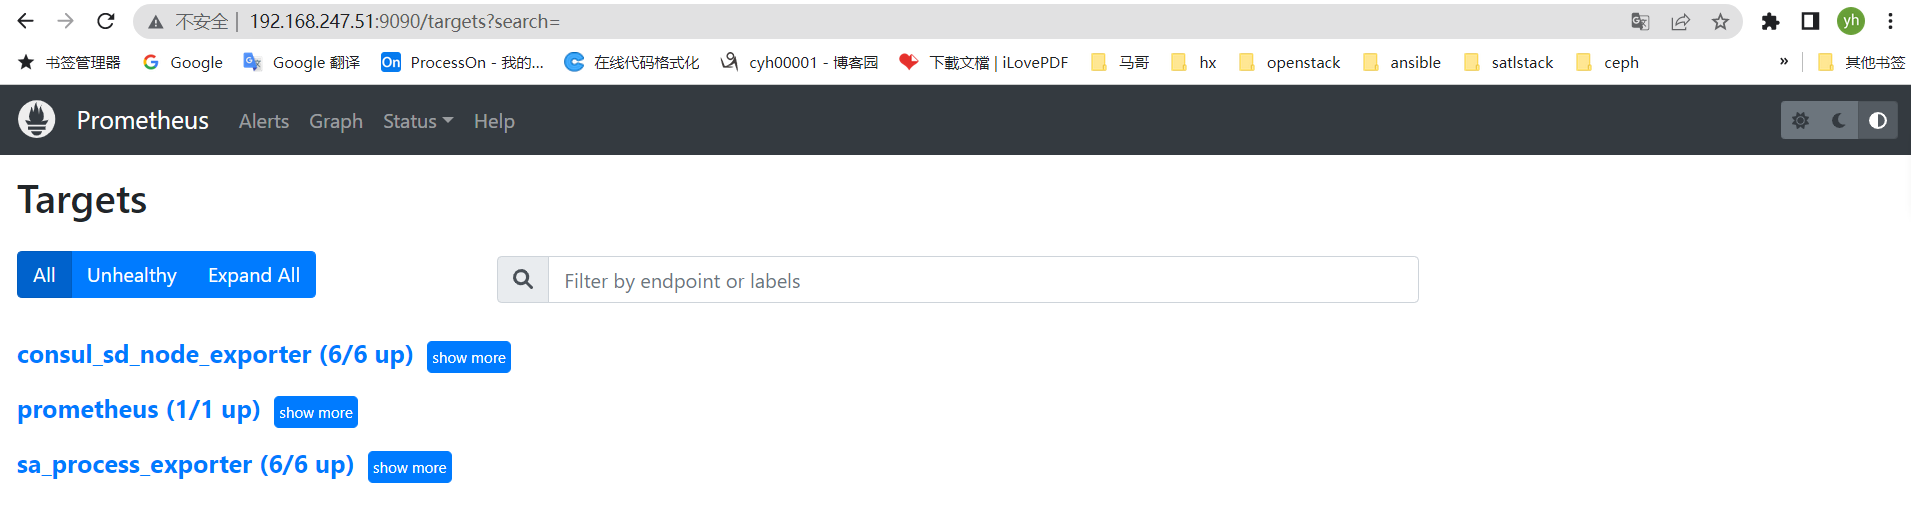
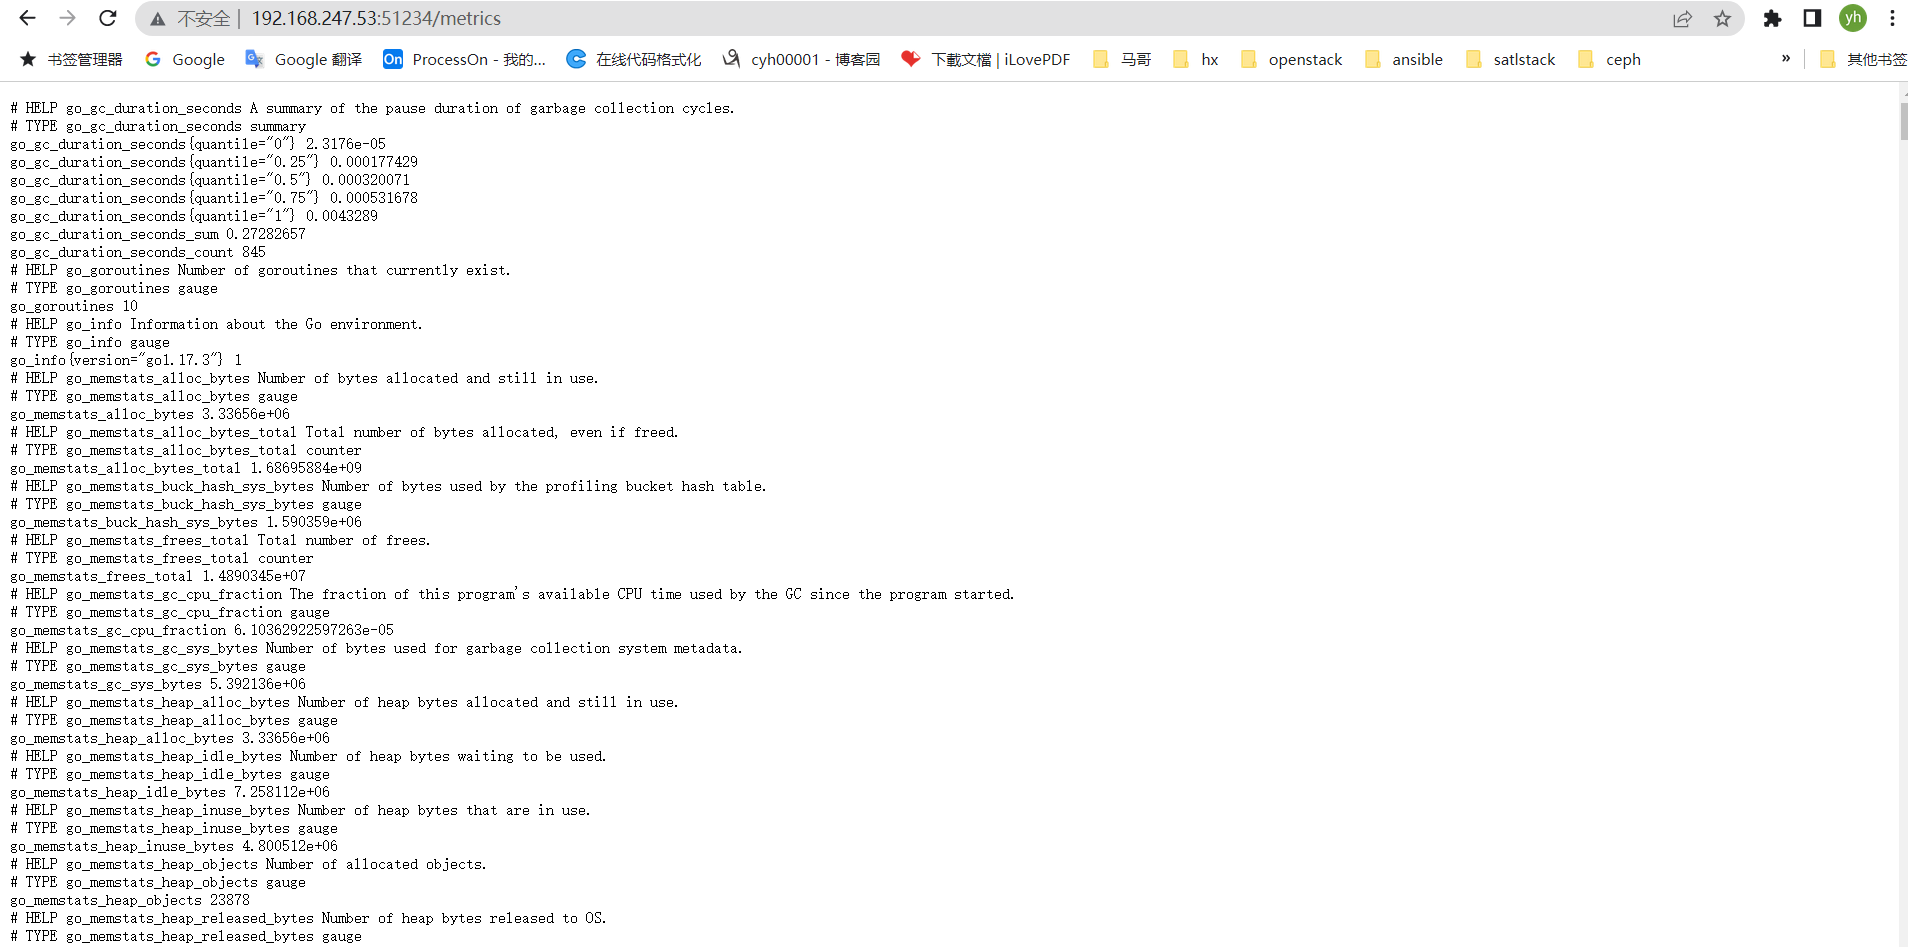
查看数据是否采集到
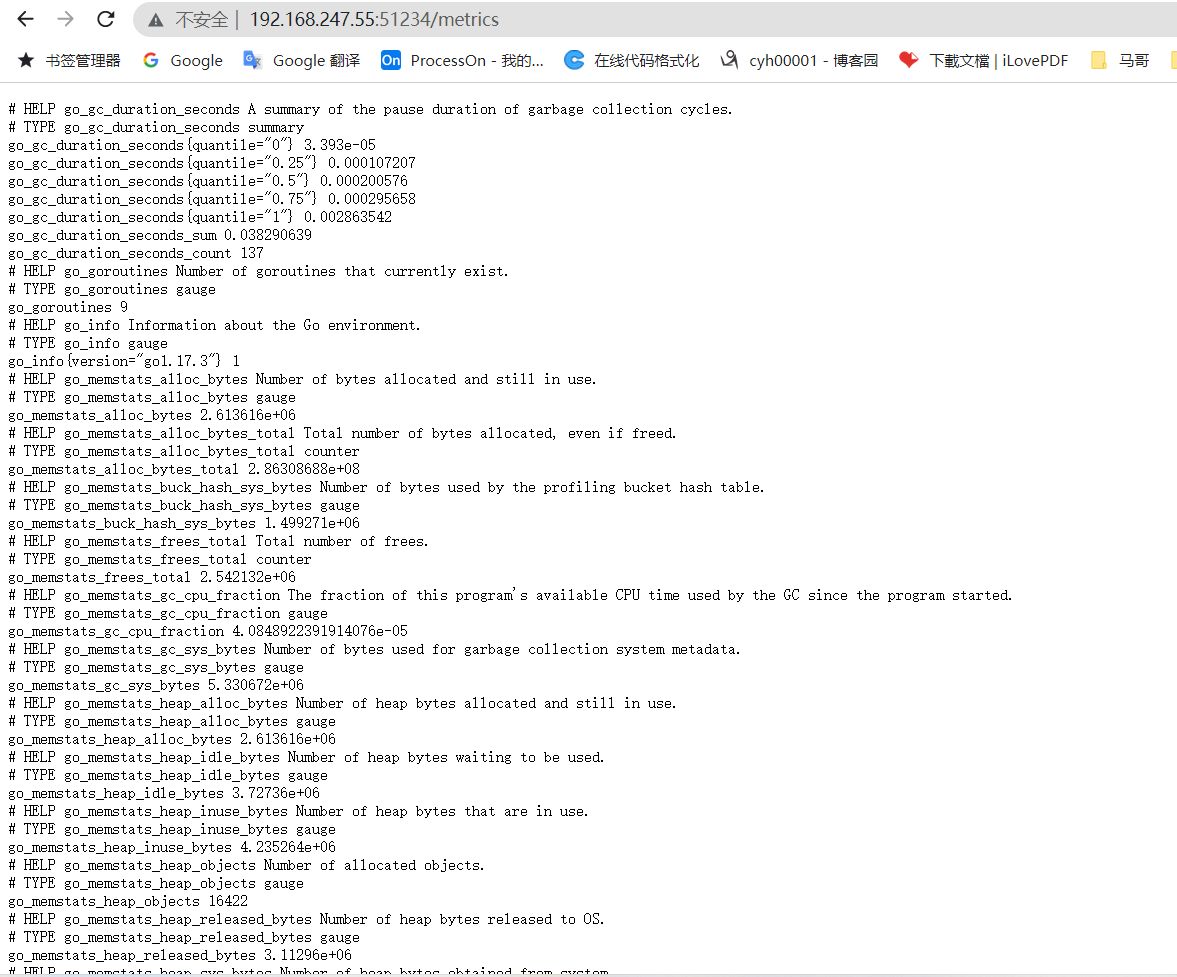
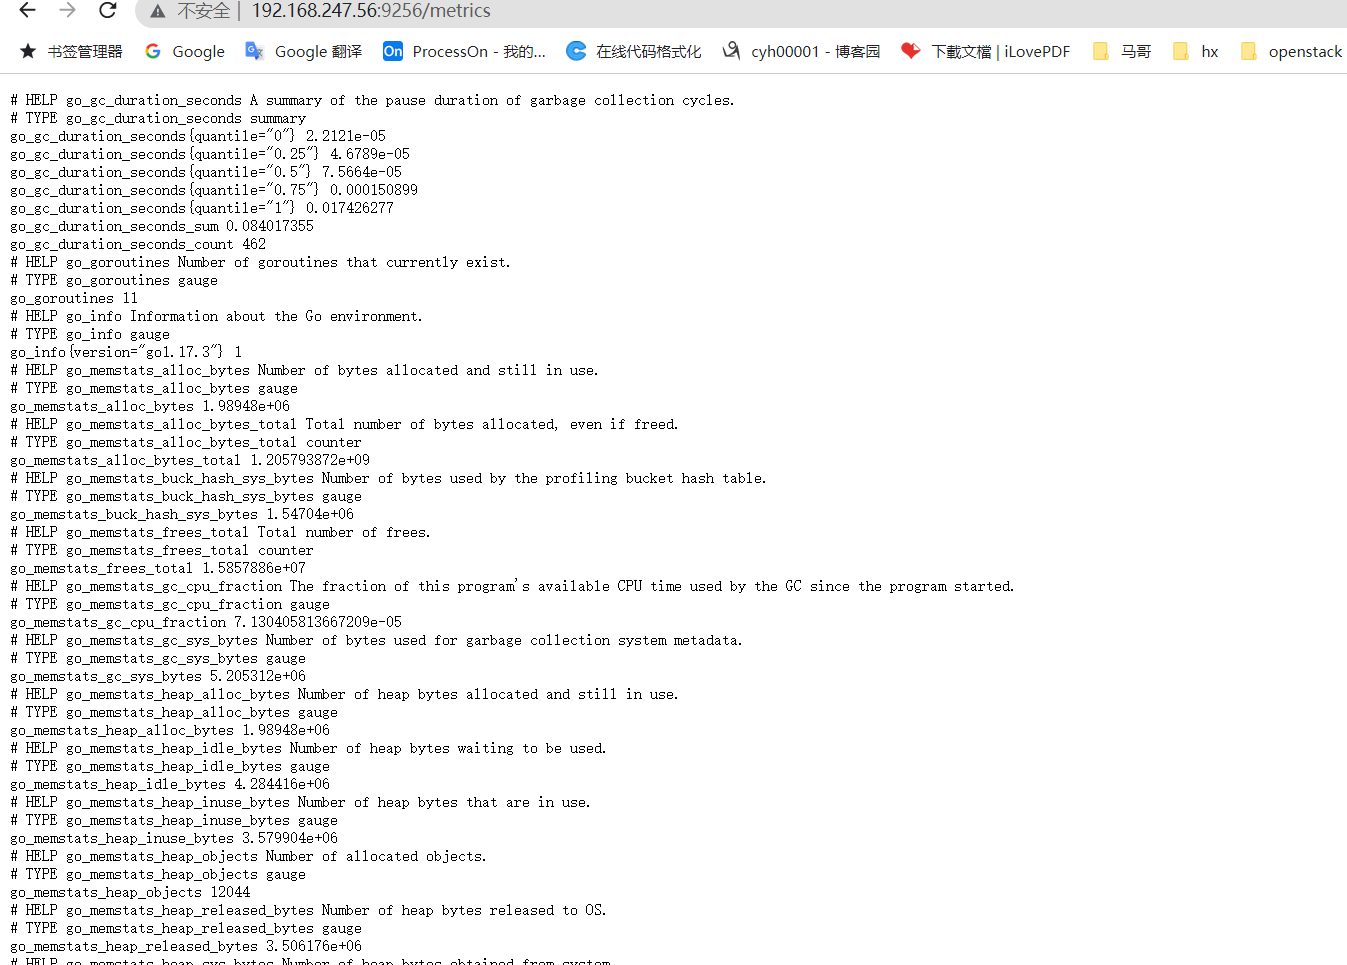
七、基于file_sd_configs服务发现
[root@monitoring-node-01 prometheus-2.37.1.linux-amd64]# pwd
/opt/prometheus/prometheus-2.37.1.linux-amd64
[root@monitoring-node-01 prometheus-2.37.1.linux-amd64]# mkdir file_sd
[root@monitoring-node-01 prometheus-2.37.1.linux-amd64]# cat file_sd/sd_node-exporter.json
[
 {
   "targets": ["192.168.247.51:51234","192.168.247.52:51234","192.168.247.53:51234","192.168.247.54:51234","192.168.247.55:51234","192.168.247.56:51234"]
  }
]
[root@monitoring-node-01 prometheus-2.37.1.linux-amd64]#
[root@monitoring-node-01 prometheus-2.37.1.linux-amd64]# cat file_sd/sd_process-exporter.json
[
 {
   "targets": ["192.168.247.51:9256","192.168.247.52:9256","192.168.247.53:9256","192.168.247.54:9256","192.168.247.55:9256","192.168.247.56:9256"]
  }
]
[root@monitoring-node-01 prometheus-2.37.1.linux-amd64]#
配置Prometheus
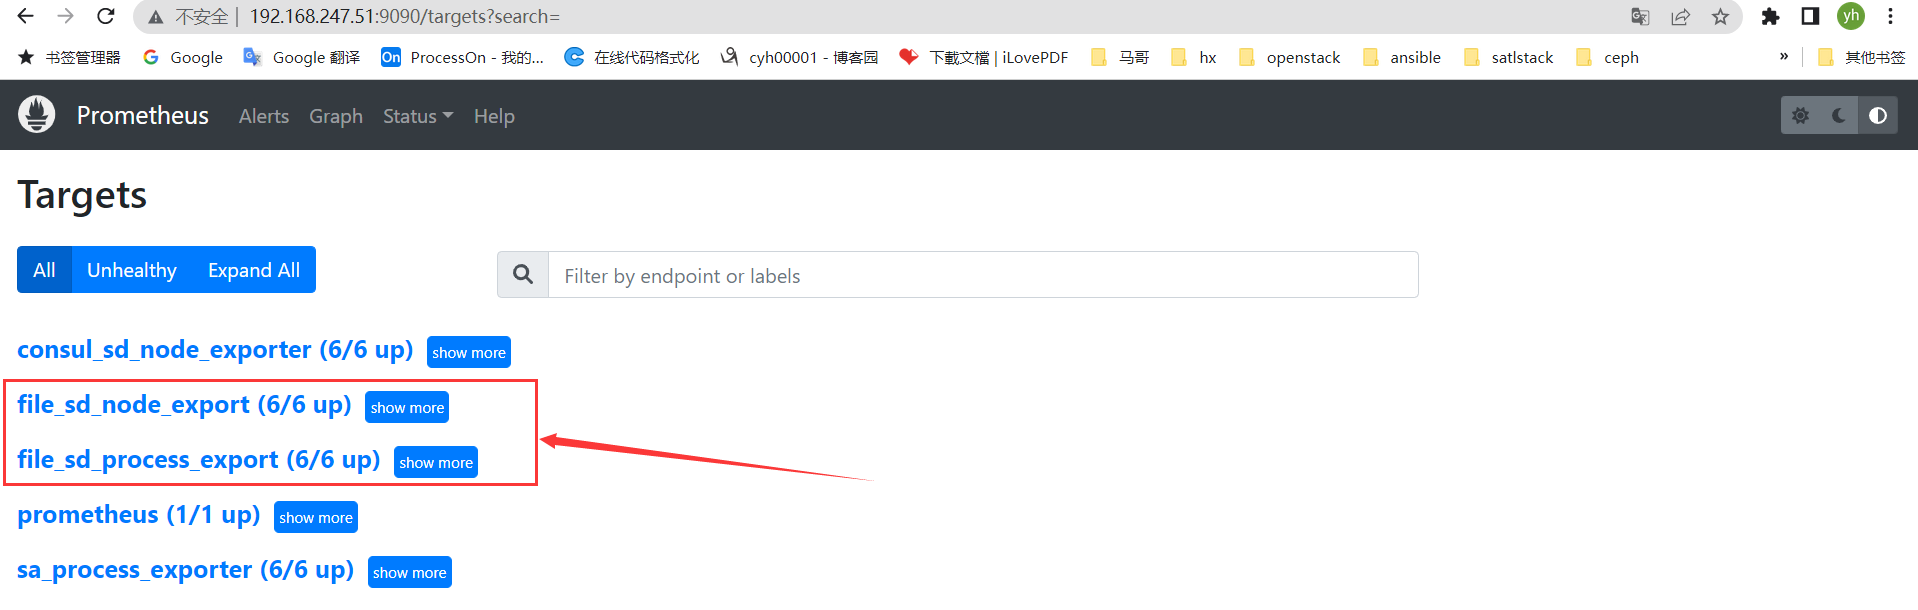
[root@monitoring-node-01 prometheus-2.37.1.linux-amd64]# vim prometheus.yml
[root@monitoring-node-01 prometheus-2.37.1.linux-amd64]# cat prometheus.yml
# my global config
global:
  scrape_interval: 15s # Set the scrape interval to every 15 seconds. Default is every 1 minute.
  evaluation_interval: 15s # Evaluate rules every 15 seconds. The default is every 1 minute.
  # scrape_timeout is set to the global default (10s).

# Alertmanager configuration
alerting:
  alertmanagers:
    - static_configs:
        - targets:
           - "192.168.247.51:9093"

# Load rules once and periodically evaluate them according to the global 'evaluation_interval'.
rule_files:
  # - "first_rules.yml"
  # - "second_rules.yml"

# A scrape configuration containing exactly one endpoint to scrape:
# Here it's Prometheus itself.
scrape_configs:
  # The job name is added as a label `job=<job_name>` to any timeseries scraped from this config.
  - job_name: "prometheus"
    # metrics_path defaults to '/metrics'
    # scheme defaults to 'http'.
    static_configs:
      - targets: ["192.168.247.51:9090"]

  - job_name: 'file_sd_node_export'
    file_sd_configs:
      - files:
        - /opt/prometheus/prometheus-2.37.1.linux-amd64/file_sd/sd_node-exporter.json
        refresh_interval: 10s

  - job_name: 'file_sd_process_export'
    file_sd_configs:
      - files:
        - /opt/prometheus/prometheus-2.37.1.linux-amd64/file_sd/sd_process-exporter.json
        refresh_interval: 10s

  - job_name: 'consul_sd_node_exporter'
    metrics_path: /metrics
    honor_labels: false
    consul_sd_configs:
      - server: '192.168.247.52:8500'
        scheme: http
        services: ['node_exporter']
    relabel_configs:                        #根据实际监控所需添加label,并在注册时注册
    - source_labels: ['__meta_consul_test']   # datacenter,会显示注册到的consul的datacenter
      target_label: 'bgy'
    - source_labels: ['__meta_consul_service_address']
      target_label: 'host'
    - source_labels: ['__meta_consul_service_metadata_hostname']
      target_label: 'hostname'
    - source_labels: ['__meta_consul_service_metadata_business']
      target_label: 'business'
  - job_name: 'sa_process_exporter'
    scrape_interval: 10s
    honor_labels: false
    consul_sd_configs:
      - server: '192.168.247.52:8500'
        scheme: http
        services: ['process_exporter']
    relabel_configs:
    - source_labels: ['__meta_consul_service_address']
      target_label: 'host'
    - source_labels: ['__meta_consul_service_metadata_hostname']
      target_label: 'hostname'
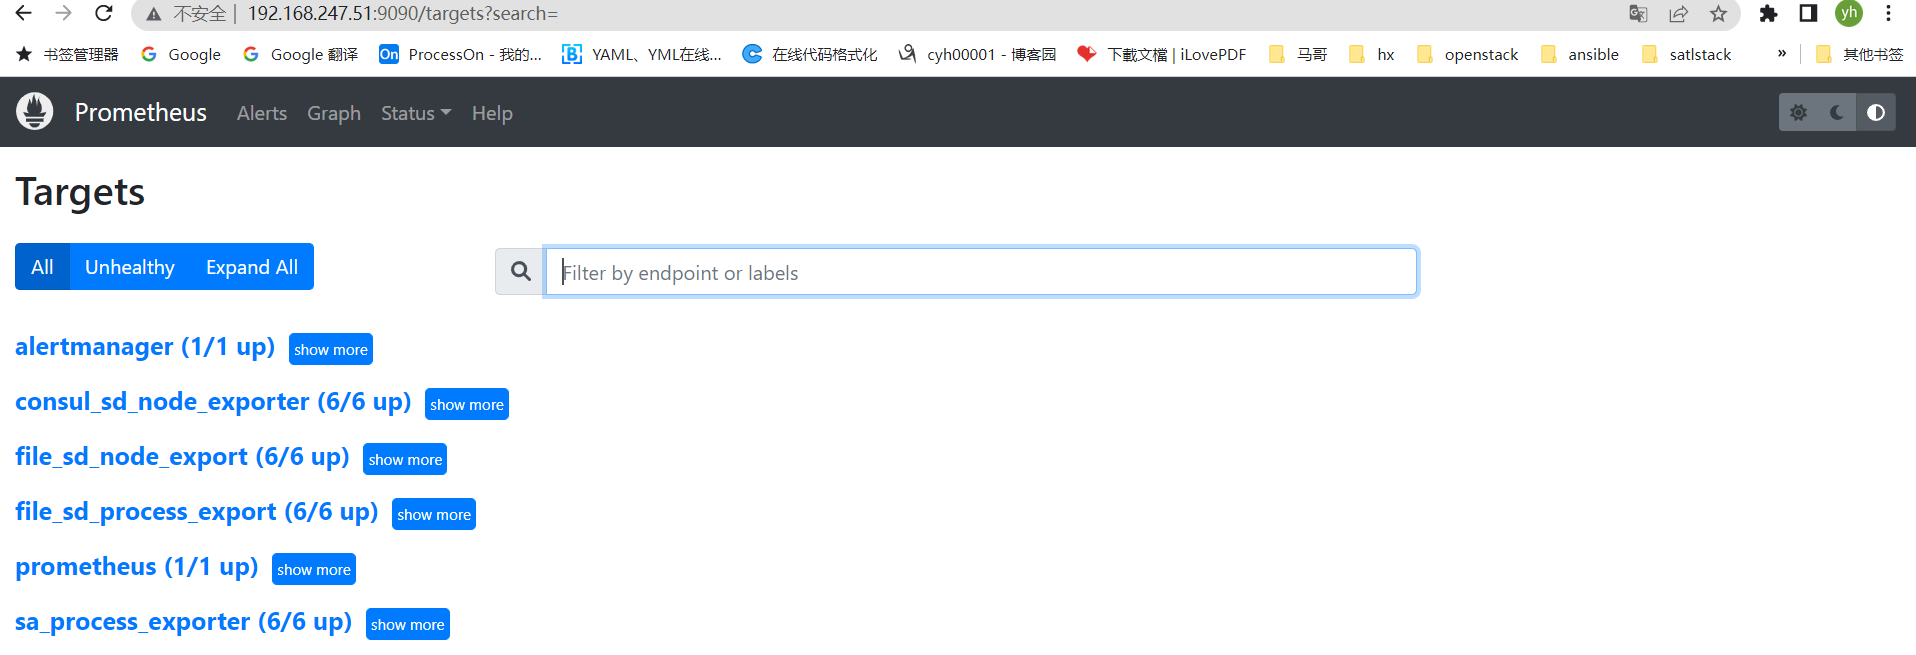
登录Prometheus验证是否采集到

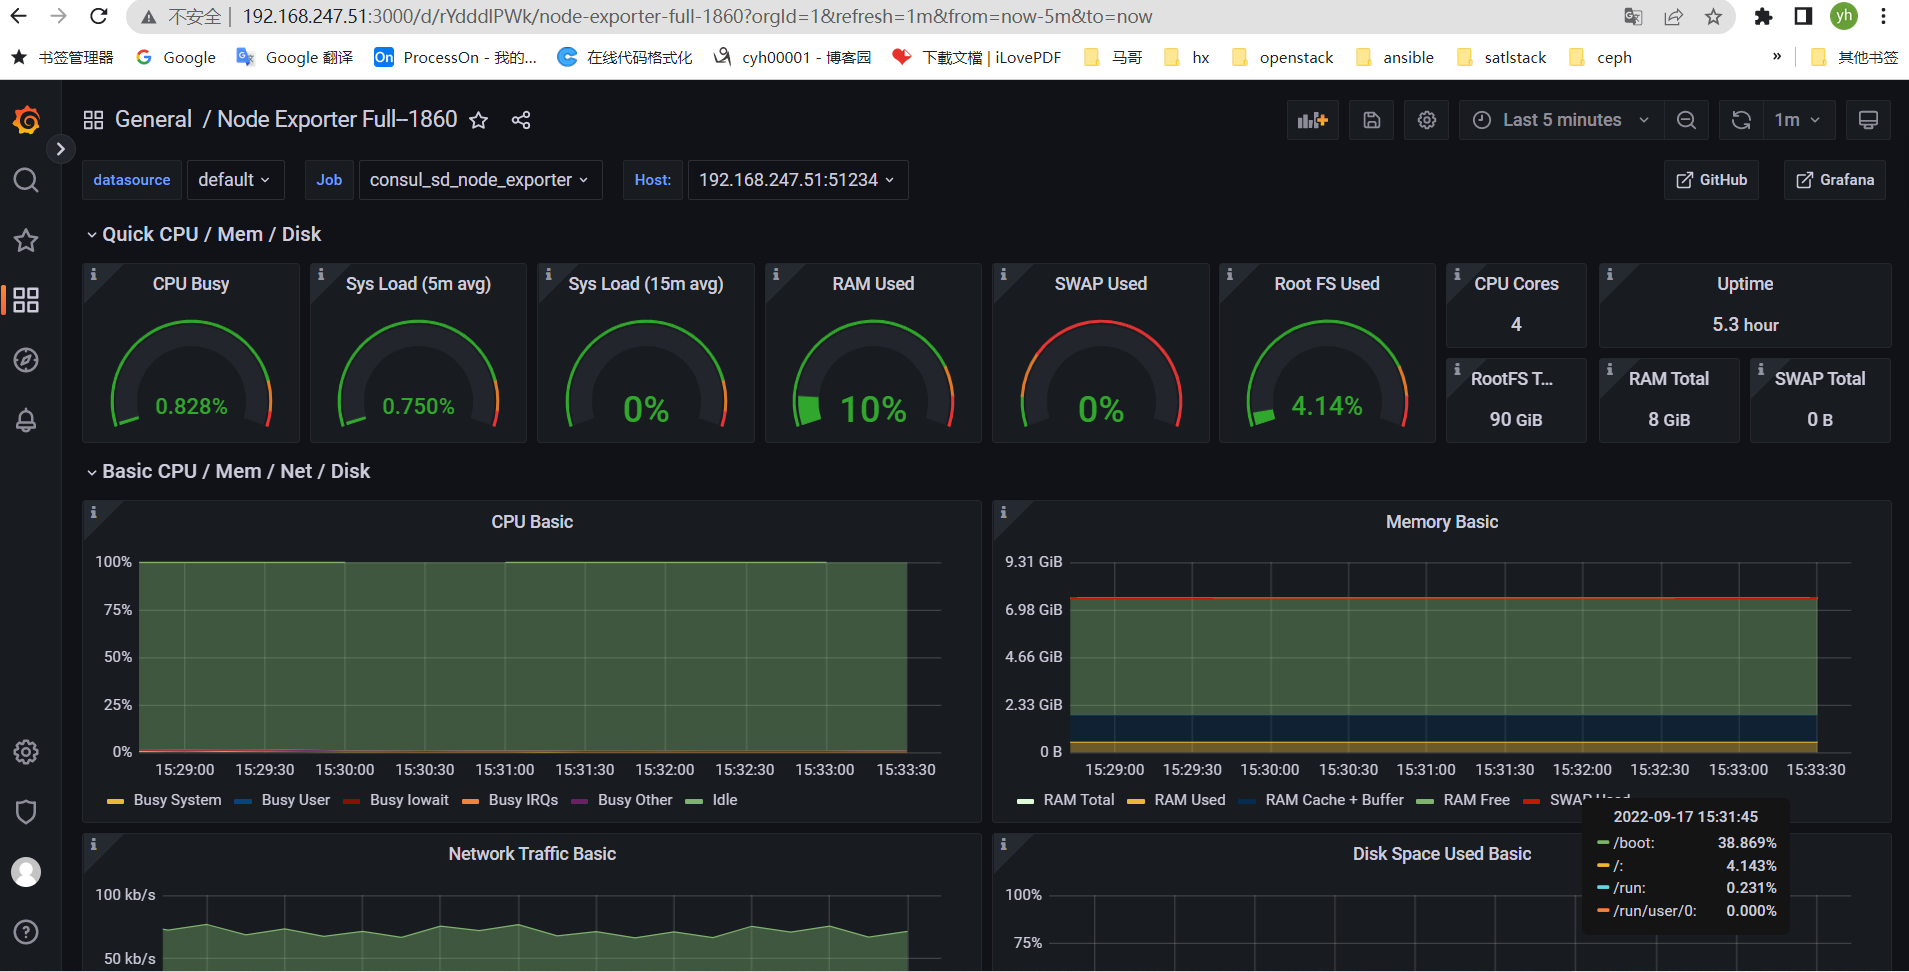
八、配置grafana展示数据
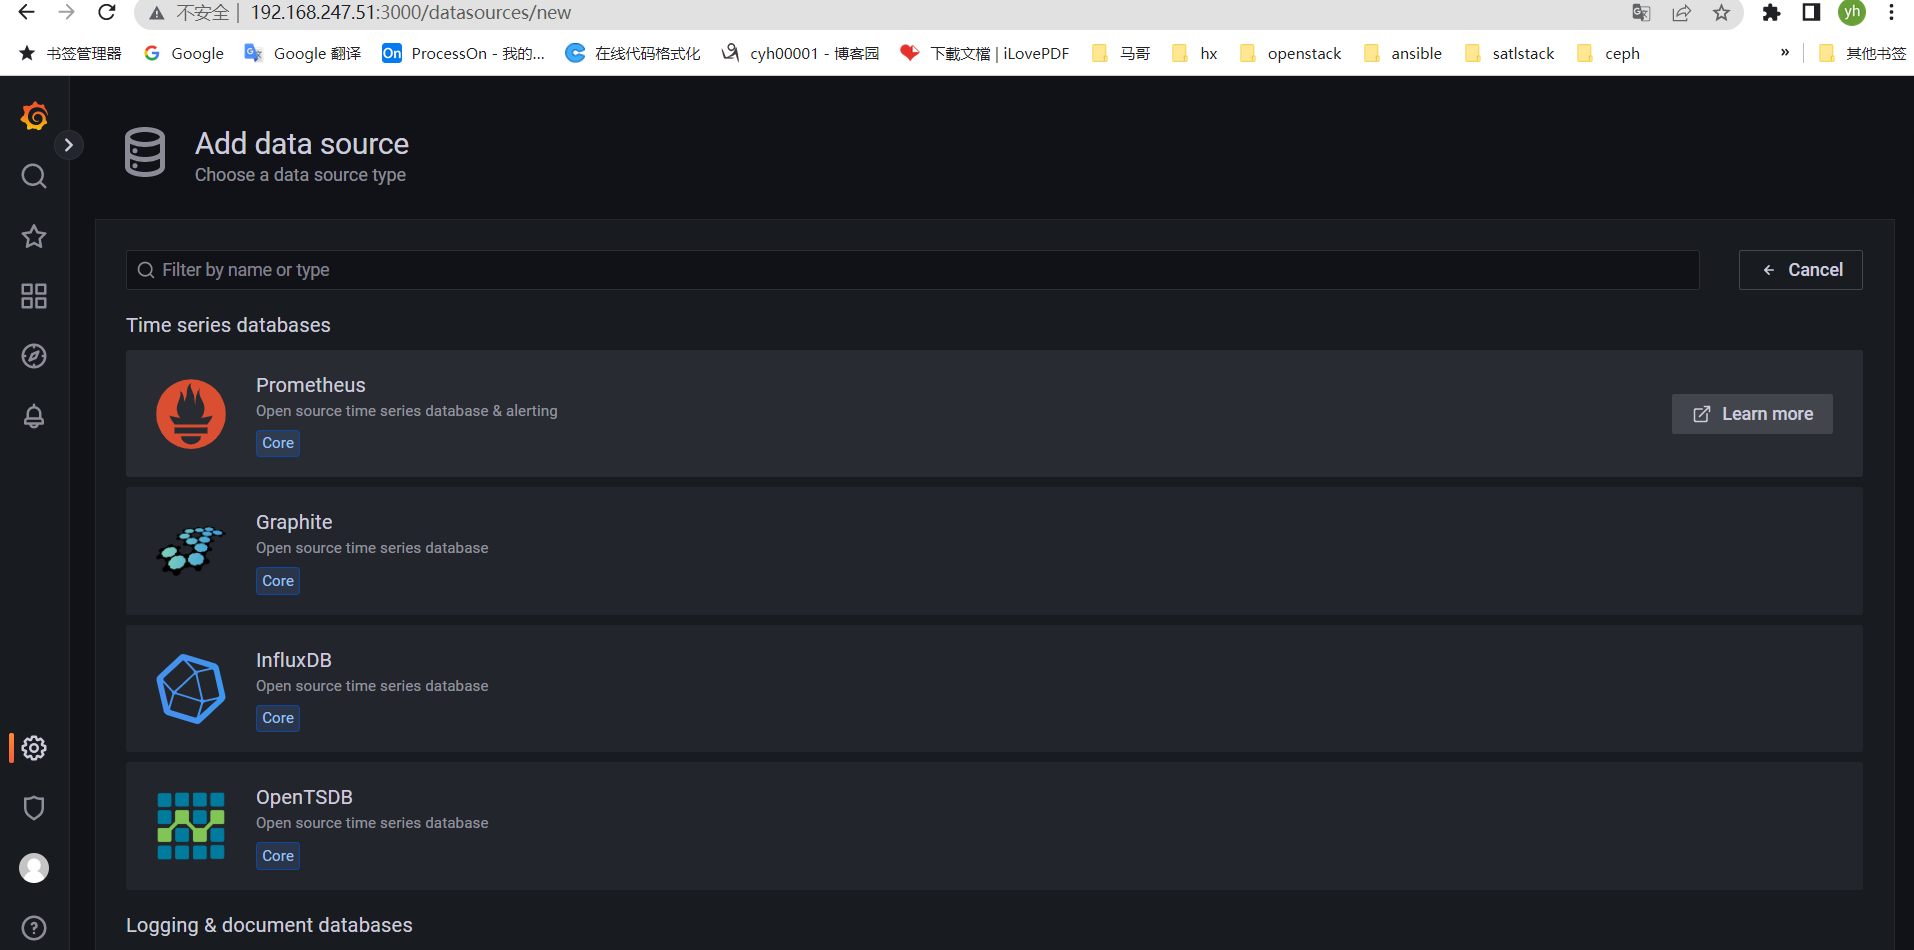
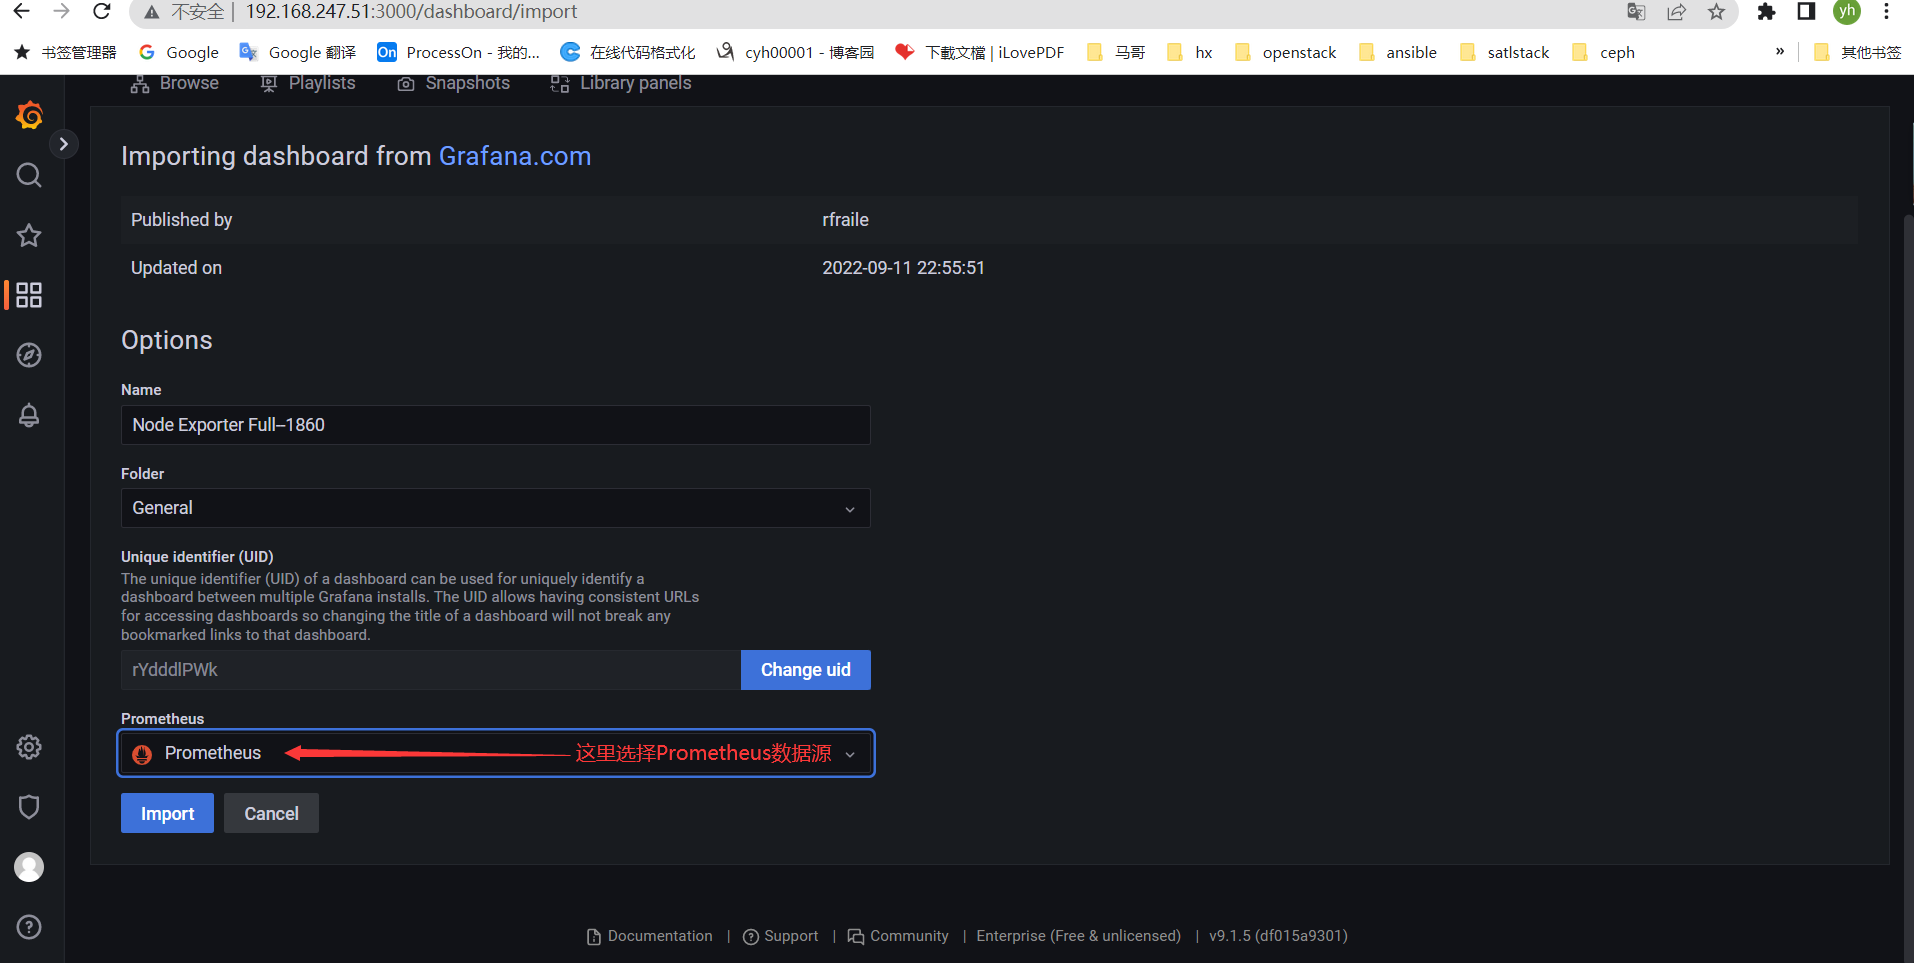
添加Prometheus数据源
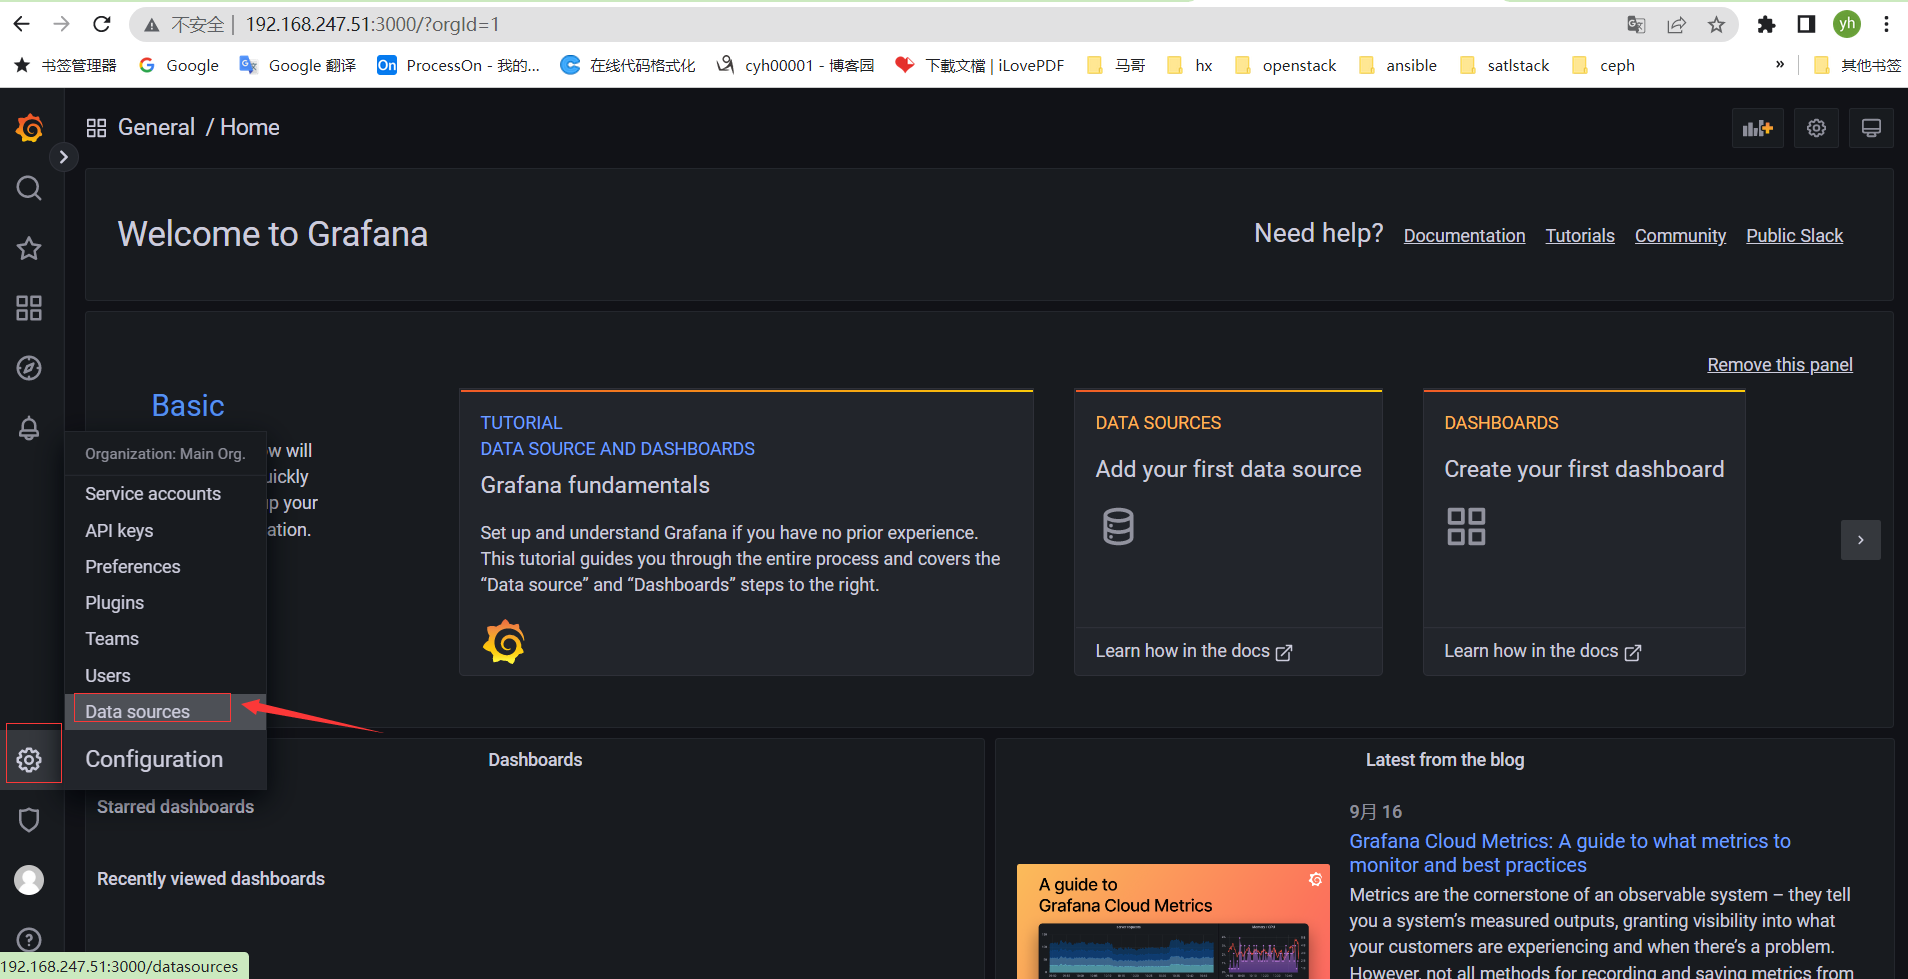
由于这里部署是本机,所以选择默认
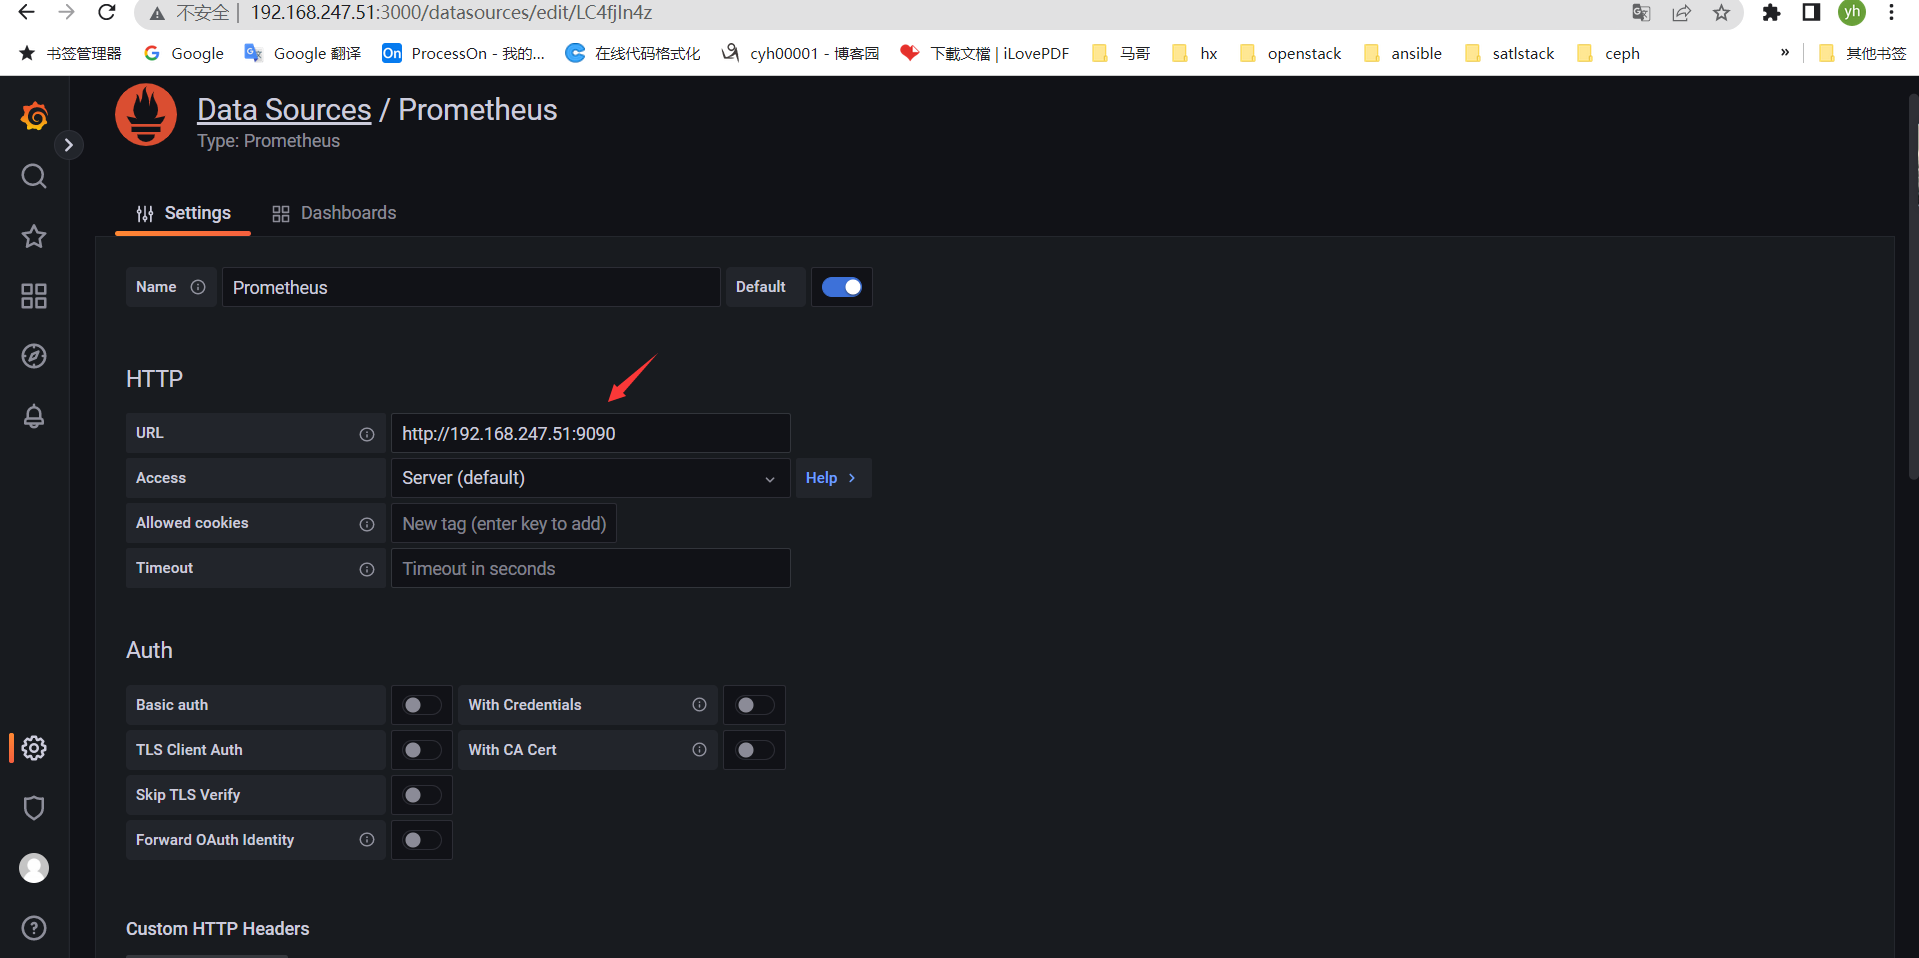
选择右下save&test


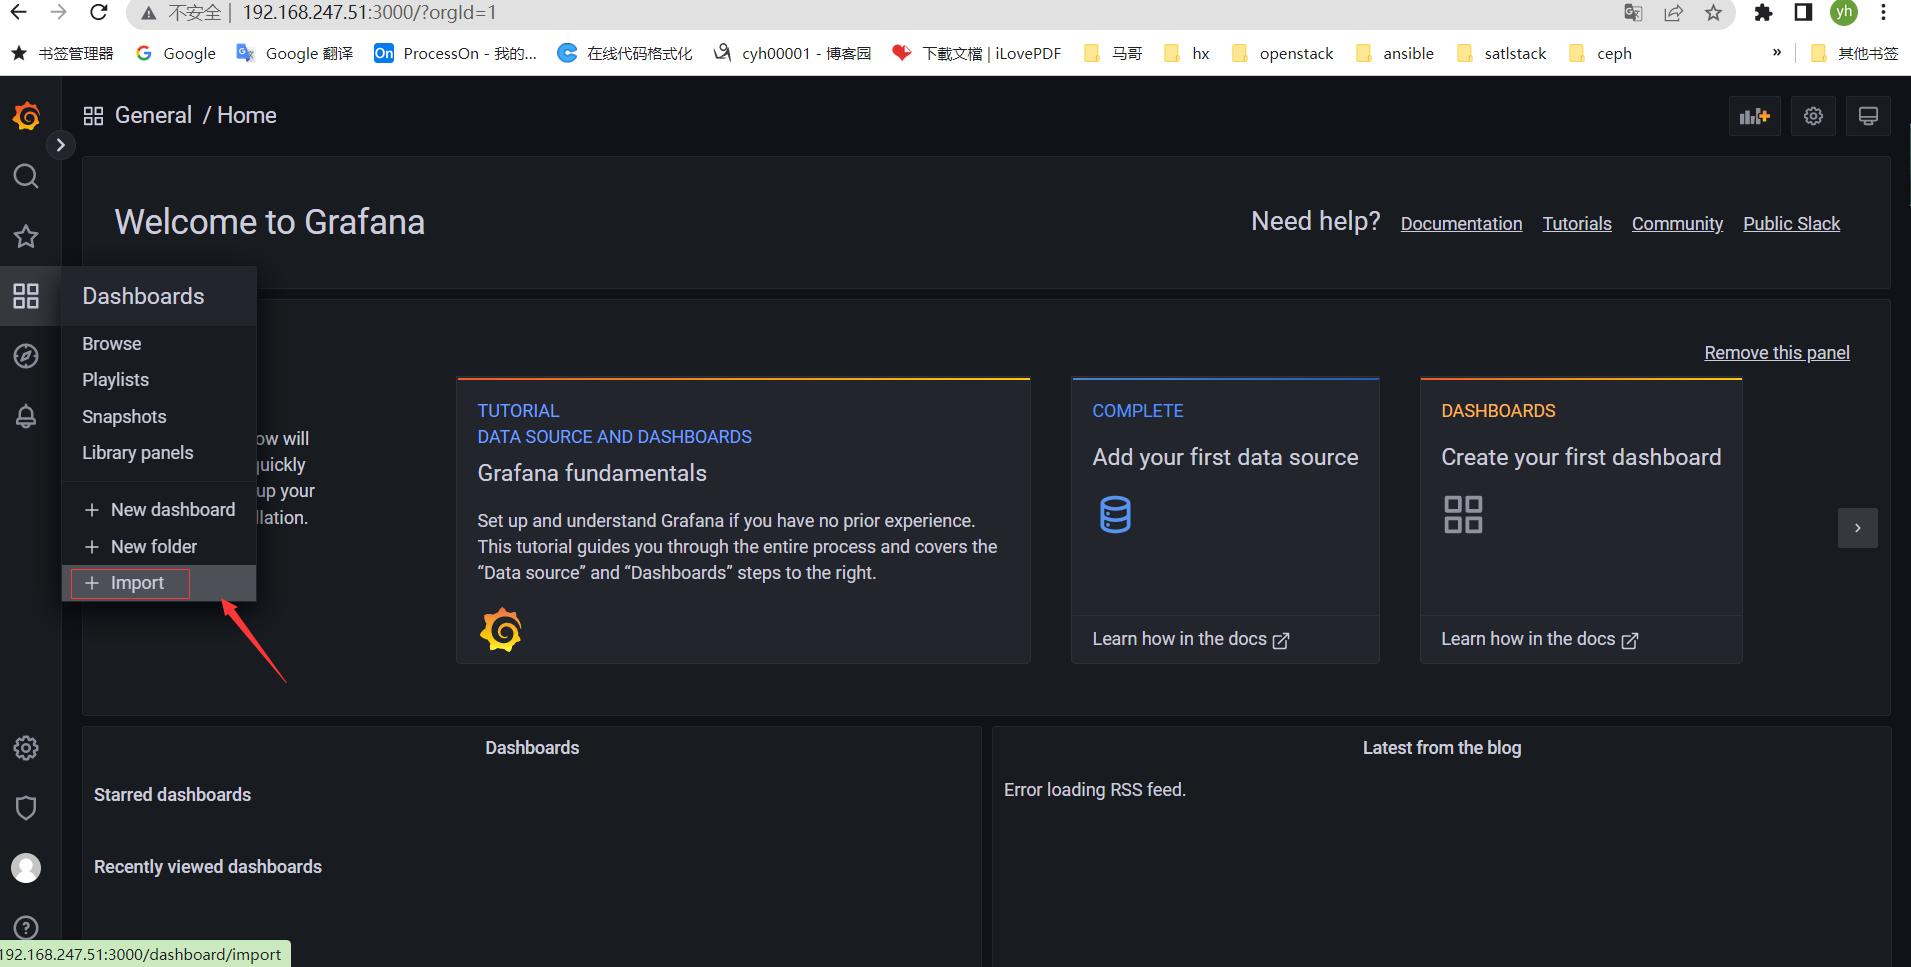
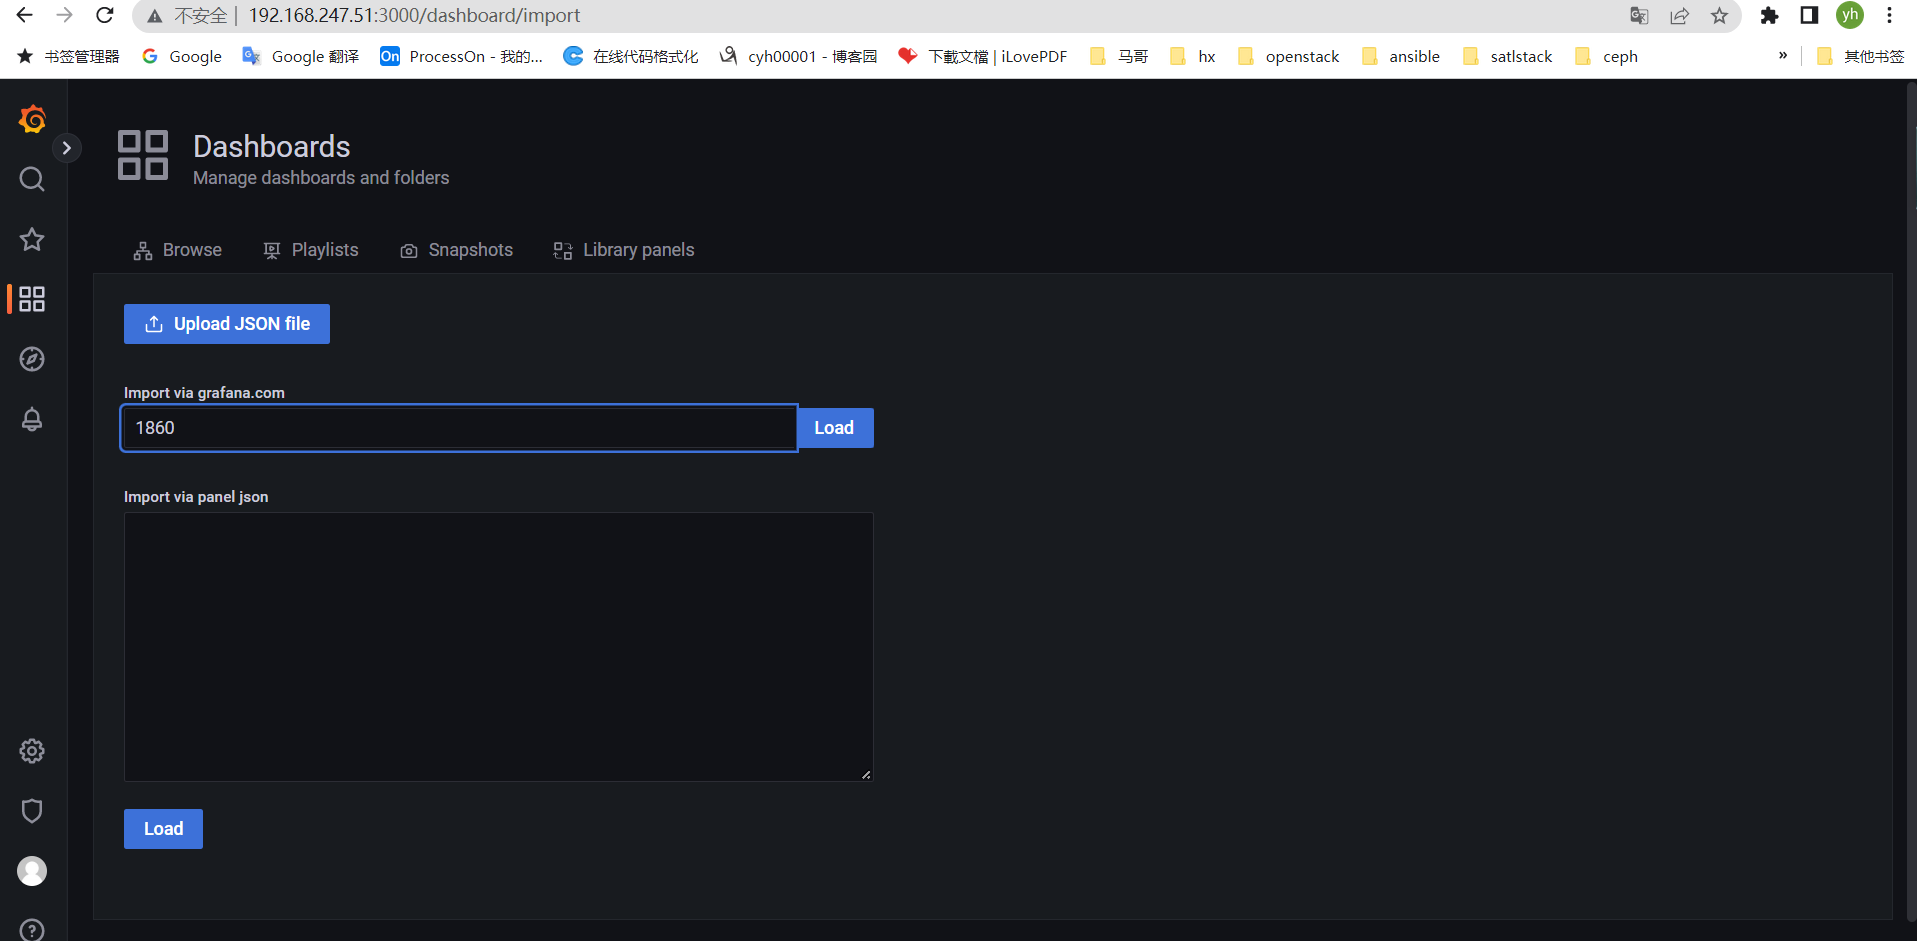
导入模板
官网模板搜索地址:https://grafana.com/grafana/dashboards/
导入process_exporter
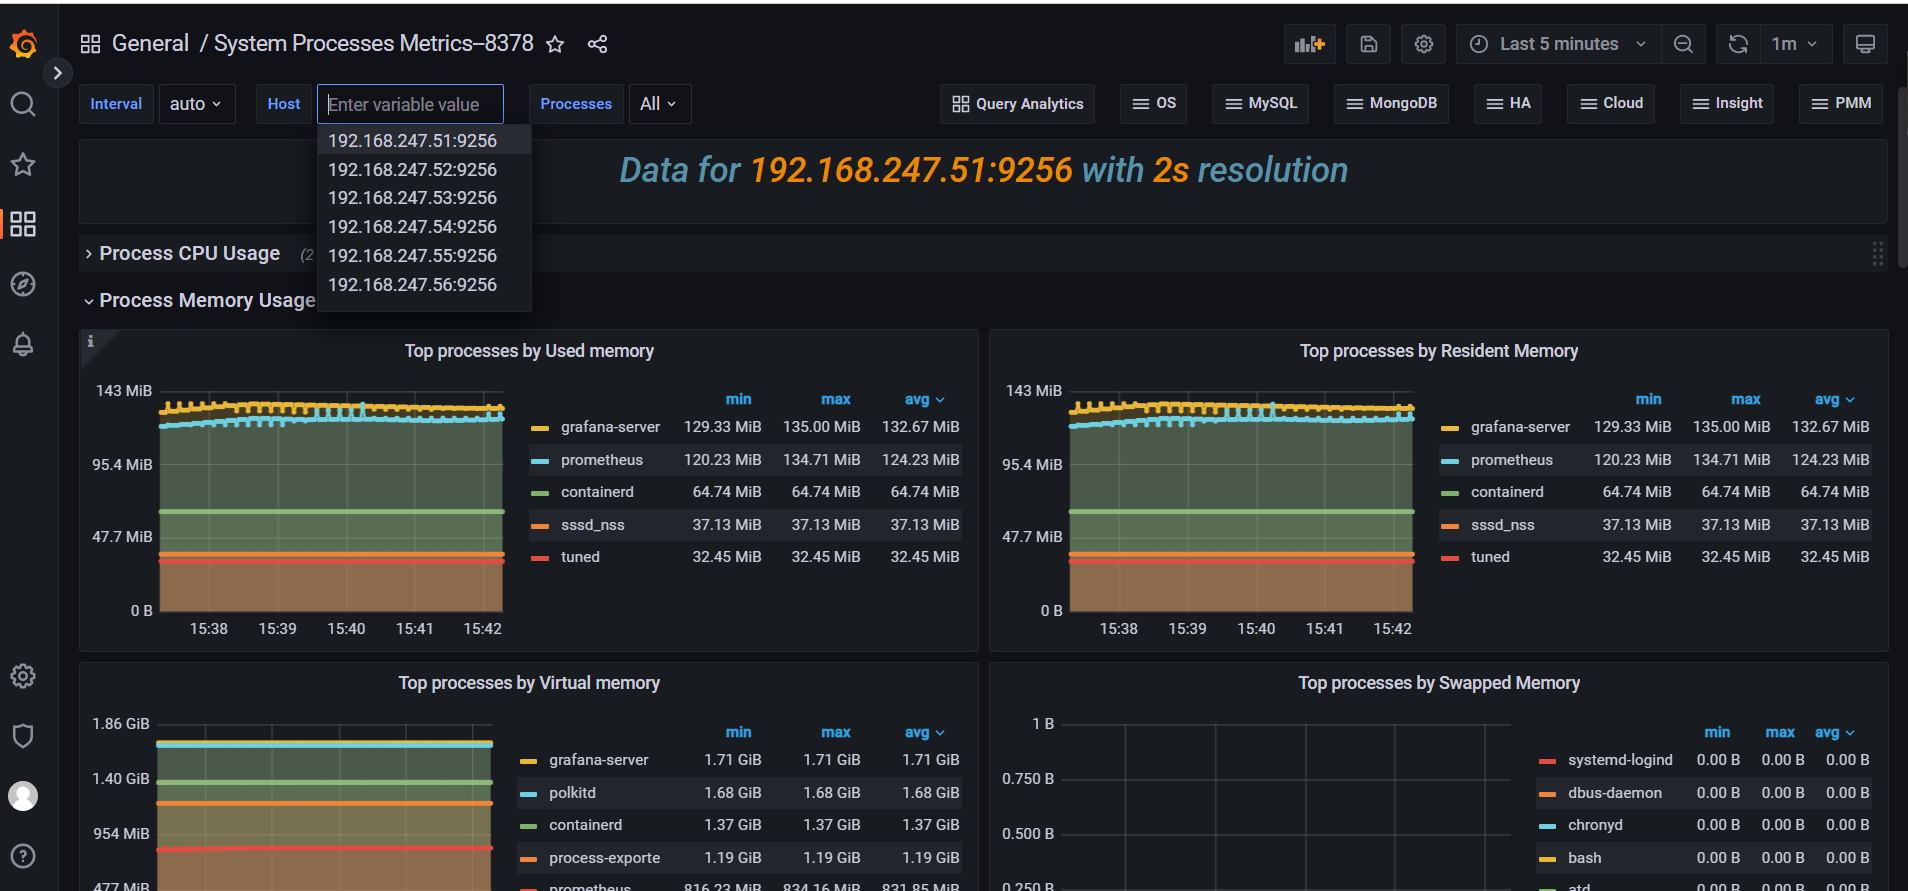
手动导入json文件
虚机-node-exporter


{ "annotations": { "list": [ { "builtIn": 1, "datasource": { "type": "datasource", "uid": "grafana" }, "enable": true, "hide": true, "iconColor": "rgba(0, 211, 255, 1)", "name": "Annotations & Alerts", "target": { "limit": 100, "matchAny": false, "tags": [], "type": "dashboard" }, "type": "dashboard" } ] }, "description": "使用 Node Exporter v0.16+,精简优化重要指标展示。https://github.com/starsliao/Prometheus", "editable": true, "fiscalYearStartMonth": 0, "gnetId": 8919, "graphTooltip": 0, "id": 6, "links": [ { "icon": "external link", "tags": [], "targetBlank": true, "title": "更新node_exporter", "tooltip": "", "type": "link", "url": "https://github.com/prometheus/node_exporter/releases" } ], "liveNow": false, "panels": [ { "datasource": { "type": "prometheus", "uid": "LC4fjIn4z" }, "editable": true, "error": false, "gridPos": { "h": 1, "w": 24, "x": 0, "y": 0 }, "id": 11, "links": [], "maxPerRow": 6, "options": { "content": "", "mode": "html" }, "pluginVersion": "9.1.5", "repeat": "node", "repeatDirection": "h", "style": {}, "targets": [ { "datasource": { "type": "prometheus", "uid": "LC4fjIn4z" }, "refId": "A" } ], "title": "$host——$hostname", "type": "text" }, { "datasource": { "type": "prometheus", "uid": "LC4fjIn4z" }, "description": "", "fieldConfig": { "defaults": { "color": { "mode": "thresholds" }, "decimals": 1, "mappings": [ { "options": { "match": "null", "result": { "text": "N/A" } }, "type": "special" } ], "thresholds": { "mode": "absolute", "steps": [ { "color": "rgba(245, 54, 54, 0.9)", "value": null }, { "color": "rgba(237, 129, 40, 0.89)", "value": 1 }, { "color": "rgba(50, 172, 45, 0.97)", "value": 2 } ] }, "unit": "s" }, "overrides": [] }, "gridPos": { "h": 2, "w": 2, "x": 0, "y": 1 }, "hideTimeOverride": true, "id": 15, "links": [], "maxDataPoints": 100, "options": { "colorMode": "value", "graphMode": "none", "justifyMode": "auto", "orientation": "horizontal", "reduceOptions": { "calcs": [ "lastNotNull" ], "fields": "", "values": false }, "text": {}, "textMode": "auto" }, "pluginVersion": "9.1.5", "targets": [ { "datasource": { "type": "prometheus", "uid": "LC4fjIn4z" }, "expr": "time() - node_boot_time_seconds{instance=~\"$host:$port\",business=~\"$business\"}", "format": "time_series", "hide": false, "instant": true, "intervalFactor": 2, "refId": "A", "step": 40 } ], "title": "系统运行时间", "type": "stat" }, { "datasource": { "type": "prometheus", "uid": "LC4fjIn4z" }, "description": "", "fieldConfig": { "defaults": { "color": { "mode": "thresholds" }, "mappings": [ { "options": { "match": "null", "result": { "text": "N/A" } }, "type": "special" } ], "thresholds": { "mode": "absolute", "steps": [ { "color": "rgba(245, 54, 54, 0.9)", "value": null }, { "color": "rgba(237, 129, 40, 0.89)", "value": 1 }, { "color": "rgba(50, 172, 45, 0.97)", "value": 2 } ] }, "unit": "short" }, "overrides": [] }, "gridPos": { "h": 2, "w": 2, "x": 2, "y": 1 }, "id": 14, "links": [], "maxDataPoints": 100, "options": { "colorMode": "value", "graphMode": "none", "justifyMode": "auto", "orientation": "horizontal", "reduceOptions": { "calcs": [ "lastNotNull" ], "fields": "", "values": false }, "text": {}, "textMode": "auto" }, "pluginVersion": "9.1.5", "targets": [ { "datasource": { "type": "prometheus", "uid": "LC4fjIn4z" }, "expr": "count(count(node_cpu_seconds_total{instance=~\"$host:$port\",business=~\"$business\", mode='system'}) by (cpu))", "format": "time_series", "instant": true, "intervalFactor": 1, "legendFormat": "", "refId": "A", "step": 20 } ], "title": "CPU 核数", "type": "stat" }, { "aliasColors": {}, "bars": false, "dashLength": 10, "dashes": false, "datasource": { "type": "prometheus", "uid": "LC4fjIn4z" }, "description": "", "fill": 1, "fillGradient": 0, "gridPos": { "h": 5, "w": 3, "x": 4, "y": 1 }, "hiddenSeries": false, "id": 167, "legend": { "avg": false, "current": false, "max": false, "min": false, "show": true, "total": false, "values": false }, "lines": true, "linewidth": 1, "links": [], "nullPointMode": "null", "options": { "alertThreshold": true }, "percentage": false, "pluginVersion": "9.1.5", "pointradius": 2, "points": false, "renderer": "flot", "seriesOverrides": [], "spaceLength": 10, "stack": false, "steppedLine": false, "targets": [ { "datasource": { "type": "prometheus", "uid": "LC4fjIn4z" }, "expr": "100 - (avg(irate(node_cpu_seconds_total{instance=~\"$host:$port\",business=~\"$business\",mode=\"idle\"}[5m])) * 100)", "format": "time_series", "hide": false, "interval": "", "intervalFactor": 1, "legendFormat": "", "refId": "A", "step": 20 } ], "thresholds": [], "timeRegions": [], "title": "CPU使用率(5m)", "tooltip": { "shared": true, "sort": 0, "value_type": "individual" }, "type": "graph", "xaxis": { "mode": "time", "show": true, "values": [] }, "yaxes": [ { "format": "short", "logBase": 1, "show": true }, { "format": "short", "logBase": 1, "show": true } ], "yaxis": { "align": false } }, { "datasource": { "type": "prometheus", "uid": "LC4fjIn4z" }, "description": "", "fieldConfig": { "defaults": { "color": { "mode": "thresholds" }, "decimals": 2, "mappings": [ { "options": { "match": "null", "result": { "text": "N/A" } }, "type": "special" } ], "max": 100, "min": 0, "thresholds": { "mode": "absolute", "steps": [ { "color": "rgba(50, 172, 45, 0.97)", "value": null }, { "color": "rgba(237, 129, 40, 0.89)", "value": 10 }, { "color": "rgba(245, 54, 54, 0.9)", "value": 30 } ] }, "unit": "percent" }, "overrides": [] }, "gridPos": { "h": 5, "w": 3, "x": 7, "y": 1 }, "id": 20, "links": [], "maxDataPoints": 100, "options": { "orientation": "horizontal", "reduceOptions": { "calcs": [ "lastNotNull" ], "fields": "", "values": false }, "showThresholdLabels": false, "showThresholdMarkers": true, "text": {} }, "pluginVersion": "9.1.5", "targets": [ { "datasource": { "type": "prometheus", "uid": "LC4fjIn4z" }, "expr": "avg(irate(node_cpu_seconds_total{instance=~\"$host:$port\",business=~\"$business\",mode=\"iowait\"}[5m])) * 100", "format": "time_series", "hide": false, "interval": "", "intervalFactor": 1, "legendFormat": "", "refId": "A", "step": 20 } ], "title": "CPU iowait(5m)", "type": "gauge" }, { "aliasColors": {}, "bars": false, "dashLength": 10, "dashes": false, "datasource": { "type": "prometheus", "uid": "LC4fjIn4z" }, "description": "", "fill": 1, "fillGradient": 0, "gridPos": { "h": 5, "w": 3, "x": 10, "y": 1 }, "hiddenSeries": false, "hideTimeOverride": false, "id": 172, "legend": { "avg": false, "current": false, "max": false, "min": false, "show": true, "total": false, "values": false }, "lines": true, "linewidth": 1, "links": [], "nullPointMode": "null", "options": { "alertThreshold": true }, "percentage": false, "pluginVersion": "9.1.5", "pointradius": 2, "points": false, "renderer": "flot", "seriesOverrides": [], "spaceLength": 10, "stack": false, "steppedLine": false, "targets": [ { "datasource": { "type": "prometheus", "uid": "LC4fjIn4z" }, "expr": "(node_memory_MemTotal_bytes{instance=~\"$host:$port\",business=~\"$business\"}-(node_memory_MemAvailable_bytes{instance=~\"$host:$port\",business=~\"$business\"}))\n/ (node_memory_MemTotal_bytes{instance=~\"$host:$port\",business=~\"$business\"}) * 100", "format": "time_series", "hide": true, "interval": "10s", "intervalFactor": 1, "refId": "A", "step": 20 }, { "datasource": { "type": "prometheus", "uid": "LC4fjIn4z" }, "expr": "((node_memory_MemTotal_bytes{instance=~\"$host:$port\",business=~\"$business\"})\n-(node_memory_MemFree_bytes{instance=~\"$host:$port\",business=~\"$business\"})\n-(node_memory_Buffers_bytes{instance=~\"$host:$port\",business=~\"$business\"})\n-(node_memory_SReclaimable_bytes{instance=~\"$host:$port\",business=~\"$business\"})\n-(node_memory_Cached_bytes{instance=~\"$host:$port\",business=~\"$business\"})) / (node_memory_MemTotal_bytes{instance=~\"$host:$port\",business=~\"$business\"}) * 100", "format": "time_series", "hide": false, "intervalFactor": 1, "refId": "B" } ], "thresholds": [], "timeRegions": [], "title": "内存使用率", "tooltip": { "shared": true, "sort": 0, "value_type": "individual" }, "type": "graph", "xaxis": { "mode": "time", "show": true, "values": [] }, "yaxes": [ { "format": "short", "logBase": 1, "show": true }, { "format": "short", "logBase": 1, "show": true } ], "yaxis": { "align": false } }, { "aliasColors": {}, "bars": false, "dashLength": 10, "dashes": false, "datasource": { "type": "prometheus", "uid": "LC4fjIn4z" }, "description": "", "fill": 1, "fillGradient": 0, "gridPos": { "h": 5, "w": 3, "x": 13, "y": 1 }, "hiddenSeries": false, "hideTimeOverride": false, "id": 16, "legend": { "avg": false, "current": true, "max": true, "min": true, "show": true, "total": false, "values": true }, "lines": true, "linewidth": 1, "links": [], "nullPointMode": "null", "options": { "alertThreshold": true }, "percentage": false, "pluginVersion": "9.1.5", "pointradius": 2, "points": false, "renderer": "flot", "seriesOverrides": [], "spaceLength": 10, "stack": false, "steppedLine": false, "targets": [ { "datasource": { "type": "prometheus", "uid": "LC4fjIn4z" }, "expr": "node_filefd_allocated{instance=~\"$host:$port\",business=~\"$business\"}", "format": "time_series", "instant": false, "interval": "10s", "intervalFactor": 1, "legendFormat": "$host", "refId": "B" } ], "thresholds": [], "timeRegions": [], "title": "当前打开的文件描述符", "tooltip": { "shared": true, "sort": 0, "value_type": "individual" }, "type": "graph", "xaxis": { "mode": "time", "show": true, "values": [] }, "yaxes": [ { "format": "short", "logBase": 1, "show": true }, { "format": "short", "logBase": 1, "show": true } ], "yaxis": { "align": false } }, { "datasource": { "type": "prometheus", "uid": "LC4fjIn4z" }, "description": "", "fieldConfig": { "defaults": { "color": { "mode": "thresholds" }, "mappings": [ { "options": { "match": "null", "result": { "text": "N/A" } }, "type": "special" } ], "max": 100, "min": 0, "thresholds": { "mode": "absolute", "steps": [ { "color": "rgba(50, 172, 45, 0.97)", "value": null }, { "color": "rgba(237, 129, 40, 0.89)", "value": 70 }, { "color": "rgba(245, 54, 54, 0.9)", "value": 90 } ] }, "unit": "percent" }, "overrides": [] }, "gridPos": { "h": 5, "w": 4, "x": 16, "y": 1 }, "id": 166, "links": [], "maxDataPoints": 100, "options": { "orientation": "horizontal", "reduceOptions": { "calcs": [ "lastNotNull" ], "fields": "", "values": false }, "showThresholdLabels": false, "showThresholdMarkers": true, "text": {} }, "pluginVersion": "9.1.5", "repeatDirection": "h", "targets": [ { "datasource": { "type": "prometheus", "uid": "LC4fjIn4z" }, "expr": "100 - ((node_filesystem_avail_bytes{instance=~\"$host:$port\",business=~\"$business\",mountpoint=\"/\",fstype=~\"ext4|xfs\"} * 100) / node_filesystem_size_bytes {instance=~\"$host:$port\",business=~\"$business\",mountpoint=\"/\",fstype=~\"ext4|xfs\"})", "format": "time_series", "interval": "10s", "intervalFactor": 1, "refId": "A", "step": 20 } ], "title": "根分区使用率", "type": "gauge" }, { "datasource": { "type": "prometheus", "uid": "LC4fjIn4z" }, "description": "通过变量maxmount获取最大的分区。", "fieldConfig": { "defaults": { "color": { "mode": "thresholds" }, "mappings": [ { "options": { "match": "null", "result": { "text": "N/A" } }, "type": "special" } ], "max": 100, "min": 0, "thresholds": { "mode": "absolute", "steps": [ { "color": "rgba(50, 172, 45, 0.97)", "value": null }, { "color": "rgba(237, 129, 40, 0.89)", "value": 70 }, { "color": "rgba(245, 54, 54, 0.9)", "value": 90 } ] }, "unit": "percent" }, "overrides": [] }, "gridPos": { "h": 5, "w": 4, "x": 20, "y": 1 }, "id": 154, "links": [], "maxDataPoints": 100, "options": { "orientation": "horizontal", "reduceOptions": { "calcs": [ "lastNotNull" ], "fields": "", "values": false }, "showThresholdLabels": false, "showThresholdMarkers": true, "text": {} }, "pluginVersion": "9.1.5", "repeatDirection": "h", "targets": [ { "datasource": { "type": "prometheus", "uid": "LC4fjIn4z" }, "expr": "100 - ((node_filesystem_avail_bytes{instance=~\"$host:$port\",business=~\"$business\",mountpoint=\"$maxmount\",fstype=~\"ext4|xfs\"} * 100) / node_filesystem_size_bytes {instance=~\"$host:$port\",business=~\"$business\",mountpoint=\"$maxmount\",fstype=~\"ext4|xfs\"})", "format": "time_series", "interval": "10s", "intervalFactor": 1, "refId": "A", "step": 20 } ], "title": "最大分区($maxmount)使用率", "type": "gauge" }, { "datasource": { "type": "prometheus", "uid": "LC4fjIn4z" }, "description": "60s之内正常(数据收集时间误差)", "fieldConfig": { "defaults": { "color": { "mode": "thresholds" }, "decimals": 1, "mappings": [ { "options": { "match": "null", "result": { "text": "N/A" } }, "type": "special" } ], "thresholds": { "mode": "absolute", "steps": [ { "color": "rgba(245, 54, 54, 0.9)", "value": null }, { "color": "rgba(237, 129, 40, 0.89)", "value": 1 }, { "color": "rgba(50, 172, 45, 0.97)", "value": 2 } ] }, "unit": "s" }, "overrides": [] }, "gridPos": { "h": 3, "w": 2, "x": 0, "y": 3 }, "hideTimeOverride": true, "id": 177, "links": [], "maxDataPoints": 100, "options": { "colorMode": "value", "graphMode": "none", "justifyMode": "auto", "orientation": "horizontal", "reduceOptions": { "calcs": [ "lastNotNull" ], "fields": "", "values": false }, "text": {}, "textMode": "auto" }, "pluginVersion": "9.1.5", "targets": [ { "datasource": { "type": "prometheus", "uid": "LC4fjIn4z" }, "expr": "time() - node_time_seconds{instance=~\"$host:$port\",business=~\"$business\"}", "format": "time_series", "hide": false, "instant": true, "intervalFactor": 1, "legendFormat": "", "refId": "A", "step": 40 } ], "title": "系统误差时间", "type": "stat" }, { "datasource": { "type": "prometheus", "uid": "LC4fjIn4z" }, "description": "", "fieldConfig": { "defaults": { "color": { "mode": "thresholds" }, "mappings": [ { "options": { "match": "null", "result": { "text": "N/A" } }, "type": "special" } ], "thresholds": { "mode": "absolute", "steps": [ { "color": "rgba(245, 54, 54, 0.9)", "value": null }, { "color": "rgba(237, 129, 40, 0.89)", "value": 2 }, { "color": "rgba(50, 172, 45, 0.97)", "value": 3 } ] }, "unit": "bytes" }, "overrides": [] }, "gridPos": { "h": 3, "w": 2, "x": 2, "y": 3 }, "id": 75, "links": [], "maxDataPoints": 100, "options": { "colorMode": "value", "graphMode": "none", "justifyMode": "auto", "orientation": "horizontal", "reduceOptions": { "calcs": [ "lastNotNull" ], "fields": "", "values": false }, "text": {}, "textMode": "auto" }, "pluginVersion": "9.1.5", "targets": [ { "datasource": { "type": "prometheus", "uid": "LC4fjIn4z" }, "expr": "node_memory_MemTotal_bytes{instance=~\"$host:$port\",business=~\"$business\"}", "format": "time_series", "instant": true, "intervalFactor": 1, "legendFormat": "{{instance}}", "refId": "A", "step": 20 } ], "title": "内存总量", "type": "stat" }, { "aliasColors": { "10.10.8.190_可用": "super-light-orange", "10.10.8.190_总内存": "super-light-green", "内存_Avaliable": "#6ED0E0", "内存_Cached": "#EF843C", "内存_Free": "semi-dark-yellow", "内存_Total": "#6d1f62", "内存_Used": "#eab839", "可用": "#9ac48a", "总内存": "#bf1b00" }, "bars": false, "dashLength": 10, "dashes": false, "datasource": { "type": "prometheus", "uid": "LC4fjIn4z" }, "decimals": 2, "fill": 1, "fillGradient": 0, "gridPos": { "h": 8, "w": 9, "x": 0, "y": 6 }, "height": "300", "hiddenSeries": false, "id": 156, "legend": { "alignAsTable": true, "avg": false, "current": true, "max": false, "min": false, "rightSide": false, "show": true, "total": false, "values": true }, "lines": true, "linewidth": 2, "links": [], "nullPointMode": "null", "options": { "alertThreshold": true }, "percentage": false, "pluginVersion": "9.1.5", "pointradius": 5, "points": false, "renderer": "flot", "seriesOverrides": [], "spaceLength": 10, "stack": false, "steppedLine": false, "targets": [ { "datasource": { "type": "prometheus", "uid": "LC4fjIn4z" }, "expr": "node_memory_MemTotal_bytes{instance=~\"$host:$port\",business=~\"$business\"}", "format": "time_series", "hide": false, "instant": false, "intervalFactor": 2, "legendFormat": "内存_Total", "refId": "A", "step": 4 }, { "datasource": { "type": "prometheus", "uid": "LC4fjIn4z" }, "expr": "node_memory_MemFree_bytes{instance=~\"$host:$port\",business=~\"$business\"}", "format": "time_series", "hide": false, "intervalFactor": 2, "legendFormat": "内存_Free", "refId": "C", "step": 4 }, { "datasource": { "type": "prometheus", "uid": "LC4fjIn4z" }, "expr": "node_memory_Buffers_bytes{instance=~\"$host:$port\",business=~\"$business\"}", "format": "time_series", "hide": false, "intervalFactor": 2, "legendFormat": "内存_Buffers", "refId": "D", "step": 4 }, { "datasource": { "type": "prometheus", "uid": "LC4fjIn4z" }, "expr": "node_memory_Cached_bytes{instance=~\"$host:$port\",business=~\"$business\"}", "format": "time_series", "hide": false, "intervalFactor": 2, "legendFormat": "内存_Cached", "refId": "E", "step": 4 }, { "datasource": { "type": "prometheus", "uid": "LC4fjIn4z" }, "expr": "node_memory_MemAvailable_bytes{instance=~\"$host:$port\",business=~\"$business\"}", "format": "time_series", "hide": false, "interval": "", "intervalFactor": 2, "legendFormat": "内存_Available", "refId": "F", "step": 4 }, { "datasource": { "type": "prometheus", "uid": "LC4fjIn4z" }, "expr": "(node_memory_MemTotal_bytes{instance=~\"$host:$port\",business=~\"$business\"})\n-(node_memory_MemFree_bytes{instance=~\"$host:$port\",business=~\"$business\"})\n-(node_memory_Buffers_bytes{instance=~\"$host:$port\",business=~\"$business\"})\n-(node_memory_Cached_bytes{instance=~\"$host:$port\",business=~\"$business\"})", "format": "time_series", "hide": false, "intervalFactor": 1, "legendFormat": "内存_used", "refId": "G" }, { "datasource": { "type": "prometheus", "uid": "LC4fjIn4z" }, "expr": "node_memory_SwapTotal_bytes{instance=~\"$host:$port\"}", "format": "time_series", "intervalFactor": 1, "legendFormat": "swap_total", "refId": "B" }, { "datasource": { "type": "prometheus", "uid": "LC4fjIn4z" }, "expr": "node_memory_SwapFree_bytes{instance=~\"$host:$port\"}", "format": "time_series", "intervalFactor": 1, "legendFormat": "swap_free", "refId": "H" }, { "datasource": { "type": "prometheus", "uid": "LC4fjIn4z" }, "expr": "node_memory_SwapTotal_bytes{instance=~\"$host:$port\"}-node_memory_SwapFree_bytes{instance=~\"$host:$port\"}", "format": "time_series", "intervalFactor": 1, "legendFormat": "swap_used", "refId": "I" }, { "datasource": { "type": "prometheus", "uid": "LC4fjIn4z" }, "expr": "node_memory_SReclaimable_bytes{instance=~\"$host:$port\"}", "format": "time_series", "intervalFactor": 1, "legendFormat": "SReclaimable_slab_khs", "refId": "J" }, { "datasource": { "type": "prometheus", "uid": "LC4fjIn4z" }, "expr": "node_memory_SUnreclaim_bytes{instance=~\"$host:$port\"}", "format": "time_series", "intervalFactor": 1, "legendFormat": "SUnreclaim_slab_bkhs", "refId": "K" } ], "thresholds": [], "timeRegions": [], "title": "内存信息", "tooltip": { "shared": true, "sort": 0, "value_type": "individual" }, "type": "graph", "xaxis": { "mode": "time", "show": true, "values": [] }, "yaxes": [ { "format": "bytes", "logBase": 1, "min": "0", "show": true }, { "format": "short", "logBase": 1, "show": true } ], "yaxis": { "align": false } }, { "aliasColors": { "/": "#eab839", "/boot": "#bf1b00", "/data": "#1f78c1" }, "breakPoint": "25%", "combine": { "label": "Others", "threshold": "" }, "datasource": { "type": "prometheus", "uid": "LC4fjIn4z" }, "decimals": 1, "fontSize": "50%", "format": "bytes", "gridPos": { "h": 8, "w": 4, "x": 9, "y": 6 }, "hideTimeOverride": false, "id": 171, "legend": { "header": "", "percentage": false, "percentageDecimals": 0, "show": true, "sideWidth": 142, "values": true }, "legendType": "Right side", "links": [], "maxDataPoints": 3, "nullPointMode": "connected", "pieType": "pie", "pluginVersion": "6.2.5", "strokeWidth": "2", "targets": [ { "datasource": { "type": "prometheus", "uid": "LC4fjIn4z" }, "exemplar": true, "expr": "node_filesystem_size_bytes {instance=~\"$host:$port\",business=~\"$business\",fstype=~\"ext3|ext4|xfs|fuse.ceph-fuse\"}", "format": "time_series", "instant": true, "interval": "10s", "intervalFactor": 2, "legendFormat": "{{mountpoint}}", "refId": "A" } ], "title": "磁盘总空间", "type": "grafana-piechart-panel", "valueName": "current" }, { "aliasColors": {}, "bars": false, "dashLength": 10, "dashes": false, "datasource": { "type": "prometheus", "uid": "LC4fjIn4z" }, "fill": 2, "fillGradient": 0, "gridPos": { "h": 8, "w": 11, "x": 13, "y": 6 }, "hiddenSeries": false, "id": 164, "legend": { "avg": false, "current": false, "max": false, "min": false, "rightSide": true, "show": true, "total": false, "values": false }, "lines": true, "linewidth": 1, "links": [], "nullPointMode": "null", "options": { "alertThreshold": true }, "percentage": false, "pluginVersion": "9.1.5", "pointradius": 2, "points": false, "renderer": "flot", "seriesOverrides": [], "spaceLength": 10, "stack": false, "steppedLine": false, "targets": [ { "datasource": { "type": "prometheus", "uid": "LC4fjIn4z" }, "expr": "node_filesystem_size_bytes{instance=~\"$host:$port\",business=~\"$business\",fstype=~\"ext4|xfs\"}", "format": "table", "hide": true, "instant": false, "intervalFactor": 1, "legendFormat": "", "refId": "C" }, { "datasource": { "type": "prometheus", "uid": "LC4fjIn4z" }, "expr": "node_filesystem_avail_bytes {instance=~\"$host:$port\",business=~\"$business\",fstype=~\"ext4|xfs|fuse.ceph-fuse\"}", "format": "time_series", "hide": false, "instant": false, "interval": "10s", "intervalFactor": 1, "legendFormat": "{{mountpoint}}", "refId": "A" }, { "datasource": { "type": "prometheus", "uid": "LC4fjIn4z" }, "expr": "1-(node_filesystem_free_bytes{instance=~\"$host:$port\",business=~\"$business\",fstype=~\"ext4|xfs\"} / node_filesystem_size_bytes{instance=~\"$host:$port\",business=~\"$business\",fstype=~\"ext4|xfs\"})", "format": "table", "hide": true, "instant": false, "intervalFactor": 1, "legendFormat": "", "refId": "B" } ], "thresholds": [], "timeRegions": [], "title": "各分区可用空间", "tooltip": { "shared": true, "sort": 0, "value_type": "individual" }, "type": "graph", "xaxis": { "mode": "time", "show": true, "values": [] }, "yaxes": [ { "format": "bytes", "logBase": 1, "show": true }, { "format": "short", "logBase": 1, "show": true } ], "yaxis": { "align": false } }, { "aliasColors": { "Iowait": "super-light-blue", "System": "dark-green", "User": "dark-yellow", "idle": "dark-purple", "steal": "super-light-red" }, "bars": false, "dashLength": 10, "dashes": false, "datasource": { "type": "prometheus", "uid": "LC4fjIn4z" }, "decimals": 2, "description": "node_disk_io_time_seconds_total:\n磁盘花费在输入/输出操作上的毫秒数。该值为累加值。(Milliseconds Spent Doing I/Os)\n\nirate(node_disk_io_time_seconds_total[1m]):\n计算每秒的速率:(last值-last前一个值)/时间戳差值,即:1秒钟内磁盘花费在I/O操作的时间占比。", "fill": 1, "fillGradient": 0, "gridPos": { "h": 5, "w": 12, "x": 0, "y": 14 }, "hiddenSeries": false, "id": 7, "legend": { "alignAsTable": true, "avg": true, "current": true, "hideEmpty": true, "hideZero": true, "max": true, "min": false, "rightSide": true, "show": true, "total": false, "values": true }, "lines": true, "linewidth": 1, "links": [], "nullPointMode": "null", "options": { "alertThreshold": true }, "percentage": false, "pluginVersion": "9.1.5", "pointradius": 2, "points": false, "renderer": "flot", "seriesOverrides": [], "spaceLength": 10, "stack": false, "steppedLine": false, "targets": [ { "datasource": { "type": "prometheus", "uid": "LC4fjIn4z" }, "expr": "avg(irate(node_cpu_seconds_total{instance=~\"$host:$port\",business=~\"$business\",mode=\"system\"}[2m])) by (instance)", "format": "time_series", "hide": false, "instant": false, "interval": "", "intervalFactor": 2, "legendFormat": "System", "refId": "A", "step": 20 }, { "datasource": { "type": "prometheus", "uid": "LC4fjIn4z" }, "expr": "avg(irate(node_cpu_seconds_total{instance=~\"$host:$port\",business=~\"$business\",mode=\"user\"}[2m])) by (instance)", "format": "time_series", "hide": false, "intervalFactor": 2, "legendFormat": "User", "refId": "B", "step": 240 }, { "datasource": { "type": "prometheus", "uid": "LC4fjIn4z" }, "expr": "avg(irate(node_cpu_seconds_total{instance=~\"$host:$port\",business=~\"$business\",mode=\"iowait\"}[2m])) by (instance)", "format": "time_series", "hide": false, "intervalFactor": 2, "legendFormat": "Iowait", "refId": "D", "step": 240 }, { "datasource": { "type": "prometheus", "uid": "LC4fjIn4z" }, "expr": "avg(irate(node_cpu_seconds_total{instance=~\"$host:$port\",business=~\"$business\",mode=\"irq\"}[2m])) by (instance)", "format": "time_series", "intervalFactor": 2, "legendFormat": "irq", "refId": "C" }, { "datasource": { "type": "prometheus", "uid": "LC4fjIn4z" }, "expr": "avg(irate(node_cpu_seconds_total{instance=~\"$host:$port\",business=~\"$business\",mode=\"nice\"}[2m])) by (instance)", "format": "time_series", "intervalFactor": 2, "legendFormat": "nice", "refId": "E" }, { "datasource": { "type": "prometheus", "uid": "LC4fjIn4z" }, "expr": "avg(irate(node_cpu_seconds_total{instance=~\"$host:$port\",business=~\"$business\",mode=\"softirq\"}[2m])) by (instance)", "format": "time_series", "instant": false, "intervalFactor": 2, "legendFormat": "softirq", "refId": "G" }, { "datasource": { "type": "prometheus", "uid": "LC4fjIn4z" }, "expr": "avg(irate(node_cpu_seconds_total{instance=~\"$host:$port\",business=~\"$business\",mode=\"steal\"}[2m])) by (instance)", "format": "time_series", "instant": false, "intervalFactor": 2, "legendFormat": "steal", "refId": "H" }, { "datasource": { "type": "prometheus", "uid": "LC4fjIn4z" }, "expr": "avg(irate(node_cpu_seconds_total{instance=~\"$host:$port\",business=~\"$business\",mode=\"idle\"}[2m])) by (instance)", "format": "time_series", "hide": true, "intervalFactor": 2, "legendFormat": "idle", "refId": "F" } ], "thresholds": [], "timeRegions": [], "title": "CPU使用率(1m)", "tooltip": { "shared": true, "sort": 0, "value_type": "individual" }, "type": "graph", "xaxis": { "mode": "time", "show": true, "values": [] }, "yaxes": [ { "format": "percentunit", "logBase": 1, "show": true }, { "format": "short", "logBase": 1, "show": true } ], "yaxis": { "align": false } }, { "aliasColors": { "15分钟": "#6ED0E0", "1分钟": "#BF1B00", "5分钟": "#CCA300" }, "bars": false, "dashLength": 10, "dashes": false, "datasource": { "type": "prometheus", "uid": "LC4fjIn4z" }, "decimals": 2, "editable": true, "error": false, "fill": 1, "fillGradient": 0, "grid": {}, "gridPos": { "h": 5, "w": 12, "x": 12, "y": 14 }, "height": "300", "hiddenSeries": false, "id": 13, "legend": { "alignAsTable": true, "avg": true, "current": true, "max": true, "min": false, "rightSide": true, "show": true, "total": false, "values": true }, "lines": true, "linewidth": 2, "links": [], "maxPerRow": 6, "nullPointMode": "null as zero", "options": { "alertThreshold": true }, "percentage": false, "pluginVersion": "9.1.5", "pointradius": 5, "points": false, "renderer": "flot", "seriesOverrides": [], "spaceLength": 10, "stack": false, "steppedLine": false, "targets": [ { "datasource": { "type": "prometheus", "uid": "LC4fjIn4z" }, "expr": "node_load1{instance=~\"$host:$port\",business=~\"$business\"}", "format": "time_series", "instant": false, "interval": "10s", "intervalFactor": 2, "legendFormat": "1m", "metric": "", "refId": "A", "step": 20, "target": "" }, { "datasource": { "type": "prometheus", "uid": "LC4fjIn4z" }, "expr": "node_load5{instance=~\"$host:$port\",business=~\"$business\"}", "format": "time_series", "instant": false, "interval": "10s", "intervalFactor": 2, "legendFormat": "5m", "refId": "B", "step": 20 }, { "datasource": { "type": "prometheus", "uid": "LC4fjIn4z" }, "expr": "node_load15{instance=~\"$host:$port\",business=~\"$business\"}", "format": "time_series", "instant": false, "interval": "10s", "intervalFactor": 2, "legendFormat": "15m", "refId": "C", "step": 20 } ], "thresholds": [], "timeRegions": [], "title": "系统平均负载", "tooltip": { "msResolution": false, "shared": true, "sort": 0, "value_type": "cumulative" }, "type": "graph", "xaxis": { "mode": "time", "show": true, "values": [] }, "yaxes": [ { "format": "short", "logBase": 1, "show": true }, { "format": "short", "logBase": 1, "show": true } ], "yaxis": { "align": false } }, { "aliasColors": {}, "bars": false, "dashLength": 10, "dashes": false, "datasource": { "type": "prometheus", "uid": "LC4fjIn4z" }, "description": "node_disk_io_time_seconds_total:\n磁盘花费在输入/输出操作上的毫秒数。该值为累加值。(Milliseconds Spent Doing I/Os)\n\nirate(node_disk_io_time_seconds_total[1m]):\n计算每秒的速率:(last值-last前一个值)/时间戳差值,即:1秒钟内磁盘花费在I/O操作的时间占比。", "fill": 1, "fillGradient": 0, "gridPos": { "h": 9, "w": 6, "x": 0, "y": 19 }, "hiddenSeries": false, "id": 175, "legend": { "alignAsTable": true, "avg": false, "current": true, "max": true, "min": false, "show": true, "total": false, "values": true }, "lines": true, "linewidth": 1, "links": [], "nullPointMode": "null", "options": { "alertThreshold": true }, "percentage": false, "pluginVersion": "8.1.2", "pointradius": 2, "points": false, "renderer": "flot", "seriesOverrides": [], "spaceLength": 10, "stack": false, "steppedLine": false, "targets": [ { "datasource": { "type": "prometheus", "uid": "LC4fjIn4z" }, "expr": "avg(irate(node_cpu_seconds_total{instance=~\"$host:$port\",business=~\"$business\",mode=\"system\"}[2m])) by (instance)", "format": "time_series", "hide": true, "instant": false, "interval": "", "intervalFactor": 2, "legendFormat": "System", "refId": "A", "step": 20 }, { "datasource": { "type": "prometheus", "uid": "LC4fjIn4z" }, "expr": "avg(irate(node_cpu_seconds_total{instance=~\"$host:$port\",business=~\"$business\",mode=\"user\"}[2m])) by (instance)", "format": "time_series", "hide": true, "intervalFactor": 2, "legendFormat": "User", "refId": "B", "step": 240 }, { "datasource": { "type": "prometheus", "uid": "LC4fjIn4z" }, "expr": "avg(irate(node_cpu_seconds_total{instance=~\"$host:$port\",business=~\"$business\",mode=\"idle\"}[2m])) by (instance)", "format": "time_series", "hide": true, "intervalFactor": 2, "legendFormat": "Idle", "refId": "F", "step": 240 }, { "datasource": { "type": "prometheus", "uid": "LC4fjIn4z" }, "expr": "avg(irate(node_cpu_seconds_total{instance=~\"$host:$port\",business=~\"$business\",mode=\"iowait\"}[2m])) by (instance)", "format": "time_series", "hide": true, "intervalFactor": 2, "legendFormat": "Iowait", "refId": "D", "step": 240 }, { "datasource": { "type": "prometheus", "uid": "LC4fjIn4z" }, "expr": "irate(node_disk_io_time_seconds_total{instance=~\"$host:$port\",business=~\"$business\"}[5m])", "format": "time_series", "intervalFactor": 1, "legendFormat": "{{host}}_{{device}}", "refId": "C" } ], "thresholds": [], "timeRegions": [], "title": "磁盘使用率百分比(%)", "tooltip": { "shared": true, "sort": 0, "value_type": "individual" }, "type": "graph", "xaxis": { "mode": "time", "show": true, "values": [] }, "yaxes": [ { "format": "percentunit", "logBase": 1, "show": true }, { "format": "short", "logBase": 1, "show": true } ], "yaxis": { "align": false } }, { "aliasColors": { "vda": "#6ED0E0" }, "bars": false, "dashLength": 10, "dashes": false, "datasource": { "type": "prometheus", "uid": "LC4fjIn4z" }, "description": "", "fill": 3, "fillGradient": 0, "gridPos": { "h": 9, "w": 7, "x": 6, "y": 19 }, "height": "300", "hiddenSeries": false, "id": 160, "legend": { "alignAsTable": true, "avg": false, "current": true, "hideEmpty": false, "hideZero": false, "max": true, "min": false, "show": true, "sort": "max", "sortDesc": true, "total": false, "values": true }, "lines": true, "linewidth": 1, "links": [], "nullPointMode": "null", "options": { "alertThreshold": true }, "percentage": false, "pluginVersion": "8.1.2", "pointradius": 5, "points": false, "renderer": "flot", "seriesOverrides": [ { "alias": "/,*_读取$/", "transform": "negative-Y" } ], "spaceLength": 10, "stack": false, "steppedLine": false, "targets": [ { "datasource": { "type": "prometheus", "uid": "LC4fjIn4z" }, "expr": "irate(node_disk_io_time_seconds_total{instance=~\"$host:$port\",business=~\"$business\"}[2m])", "format": "time_series", "hide": true, "interval": "", "intervalFactor": 2, "legendFormat": "{{device}}", "refId": "A", "step": 10 }, { "datasource": { "type": "prometheus", "uid": "LC4fjIn4z" }, "expr": "irate(node_disk_io_time_weighted_seconds_total{instance=~\"$host:$port\",business=~\"$business\"}[2m])", "format": "time_series", "hide": true, "intervalFactor": 1, "legendFormat": "{{device}}_加权", "refId": "D" }, { "datasource": { "type": "prometheus", "uid": "LC4fjIn4z" }, "expr": "irate(node_disk_read_time_seconds_total{instance=~\"$host:$port\",business=~\"$business\"}[5m])/irate(node_disk_reads_completed_total{instance=~\"$host:$port\",business=~\"$business\"}[5m])", "format": "time_series", "hide": false, "interval": "", "intervalFactor": 1, "legendFormat": "{{host}}_{{device}}_读取", "refId": "B" }, { "datasource": { "type": "prometheus", "uid": "LC4fjIn4z" }, "expr": "irate(node_disk_write_time_seconds_total{instance=~\"$host:$port\",business=~\"$business\"}[5m])/irate(node_disk_writes_completed_total{instance=~\"$host:$port\",business=~\"$business\"}[5m])", "format": "time_series", "hide": false, "intervalFactor": 1, "legendFormat": "{{host}}_{{device}}_写入", "refId": "C" } ], "thresholds": [], "timeRegions": [], "title": "每次IO读写的耗时", "tooltip": { "shared": true, "sort": 0, "value_type": "individual" }, "type": "graph", "xaxis": { "mode": "time", "show": true, "values": [] }, "yaxes": [ { "format": "s", "label": "读取(-)/写入(+)", "logBase": 1, "show": true }, { "format": "short", "logBase": 1, "show": false } ], "yaxis": { "align": false } }, { "aliasColors": { "vda_write": "#6ED0E0" }, "bars": true, "dashLength": 10, "dashes": false, "datasource": { "type": "prometheus", "uid": "LC4fjIn4z" }, "description": "Reads completed: 每个磁盘分区每秒读完成次数\n\nWrites completed: 每个磁盘分区每秒写完成次数\n\nIO now 每个磁盘分区每秒正在处理的输入/输出请求数", "fill": 2, "fillGradient": 0, "gridPos": { "h": 9, "w": 5, "x": 13, "y": 19 }, "height": "300", "hiddenSeries": false, "id": 161, "legend": { "alignAsTable": true, "avg": false, "current": true, "hideEmpty": true, "hideZero": true, "max": true, "min": false, "show": true, "sort": "current", "sortDesc": true, "total": false, "values": true }, "lines": false, "linewidth": 1, "links": [], "nullPointMode": "null", "options": { "alertThreshold": true }, "percentage": false, "pluginVersion": "8.1.2", "pointradius": 5, "points": false, "renderer": "flot", "seriesOverrides": [ { "alias": "/.*_读取$/", "transform": "negative-Y" } ], "spaceLength": 10, "stack": false, "steppedLine": false, "targets": [ { "datasource": { "type": "prometheus", "uid": "LC4fjIn4z" }, "expr": "irate(node_disk_reads_completed_total{instance=~\"$host:$port\",business=~\"$business\"}[2m])", "format": "time_series", "hide": false, "interval": "", "intervalFactor": 2, "legendFormat": "{{host}}_{{device}}_读取", "refId": "A", "step": 10 }, { "datasource": { "type": "prometheus", "uid": "LC4fjIn4z" }, "expr": "irate(node_disk_writes_completed_total{instance=~\"$host:$port\",business=~\"$business\"}[2m])", "format": "time_series", "hide": false, "intervalFactor": 2, "legendFormat": "{{host}}_{{device}}_写入", "refId": "B", "step": 10 }, { "datasource": { "type": "prometheus", "uid": "LC4fjIn4z" }, "expr": "node_disk_io_now{instance=~\"$host:$port\",business=~\"$business\"}", "format": "time_series", "hide": true, "interval": "", "intervalFactor": 1, "legendFormat": "{{device}}", "refId": "C" } ], "thresholds": [], "timeRegions": [], "title": "磁盘读写速率(IOPS)", "tooltip": { "shared": true, "sort": 0, "value_type": "individual" }, "type": "graph", "xaxis": { "mode": "time", "show": true, "values": [] }, "yaxes": [ { "format": "iops", "label": "读取(-)/写入(+)I/O ops/sec", "logBase": 1, "show": true }, { "format": "short", "logBase": 1, "show": true } ], "yaxis": { "align": false } }, { "aliasColors": { "vda_write": "#6ED0E0" }, "bars": true, "dashLength": 10, "dashes": false, "datasource": { "type": "prometheus", "uid": "LC4fjIn4z" }, "description": "Read bytes 每个磁盘分区每秒读取的比特数\nWritten bytes 每个磁盘分区每秒写入的比特数", "fill": 2, "fillGradient": 0, "gridPos": { "h": 9, "w": 6, "x": 18, "y": 19 }, "height": "300", "hiddenSeries": false, "id": 168, "legend": { "alignAsTable": true, "avg": false, "current": true, "hideEmpty": true, "hideZero": true, "max": true, "min": false, "show": true, "total": false, "values": true }, "lines": false, "linewidth": 1, "links": [], "nullPointMode": "null", "options": { "alertThreshold": true }, "percentage": false, "pluginVersion": "8.1.2", "pointradius": 5, "points": false, "renderer": "flot", "seriesOverrides": [ { "alias": "/.*_读取$/", "transform": "negative-Y" } ], "spaceLength": 10, "stack": false, "steppedLine": false, "targets": [ { "datasource": { "type": "prometheus", "uid": "LC4fjIn4z" }, "expr": "irate(node_disk_read_bytes_total{instance=~\"$host:$port\",business=~\"$business\"}[5m])", "format": "time_series", "interval": "", "intervalFactor": 2, "legendFormat": "{{host}}_{{device}}_读取", "refId": "A", "step": 10 }, { "datasource": { "type": "prometheus", "uid": "LC4fjIn4z" }, "expr": "irate(node_disk_written_bytes_total{instance=~\"$host:$port\",business=~\"$business\"}[5m])", "format": "time_series", "hide": false, "intervalFactor": 2, "legendFormat": "{{host}}_{{device}}_写入", "refId": "B", "step": 10 } ], "thresholds": [], "timeRegions": [], "title": "磁盘读写容量大小", "tooltip": { "shared": true, "sort": 0, "value_type": "individual" }, "type": "graph", "xaxis": { "mode": "time", "show": true, "values": [] }, "yaxes": [ { "format": "Bps", "label": "读取(-)/写入(+)", "logBase": 1, "show": true }, { "format": "short", "logBase": 1, "show": false } ], "yaxis": { "align": false } }, { "aliasColors": {}, "bars": false, "dashLength": 10, "dashes": false, "datasource": { "type": "prometheus", "uid": "LC4fjIn4z" }, "decimals": 2, "description": "", "fill": 1, "fillGradient": 0, "gridPos": { "h": 8, "w": 12, "x": 0, "y": 28 }, "hiddenSeries": false, "id": 185, "legend": { "alignAsTable": true, "avg": false, "current": true, "max": true, "min": false, "show": true, "total": false, "values": true }, "lines": true, "linewidth": 1, "links": [], "nullPointMode": "null", "options": { "alertThreshold": true }, "percentage": false, "pluginVersion": "8.1.2", "pointradius": 2, "points": false, "renderer": "flot", "seriesOverrides": [], "spaceLength": 10, "stack": false, "steppedLine": false, "targets": [ { "datasource": { "type": "prometheus", "uid": "LC4fjIn4z" }, "expr": "node_disk_io_now{instance=~\"$host:$port\",business=~\"$business\"}", "format": "time_series", "intervalFactor": 1, "legendFormat": "{{host}}_{{device}}_当前未完成的I/O数量", "refId": "C" } ], "thresholds": [], "timeRegions": [], "title": "当前未完成的I/O数量", "tooltip": { "shared": true, "sort": 0, "value_type": "individual" }, "type": "graph", "xaxis": { "mode": "time", "show": true, "values": [] }, "yaxes": [ { "decimals": 2, "format": "short", "logBase": 1, "show": true }, { "decimals": 2, "format": "short", "logBase": 1, "show": true } ], "yaxis": { "align": false } }, { "aliasColors": {}, "bars": false, "dashLength": 10, "dashes": false, "datasource": { "type": "prometheus", "uid": "LC4fjIn4z" }, "decimals": 2, "description": "", "fill": 1, "fillGradient": 0, "gridPos": { "h": 8, "w": 12, "x": 12, "y": 28 }, "hiddenSeries": false, "id": 183, "legend": { "alignAsTable": true, "avg": false, "current": true, "max": true, "min": false, "show": true, "total": false, "values": true }, "lines": true, "linewidth": 1, "links": [], "nullPointMode": "null", "options": { "alertThreshold": true }, "percentage": false, "pluginVersion": "8.1.2", "pointradius": 2, "points": false, "renderer": "flot", "seriesOverrides": [], "spaceLength": 10, "stack": false, "steppedLine": false, "targets": [ { "datasource": { "type": "prometheus", "uid": "LC4fjIn4z" }, "expr": "irate(node_disk_io_time_weighted_seconds_total{instance=~\"$host:$port\",business=~\"$business\"}[2m])", "format": "time_series", "intervalFactor": 1, "legendFormat": "{{host}}_{{device}}_磁盘每秒的io加权秒数", "refId": "A" } ], "thresholds": [], "timeRegions": [], "title": "磁盘每秒的io加权秒数", "tooltip": { "shared": true, "sort": 0, "value_type": "individual" }, "type": "graph", "xaxis": { "mode": "time", "show": true, "values": [] }, "yaxes": [ { "decimals": 2, "format": "short", "logBase": 1, "show": true }, { "decimals": 2, "format": "short", "logBase": 1, "show": true } ], "yaxis": { "align": false } }, { "aliasColors": {}, "bars": false, "dashLength": 10, "dashes": false, "datasource": { "type": "prometheus", "uid": "LC4fjIn4z" }, "fill": 1, "fillGradient": 0, "gridPos": { "h": 8, "w": 12, "x": 0, "y": 36 }, "height": "300", "hiddenSeries": false, "id": 157, "legend": { "alignAsTable": true, "avg": false, "current": true, "hideEmpty": true, "hideZero": true, "max": true, "min": true, "rightSide": false, "show": true, "sort": "current", "sortDesc": true, "total": false, "values": true }, "lines": true, "linewidth": 2, "links": [], "nullPointMode": "null", "options": { "alertThreshold": true }, "percentage": false, "pluginVersion": "8.1.2", "pointradius": 5, "points": false, "renderer": "flot", "seriesOverrides": [ { "alias": "/.*_out上传$/", "transform": "negative-Y" } ], "spaceLength": 10, "stack": false, "steppedLine": false, "targets": [ { "datasource": { "type": "prometheus", "uid": "LC4fjIn4z" }, "expr": "irate(node_network_receive_bytes_total{instance=~\"$host:$port\",business=~\"$business\",device!~'tap.*|veth.*|br.*|docker.*|virbr*|lo*'}[5m])*8", "format": "time_series", "intervalFactor": 1, "legendFormat": "{{host}}_{{device}}_in下载", "refId": "A", "step": 4 }, { "datasource": { "type": "prometheus", "uid": "LC4fjIn4z" }, "expr": "irate(node_network_transmit_bytes_total{instance=~\"$host:$port\",business=~\"$business\",device!~'tap.*|veth.*|br.*|docker.*|virbr*|lo*'}[5m])*8", "format": "time_series", "intervalFactor": 1, "legendFormat": "{{host}}_{{device}}_out上传", "refId": "B", "step": 4 } ], "thresholds": [], "timeRegions": [], "title": "网络流量", "tooltip": { "shared": true, "sort": 0, "value_type": "individual" }, "type": "graph", "xaxis": { "mode": "time", "show": true, "values": [] }, "yaxes": [ { "format": "bps", "label": "上传(-)/下载(+)", "logBase": 1, "show": true }, { "format": "short", "logBase": 1, "show": false } ], "yaxis": { "align": false } }, { "aliasColors": { "TCP": "#6ED0E0" }, "bars": false, "dashLength": 10, "dashes": false, "datasource": { "type": "prometheus", "uid": "LC4fjIn4z" }, "description": "CurrEstab - 当前状态为 ESTABLISHED 或 CLOSE-WAIT 的 TCP 连接数\n\nActiveOpens - 已从 CLOSED 状态直接转换到 SYN-SENT 状态的 TCP 平均连接数(1分钟内)\n\nPassiveOpens - 已从 LISTEN 状态直接转换到 SYN-RCVD 状态的 TCP 平均连接数(1分钟内)\n\nTCP_alloc - 已分配(已建立、已申请到sk_buff)的TCP套接字数量\n\nTCP_inuse - 正在使用(正在侦听)的TCP套接字数量\n\nTCP_tw - 等待关闭的TCP连接数", "fill": 0, "fillGradient": 0, "gridPos": { "h": 8, "w": 12, "x": 12, "y": 36 }, "height": "300", "hiddenSeries": false, "id": 158, "legend": { "alignAsTable": true, "avg": false, "current": true, "max": true, "min": false, "rightSide": false, "show": true, "total": false, "values": true }, "lines": true, "linewidth": 1, "links": [], "nullPointMode": "null", "options": { "alertThreshold": true }, "percentage": false, "pluginVersion": "8.1.2", "pointradius": 5, "points": false, "renderer": "flot", "seriesOverrides": [], "spaceLength": 10, "stack": false, "steppedLine": false, "targets": [ { "datasource": { "type": "prometheus", "uid": "LC4fjIn4z" }, "expr": "node_netstat_Tcp_CurrEstab{instance=~\"$host:$port\",business=~\"$business\"}", "format": "time_series", "hide": true, "interval": "10s", "intervalFactor": 1, "legendFormat": "{{host}}_ESTABLISHED", "refId": "A", "step": 20 }, { "datasource": { "type": "prometheus", "uid": "LC4fjIn4z" }, "expr": "node_sockstat_TCP_tw{instance=~\"$host:$port\",business=~\"$business\"}", "format": "time_series", "hide": true, "intervalFactor": 1, "legendFormat": "{{host}}_TCP_tw", "refId": "D" }, { "datasource": { "type": "prometheus", "uid": "LC4fjIn4z" }, "expr": "irate(node_netstat_Tcp_ActiveOpens{instance=~\"$host:$port\",business=~\"$business\"}[1m])", "format": "time_series", "hide": true, "intervalFactor": 1, "legendFormat": "{{host}}_ActiveOpens", "refId": "B" }, { "datasource": { "type": "prometheus", "uid": "LC4fjIn4z" }, "expr": "irate(node_netstat_Tcp_PassiveOpens{instance=~\"$host:$port\",business=~\"$business\"}[1m])", "format": "time_series", "hide": true, "intervalFactor": 1, "legendFormat": "{{host}}_PassiveOpens", "refId": "C" }, { "datasource": { "type": "prometheus", "uid": "LC4fjIn4z" }, "expr": "node_sockstat_TCP_alloc{instance=~\"$host:$port\",business=~\"$business\"}", "format": "time_series", "hide": true, "intervalFactor": 1, "legendFormat": "{{host}}_TCP_alloc", "refId": "E" }, { "datasource": { "type": "prometheus", "uid": "LC4fjIn4z" }, "expr": "node_sockstat_TCP_inuse{instance=~\"$host:$port\",business=~\"$business\"}", "format": "time_series", "hide": true, "intervalFactor": 1, "legendFormat": "{{host}}_TCP_inuse", "refId": "F" }, { "datasource": { "type": "prometheus", "uid": "LC4fjIn4z" }, "expr": "node_tcp_connection_states{instance=~\"$host:$port\",business=~\"$business\"}", "format": "time_series", "intervalFactor": 1, "legendFormat": "{{host}}_TCP_{{state}}", "refId": "G" } ], "thresholds": [], "timeRegions": [], "title": "TCP 连接情况(只显示有数值的状态)", "tooltip": { "shared": true, "sort": 0, "value_type": "individual" }, "type": "graph", "xaxis": { "mode": "time", "show": true, "values": [] }, "yaxes": [ { "format": "short", "logBase": 1, "show": true }, { "format": "short", "logBase": 1, "show": true } ], "yaxis": { "align": false } }, { "aliasColors": {}, "bars": false, "dashLength": 10, "dashes": false, "datasource": { "type": "prometheus", "uid": "LC4fjIn4z" }, "fill": 1, "fillGradient": 0, "gridPos": { "h": 8, "w": 12, "x": 0, "y": 44 }, "height": "300", "hiddenSeries": false, "id": 179, "legend": { "alignAsTable": true, "avg": false, "current": true, "hideEmpty": false, "hideZero": false, "max": true, "min": true, "rightSide": false, "show": true, "sort": "current", "sortDesc": true, "total": false, "values": true }, "lines": true, "linewidth": 2, "links": [], "nullPointMode": "null", "options": { "alertThreshold": true }, "percentage": false, "pluginVersion": "8.1.2", "pointradius": 5, "points": false, "renderer": "flot", "seriesOverrides": [ { "alias": "/.*发出$/", "transform": "negative-Y" } ], "spaceLength": 10, "stack": false, "steppedLine": false, "targets": [ { "datasource": { "type": "prometheus", "uid": "LC4fjIn4z" }, "expr": "idelta(node_network_receive_packets_total{instance=~\"$host:$port\",business=~\"$business\",device!~'tap.*|veth.*|br.*|docker.*|virbr*|lo*'}[3m])", "format": "time_series", "intervalFactor": 1, "legendFormat": "{{host}}_{{device}}_接收", "refId": "C" }, { "datasource": { "type": "prometheus", "uid": "LC4fjIn4z" }, "expr": "idelta(node_network_transmit_packets_total{instance=~\"$host:$port\",business=~\"$business\",device!~'tap.*|veth.*|br.*|docker.*|virbr*|lo*'}[3m])", "format": "time_series", "intervalFactor": 1, "legendFormat": "{{host}}_{{device}}_发出", "refId": "A" } ], "thresholds": [], "timeRegions": [], "title": "数据包", "tooltip": { "shared": true, "sort": 0, "value_type": "individual" }, "type": "graph", "xaxis": { "mode": "time", "show": true, "values": [] }, "yaxes": [ { "format": "none", "label": "发出(-)/接收(+)", "logBase": 1, "show": true }, { "format": "short", "logBase": 1, "show": false } ], "yaxis": { "align": false } }, { "aliasColors": {}, "bars": false, "dashLength": 10, "dashes": false, "datasource": { "type": "prometheus", "uid": "LC4fjIn4z" }, "fill": 1, "fillGradient": 0, "gridPos": { "h": 8, "w": 12, "x": 12, "y": 44 }, "height": "300", "hiddenSeries": false, "id": 181, "legend": { "alignAsTable": true, "avg": false, "current": true, "hideEmpty": false, "hideZero": false, "max": true, "min": true, "rightSide": false, "show": true, "sort": "current", "sortDesc": true, "total": false, "values": true }, "lines": true, "linewidth": 2, "links": [], "nullPointMode": "null", "options": { "alertThreshold": true }, "percentage": false, "pluginVersion": "8.1.2", "pointradius": 5, "points": false, "renderer": "flot", "seriesOverrides": [ { "alias": "/.*transmit$/", "transform": "negative-Y" } ], "spaceLength": 10, "stack": false, "steppedLine": false, "targets": [ { "datasource": { "type": "prometheus", "uid": "LC4fjIn4z" }, "expr": "idelta(node_network_receive_drop_total{instance=~\"$host:$port\",business=~\"$business\",device!~'tap.*|veth.*|br.*|docker.*|virbr*|lo*'}[3m])", "format": "time_series", "intervalFactor": 1, "legendFormat": "{{host}}_{{device}}_receive-drop", "refId": "C" }, { "datasource": { "type": "prometheus", "uid": "LC4fjIn4z" }, "expr": "idelta(node_network_receive_errs_total{instance=~\"$host:$port\",business=~\"$business\",device!~'tap.*|veth.*|br.*|docker.*|virbr*|lo*'}[3m])", "format": "time_series", "hide": false, "intervalFactor": 1, "legendFormat": "{{host}}_{{device}}_receive-errs", "refId": "A" }, { "datasource": { "type": "prometheus", "uid": "LC4fjIn4z" }, "expr": "idelta(node_network_receive_frame_total{instance=~\"$host:$port\",business=~\"$business\",device!~'tap.*|veth.*|br.*|docker.*|virbr*|lo*'}[3m])", "format": "time_series", "intervalFactor": 1, "legendFormat": "{{host}}_{{device}}_receive-frame", "refId": "B" }, { "datasource": { "type": "prometheus", "uid": "LC4fjIn4z" }, "expr": "idelta(node_network_transmit_drop_total{instance=~\"$host:$port\",business=~\"$business\",device!~'tap.*|veth.*|br.*|docker.*|virbr*|lo*'}[3m])", "format": "time_series", "intervalFactor": 1, "legendFormat": "{{host}}_{{device}}_transmit-drop", "refId": "D" }, { "datasource": { "type": "prometheus", "uid": "LC4fjIn4z" }, "expr": "idelta(node_network_transmit_errs_total{instance=~\"$host:$port\",business=~\"$business\",device!~'tap.*|veth.*|br.*|docker.*|virbr*|lo*'}[3m])", "format": "time_series", "intervalFactor": 1, "legendFormat": "{{host}}_{{device}}_transmit-errs", "refId": "E" } ], "thresholds": [], "timeRegions": [], "title": "drop/errs/frame", "tooltip": { "shared": true, "sort": 0, "value_type": "individual" }, "type": "graph", "xaxis": { "mode": "time", "show": true, "values": [] }, "yaxes": [ { "format": "none", "label": "transmit(-)/receive(+)", "logBase": 1, "show": true }, { "format": "short", "logBase": 1, "show": false } ], "yaxis": { "align": false } }, { "aliasColors": {}, "bars": false, "dashLength": 10, "dashes": false, "datasource": { "type": "prometheus", "uid": "LC4fjIn4z" }, "decimals": 2, "description": "", "fill": 1, "fillGradient": 0, "gridPos": { "h": 8, "w": 12, "x": 0, "y": 52 }, "hiddenSeries": false, "id": 182, "legend": { "alignAsTable": true, "avg": false, "current": true, "max": true, "min": false, "show": true, "total": false, "values": true }, "lines": true, "linewidth": 1, "links": [], "nullPointMode": "null", "options": { "alertThreshold": true }, "percentage": false, "pluginVersion": "8.1.2", "pointradius": 2, "points": false, "renderer": "flot", "seriesOverrides": [], "spaceLength": 10, "stack": false, "steppedLine": false, "targets": [ { "datasource": { "type": "prometheus", "uid": "LC4fjIn4z" }, "expr": "rate(node_disk_read_bytes_total{instance=~\"$host:$port\",business=~\"$business\"}[5m])/rate(node_disk_reads_completed_total{instance=~\"$host:$port\",business=~\"$business\"}[5m])*512", "format": "time_series", "hide": false, "instant": false, "intervalFactor": 1, "legendFormat": "{{host}}_{{device}}", "refId": "C" }, { "datasource": { "type": "prometheus", "uid": "LC4fjIn4z" }, "expr": "irate(node_disk_read_bytes_total{instance=~\"$host:$port\",business=~\"$business\"}[5m])/irate(node_disk_reads_completed_total{instance=~\"$host:$port\",business=~\"$business\"}[5m])*512", "format": "time_series", "hide": true, "intervalFactor": 1, "legendFormat": "{{host}}_{{device}}", "refId": "A" } ], "thresholds": [], "timeRegions": [], "title": "每个读请求的平均大小", "tooltip": { "shared": true, "sort": 0, "value_type": "individual" }, "type": "graph", "xaxis": { "mode": "time", "show": true, "values": [] }, "yaxes": [ { "decimals": 2, "format": "bytes", "logBase": 1, "show": true }, { "decimals": 2, "format": "short", "logBase": 1, "show": true } ], "yaxis": { "align": false } }, { "aliasColors": {}, "bars": false, "dashLength": 10, "dashes": false, "datasource": { "type": "prometheus", "uid": "LC4fjIn4z" }, "decimals": 2, "description": "", "fill": 1, "fillGradient": 0, "gridPos": { "h": 8, "w": 12, "x": 12, "y": 52 }, "hiddenSeries": false, "id": 186, "legend": { "alignAsTable": true, "avg": false, "current": true, "max": true, "min": false, "show": true, "total": false, "values": true }, "lines": true, "linewidth": 1, "links": [], "nullPointMode": "null", "options": { "alertThreshold": true }, "percentage": false, "pluginVersion": "8.1.2", "pointradius": 2, "points": false, "renderer": "flot", "seriesOverrides": [], "spaceLength": 10, "stack": false, "steppedLine": false, "targets": [ { "datasource": { "type": "prometheus", "uid": "LC4fjIn4z" }, "expr": "irate(node_disk_written_bytes_total{instance=~\"$host:$port\",business=~\"$business\"}[5m])/irate(node_disk_writes_completed_total{instance=~\"$host:$port\",business=~\"$business\"}[5m])", "format": "time_series", "hide": false, "instant": false, "intervalFactor": 1, "legendFormat": "{{host}}_{{device}}", "refId": "C" } ], "thresholds": [], "timeRegions": [], "title": "每个写请求的平均大小", "tooltip": { "shared": true, "sort": 0, "value_type": "individual" }, "type": "graph", "xaxis": { "mode": "time", "show": true, "values": [] }, "yaxes": [ { "decimals": 2, "format": "Bps", "logBase": 1, "show": true }, { "decimals": 2, "format": "short", "logBase": 1, "show": true } ], "yaxis": { "align": false } }, { "aliasColors": {}, "bars": false, "dashLength": 10, "dashes": false, "datasource": { "type": "prometheus", "uid": "LC4fjIn4z" }, "description": "读入/读出的交换分区页数 ", "fill": 1, "fillGradient": 0, "gridPos": { "h": 6, "w": 12, "x": 0, "y": 60 }, "height": "300", "hiddenSeries": false, "id": 187, "legend": { "alignAsTable": true, "avg": false, "current": true, "hideEmpty": false, "hideZero": false, "max": true, "min": true, "rightSide": false, "show": true, "sort": "current", "sortDesc": true, "total": false, "values": true }, "lines": true, "linewidth": 2, "links": [], "nullPointMode": "null", "options": { "alertThreshold": true }, "percentage": false, "pluginVersion": "8.1.2", "pointradius": 5, "points": false, "renderer": "flot", "seriesOverrides": [], "spaceLength": 10, "stack": false, "steppedLine": false, "targets": [ { "datasource": { "type": "prometheus", "uid": "LC4fjIn4z" }, "expr": "irate(node_vmstat_pswpin{instance=~\"$host:$port\",business=~\"$business\"}[2m])", "format": "time_series", "instant": false, "intervalFactor": 1, "legendFormat": "{{host}}", "refId": "C" } ], "thresholds": [], "timeRegions": [], "title": " 数据从磁盘交换区转入内存的速率", "tooltip": { "shared": true, "sort": 0, "value_type": "individual" }, "type": "graph", "xaxis": { "mode": "time", "show": true, "values": [] }, "yaxes": [ { "format": "pps", "label": "", "logBase": 1, "show": true }, { "format": "short", "logBase": 1, "show": false } ], "yaxis": { "align": false } }, { "aliasColors": {}, "bars": false, "dashLength": 10, "dashes": false, "datasource": { "type": "prometheus", "uid": "LC4fjIn4z" }, "description": "读入/读出的交换分区页数 ", "fill": 1, "fillGradient": 0, "gridPos": { "h": 6, "w": 12, "x": 12, "y": 60 }, "height": "300", "hiddenSeries": false, "id": 188, "legend": { "alignAsTable": true, "avg": false, "current": true, "hideEmpty": false, "hideZero": false, "max": true, "min": true, "rightSide": false, "show": true, "sort": "current", "sortDesc": true, "total": false, "values": true }, "lines": true, "linewidth": 2, "links": [], "nullPointMode": "null", "options": { "alertThreshold": true }, "percentage": false, "pluginVersion": "8.1.2", "pointradius": 5, "points": false, "renderer": "flot", "seriesOverrides": [], "spaceLength": 10, "stack": false, "steppedLine": false, "targets": [ { "datasource": { "type": "prometheus", "uid": "LC4fjIn4z" }, "expr": "irate(node_vmstat_pswpout{instance=~\"$host:$port\",business=~\"$business\"}[2m])", "format": "time_series", "intervalFactor": 1, "legendFormat": "{{host}}", "refId": "C" } ], "thresholds": [], "timeRegions": [], "title": "数据从内存转储到磁盘交换区的速率", "tooltip": { "shared": true, "sort": 0, "value_type": "individual" }, "type": "graph", "xaxis": { "mode": "time", "show": true, "values": [] }, "yaxes": [ { "format": "pps", "label": "", "logBase": 1, "show": true }, { "format": "short", "logBase": 1, "show": false } ], "yaxis": { "align": false } }, { "aliasColors": {}, "bars": false, "dashLength": 10, "dashes": false, "datasource": { "type": "prometheus", "uid": "LC4fjIn4z" }, "fill": 0, "fillGradient": 0, "gridPos": { "h": 10, "w": 24, "x": 0, "y": 66 }, "hiddenSeries": false, "id": 169, "legend": { "alignAsTable": true, "avg": true, "current": true, "hideEmpty": true, "hideZero": true, "max": true, "min": false, "rightSide": true, "show": true, "total": false, "values": true }, "lines": true, "linewidth": 1, "links": [], "nullPointMode": "null as zero", "options": { "alertThreshold": true }, "percentage": false, "pluginVersion": "8.1.2", "pointradius": 0.5, "points": false, "renderer": "flot", "seriesOverrides": [], "spaceLength": 10, "stack": false, "steppedLine": false, "targets": [ { "datasource": { "type": "prometheus", "uid": "LC4fjIn4z" }, "expr": "node_hwmon_temp_celsius{instance=~\"$host:$port\",business=~\"$business\"}", "format": "time_series", "intervalFactor": 1, "legendFormat": "{{host}}_{{chip}}_{{sensor}}", "refId": "A" } ], "thresholds": [], "timeRegions": [], "title": "硬件温度", "tooltip": { "shared": true, "sort": 0, "value_type": "individual" }, "type": "graph", "xaxis": { "mode": "time", "show": true, "values": [] }, "yaxes": [ { "format": "celsius", "logBase": 1, "show": true }, { "format": "short", "logBase": 1, "show": true } ], "yaxis": { "align": false } } ], "refresh": false, "schemaVersion": 37, "style": "dark", "tags": [ "node-exporter---dc" ], "templating": { "list": [ { "auto": true, "auto_count": 10, "auto_min": "10s", "current": { "selected": false, "text": "5s", "value": "5s" }, "hide": 0, "label": "interval", "name": "interval", "options": [ { "selected": false, "text": "auto", "value": "$__auto_interval_interval" }, { "selected": true, "text": "5s", "value": "5s" }, { "selected": false, "text": "10s", "value": "10s" }, { "selected": false, "text": "30s", "value": "30s" }, { "selected": false, "text": "1m", "value": "1m" }, { "selected": false, "text": "10m", "value": "10m" }, { "selected": false, "text": "30m", "value": "30m" }, { "selected": false, "text": "1h", "value": "1h" }, { "selected": false, "text": "6h", "value": "6h" }, { "selected": false, "text": "12h", "value": "12h" }, { "selected": false, "text": "1d", "value": "1d" } ], "query": "5s,10s,30s,1m,10m,30m,1h,6h,12h,1d", "refresh": 2, "skipUrlSync": false, "type": "interval" }, { "current": { "isNone": true, "selected": false, "text": "None", "value": "" }, "datasource": { "type": "prometheus", "uid": "LC4fjIn4z" }, "definition": "label_values(node_exporter_build_info,dc)", "hide": 0, "includeAll": false, "label": "test", "multi": false, "name": "test", "options": [], "query": { "query": "label_values(node_exporter_build_info,dc)", "refId": "Prometheus-DC-Variable-Query" }, "refresh": 2, "regex": "", "skipUrlSync": false, "sort": 1, "tagValuesQuery": "", "tagsQuery": "", "type": "query", "useTags": false }, { "allFormat": "glob", "allValue": "", "current": { "selected": false, "text": "All", "value": "$__all" }, "datasource": { "type": "prometheus", "uid": "LC4fjIn4z" }, "definition": "label_values(node_exporter_build_info{job='consul_sd_node_exporter'},business)", "hide": 0, "includeAll": true, "label": "业务线", "multi": true, "multiFormat": "regex values", "name": "business", "options": [], "query": { "query": "label_values(node_exporter_build_info{job='consul_sd_node_exporter'},business)", "refId": "Prometheus-business-Variable-Query" }, "refresh": 2, "regex": "", "skipUrlSync": false, "sort": 1, "tagsQuery": "", "type": "query", "useTags": false }, { "allFormat": "glob", "current": { "selected": false, "text": "192.168.247.51", "value": "192.168.247.51" }, "datasource": { "type": "prometheus", "uid": "LC4fjIn4z" }, "definition": "label_values(node_exporter_build_info{job='consul_sd_node_exporter', business=~'$business'},host)", "hide": 0, "includeAll": false, "label": "HOST", "multi": false, "multiFormat": "regex values", "name": "host", "options": [], "query": { "query": "label_values(node_exporter_build_info{job='consul_sd_node_exporter', business=~'$business'},host)", "refId": "Prometheus-host-Variable-Query" }, "refresh": 2, "regex": "", "skipUrlSync": false, "sort": 1, "tagValuesQuery": "", "tagsQuery": "", "type": "query", "useTags": false }, { "current": { "selected": false, "text": "monitoring-node-01", "value": "monitoring-node-01" }, "datasource": { "type": "prometheus", "uid": "LC4fjIn4z" }, "definition": "label_values(node_uname_info{job='consul_sd_node_exporter',host='$host'},nodename)", "hide": 0, "includeAll": false, "label": "hostname", "multi": false, "name": "hostname", "options": [], "query": { "query": "label_values(node_uname_info{job='consul_sd_node_exporter',host='$host'},nodename)", "refId": "Prometheus-hostname-Variable-Query" }, "refresh": 2, "regex": "", "skipUrlSync": false, "sort": 1, "tagValuesQuery": "", "tagsQuery": "", "type": "query", "useTags": false }, { "allFormat": "glob", "current": { "selected": false, "text": "51234", "value": "51234" }, "datasource": { "type": "prometheus", "uid": "LC4fjIn4z" }, "definition": "label_values(node_exporter_build_info{job='consul_sd_node_exporter'},instance)", "hide": 0, "includeAll": false, "label": "PORT", "multi": false, "multiFormat": "regex values", "name": "port", "options": [], "query": { "query": "label_values(node_exporter_build_info{job='consul_sd_node_exporter'},instance)", "refId": "Prometheus-port-Variable-Query" }, "refresh": 2, "regex": "/.*\\:(.*)/", "skipUrlSync": false, "sort": 1, "tagValuesQuery": "", "tagsQuery": "", "type": "query", "useTags": false }, { "current": { "selected": false, "text": "/", "value": "/" }, "datasource": { "type": "prometheus", "uid": "LC4fjIn4z" }, "definition": "query_result(topk(1,sort_desc (max(node_filesystem_size_bytes{instance=~\"$host:$port\",business=~\"$business\",fstype=~\"ext4|xfs\"}) by (mountpoint))))", "hide": 2, "includeAll": false, "label": "", "multi": false, "name": "maxmount", "options": [], "query": { "query": "query_result(topk(1,sort_desc (max(node_filesystem_size_bytes{instance=~\"$host:$port\",business=~\"$business\",fstype=~\"ext4|xfs\"}) by (mountpoint))))", "refId": "Prometheus-maxmount-Variable-Query" }, "refresh": 2, "regex": "/.*\\\"(.*)\\\".*/", "skipUrlSync": false, "sort": 0, "tagValuesQuery": "", "tagsQuery": "", "type": "query", "useTags": false } ] }, "time": { "from": "now-5m", "to": "now" }, "timepicker": { "hidden": false, "now": true, "refresh_intervals": [ "1d" ], "time_options": [ "5m", "15m", "1h", "6h", "12h", "24h", "2d", "7d", "30d" ] }, "timezone": "browser", "title": "虚机-node-exporter", "uid": "v2QSeJI7z", "version": 1, "weekStart": "" }
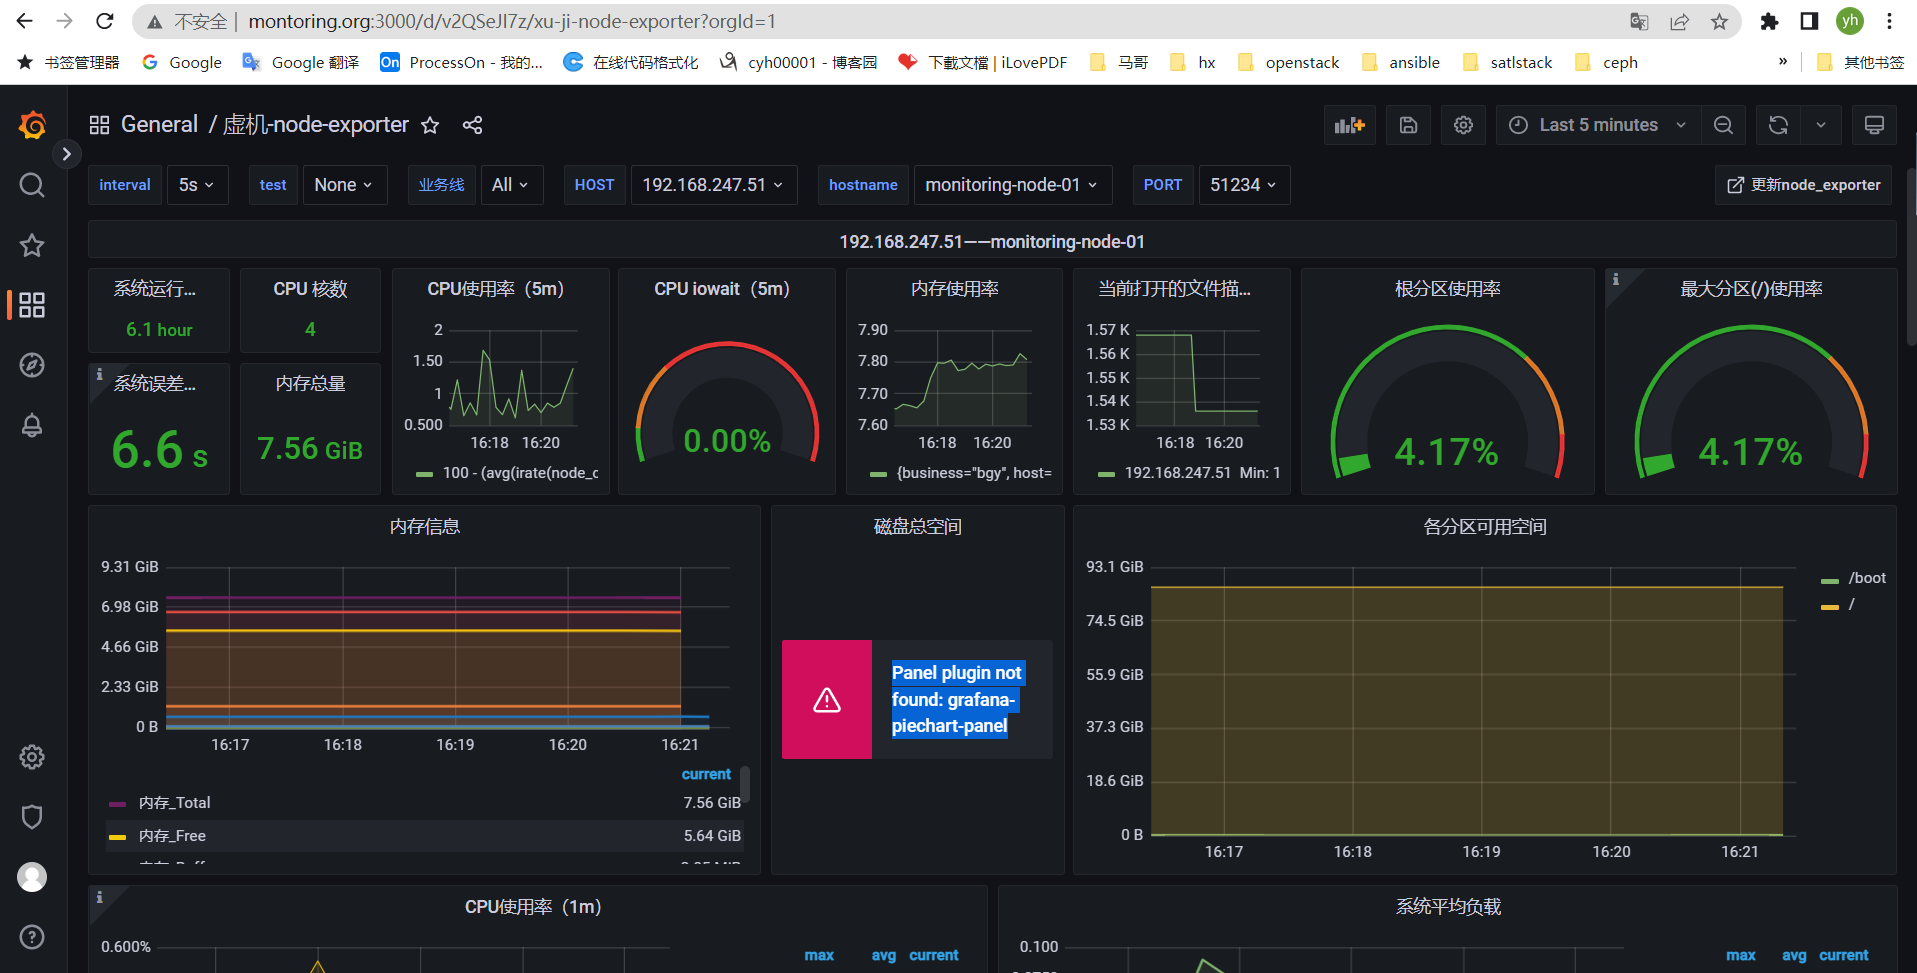
Panel plugin not found: grafana-piechart-panel解决办法
[root@monitoring-node-01 ~]# grafana-cli plugins install grafana-piechart-panel
✔ Downloaded grafana-piechart-panel v1.6.2 zip successfully

Please restart Grafana after installing plugins. Refer to Grafana documentation for instructions if necessary.

[root@monitoring-node-01 ~]# systemctl restart grafana-server
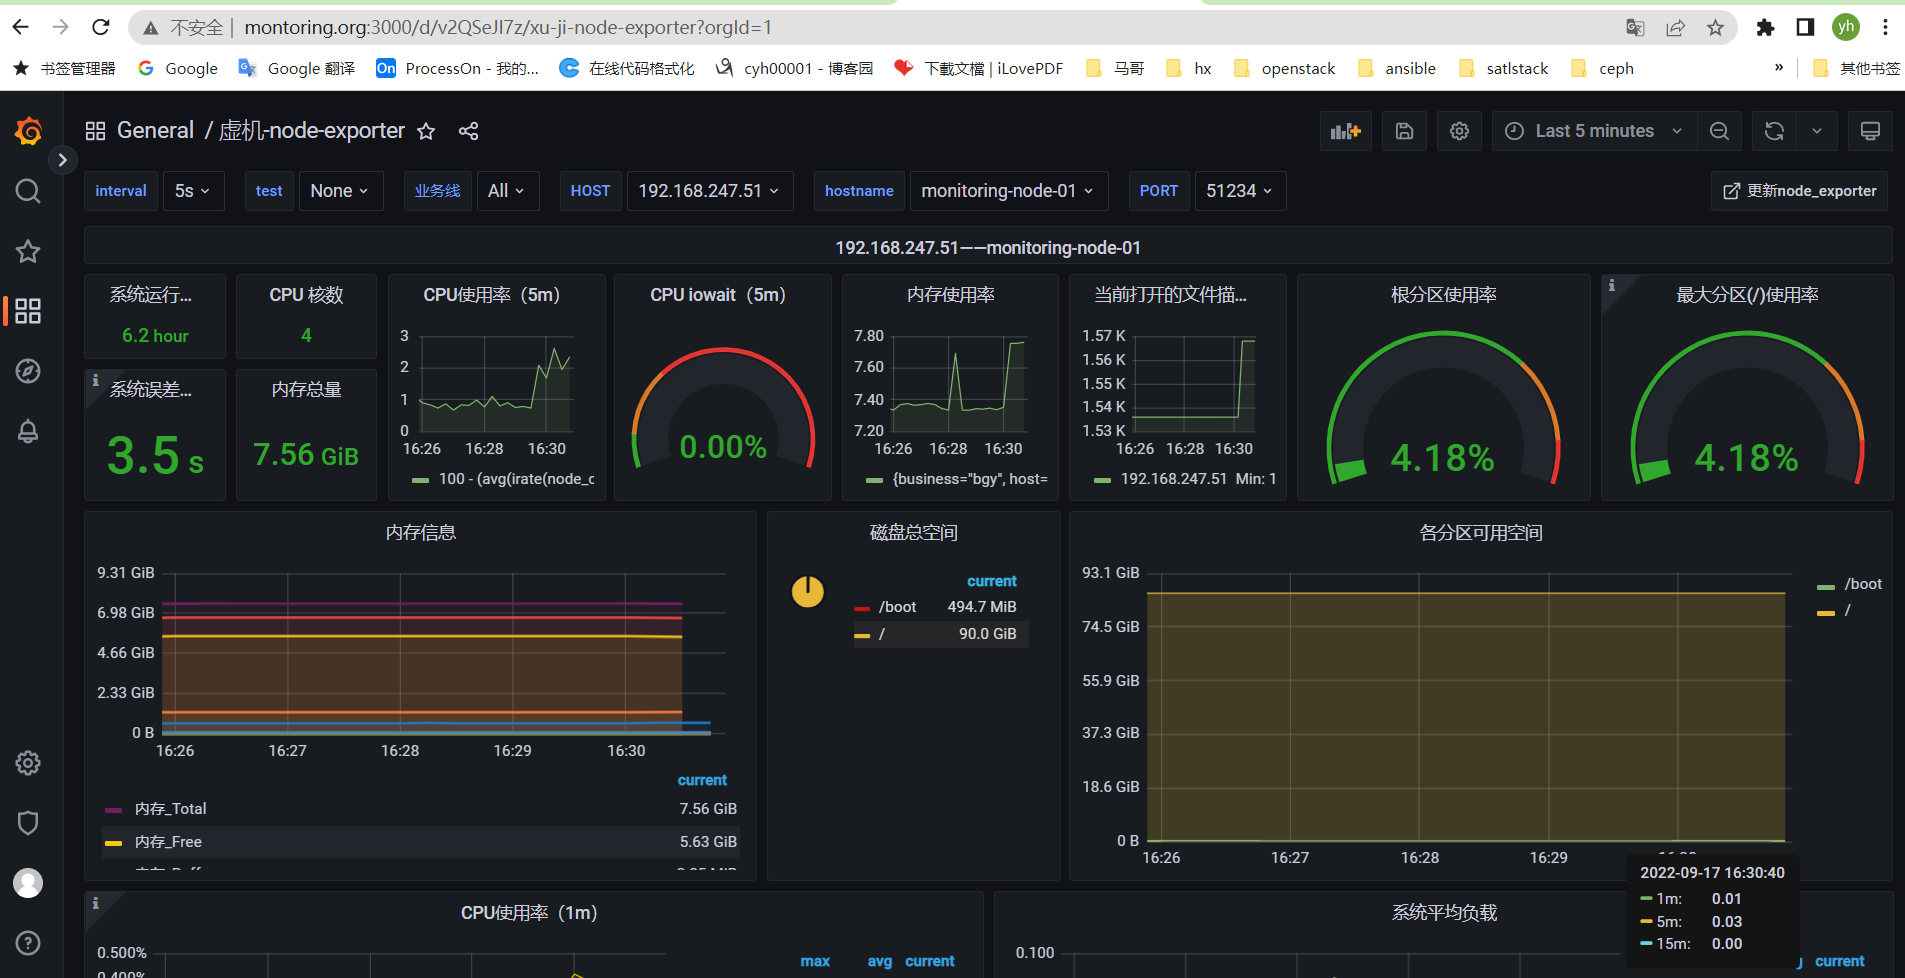
虚机-process-exporter
{ "annotations": { "list": [ { "builtIn": 1, "datasource": { "type": "datasource", "uid": "grafana" }, "enable": true, "hide": true, "iconColor": "rgba(0, 211, 255, 1)", "name": "Annotations & Alerts", "target": { "limit": 100, "matchAny": false, "tags": [], "type": "dashboard" }, "type": "dashboard" } ] }, "description": "Show Linux Process information as captured by \n https://github.com/ncabatoff/process-exporter designed for PMM", "editable": true, "fiscalYearStartMonth": 0, "gnetId": 8378, "graphTooltip": 1, "id": 7, "links": [ { "icon": "dashboard", "includeVars": false, "keepTime": true, "tags": [ "QAN" ], "targetBlank": false, "title": "Query Analytics", "type": "link", "url": "/graph/dashboard/db/_pmm-query-analytics" }, { "asDropdown": true, "includeVars": false, "keepTime": true, "tags": [ "OS" ], "targetBlank": false, "title": "OS", "type": "dashboards" }, { "asDropdown": true, "includeVars": false, "keepTime": true, "tags": [ "MySQL" ], "targetBlank": false, "title": "MySQL", "type": "dashboards" }, { "asDropdown": true, "includeVars": false, "keepTime": true, "tags": [ "MongoDB" ], "targetBlank": false, "title": "MongoDB", "type": "dashboards" }, { "asDropdown": true, "includeVars": false, "keepTime": true, "tags": [ "HA" ], "targetBlank": false, "title": "HA", "type": "dashboards" }, { "asDropdown": true, "includeVars": false, "keepTime": true, "tags": [ "Cloud" ], "targetBlank": false, "title": "Cloud", "type": "dashboards" }, { "asDropdown": true, "includeVars": true, "keepTime": true, "tags": [ "Insight" ], "targetBlank": false, "title": "Insight", "type": "dashboards" }, { "asDropdown": true, "includeVars": false, "keepTime": true, "tags": [ "PMM" ], "targetBlank": false, "title": "PMM", "type": "dashboards" } ], "liveNow": false, "panels": [ { "datasource": { "type": "prometheus", "uid": "LC4fjIn4z" }, "gridPos": { "h": 2, "w": 24, "x": 0, "y": 0 }, "id": 16, "links": [], "options": { "content": "<h3><font color=#5991A7><b><center>Data for </font><font color=#v68a00>$host _ $hostname</font> <font color=#5991A7> with</font> </font><font color=#e68a00>$interval</font> <font color=#5991A7>resolution</center></b></font></h3>", "mode": "html" }, "pluginVersion": "9.1.5", "targets": [ { "datasource": { "type": "prometheus", "uid": "LC4fjIn4z" }, "refId": "A" } ], "type": "text" }, { "collapsed": false, "datasource": { "type": "prometheus", "uid": "LC4fjIn4z" }, "gridPos": { "h": 1, "w": 24, "x": 0, "y": 2 }, "id": 31, "panels": [], "targets": [ { "datasource": { "type": "prometheus", "uid": "LC4fjIn4z" }, "refId": "A" } ], "title": "Process CPU Usage", "type": "row" }, { "aliasColors": {}, "bars": false, "dashLength": 10, "dashes": false, "datasource": { "type": "prometheus", "uid": "LC4fjIn4z" }, "decimals": 2, "editable": true, "error": false, "fill": 2, "fillGradient": 0, "grid": {}, "gridPos": { "h": 7, "w": 12, "x": 0, "y": 3 }, "hiddenSeries": false, "id": 2, "legend": { "alignAsTable": true, "avg": true, "current": true, "max": true, "min": true, "rightSide": false, "show": true, "sort": "max", "sortDesc": true, "total": false, "values": true }, "lines": true, "linewidth": 2, "links": [], "nullPointMode": "null as zero", "options": { "alertThreshold": true }, "percentage": false, "pluginVersion": "9.1.5", "pointradius": 1, "points": false, "renderer": "flot", "seriesOverrides": [], "spaceLength": 10, "stack": false, "steppedLine": false, "targets": [ { "datasource": { "type": "prometheus", "uid": "LC4fjIn4z" }, "expr": "topk(5,(rate(namedprocess_namegroup_cpu_seconds_total{groupname=~\"$processes\",instance=~\"$host\"}[$interval]) \n+\nrate(namedprocess_namegroup_cpu_system_seconds_total{groupname=~\"$processes\",instance=~\"$host\"}[$interval]))\nor \n(irate(namedprocess_namegroup_cpu_seconds_total{groupname=~\"$processes\",instance=~\"$host\"}[5m])\n+\nirate(namedprocess_namegroup_cpu_system_seconds_total{groupname=~\"$processes\",instance=~\"$host\"}[5m])))", "format": "time_series", "hide": true, "interval": "$interval", "intervalFactor": 1, "legendFormat": "{{groupname}}", "metric": "process_namegroup_cpu_seconds_total", "refId": "A", "step": 10 }, { "datasource": { "type": "prometheus", "uid": "LC4fjIn4z" }, "expr": "rate(namedprocess_namegroup_cpu_seconds_total{groupname=~\"$processes\",host=~\"$host\",mode=\"user\"}[5m])", "format": "time_series", "hide": false, "intervalFactor": 1, "legendFormat": "{{groupname}}_{{mode}}", "refId": "B" } ], "thresholds": [], "timeRegions": [], "title": "Top processes by Total CPU cores used", "tooltip": { "msResolution": false, "shared": true, "sort": 0, "value_type": "cumulative" }, "type": "graph", "xaxis": { "mode": "time", "show": true, "values": [] }, "yaxes": [ { "format": "percentunit", "logBase": 1, "min": 0, "show": true }, { "decimals": 2, "format": "short", "logBase": 1, "show": false } ], "yaxis": { "align": false } }, { "aliasColors": {}, "bars": false, "dashLength": 10, "dashes": false, "datasource": { "type": "prometheus", "uid": "LC4fjIn4z" }, "decimals": 2, "editable": true, "error": false, "fill": 1, "fillGradient": 0, "grid": {}, "gridPos": { "h": 7, "w": 12, "x": 12, "y": 3 }, "hiddenSeries": false, "id": 20, "legend": { "alignAsTable": true, "avg": true, "current": true, "hideEmpty": true, "hideZero": false, "max": true, "min": true, "rightSide": false, "show": true, "sort": "max", "sortDesc": true, "total": false, "values": true }, "lines": true, "linewidth": 2, "links": [], "nullPointMode": "null as zero", "options": { "alertThreshold": true }, "percentage": false, "pluginVersion": "9.1.5", "pointradius": 1, "points": false, "renderer": "flot", "seriesOverrides": [], "spaceLength": 10, "stack": false, "steppedLine": false, "targets": [ { "datasource": { "type": "prometheus", "uid": "LC4fjIn4z" }, "expr": "topk(5,\nrate(namedprocess_namegroup_cpu_system_seconds_total{groupname=~\"$processes\",instance=~\"$host\"}[$interval])\nor \n(\nirate(namedprocess_namegroup_cpu_system_seconds_total{groupname=~\"$processes\",instance=~\"$host\"}[5m])))", "format": "time_series", "hide": true, "interval": "$interval", "intervalFactor": 1, "legendFormat": "{{groupname}}", "metric": "process_namegroup_cpu_seconds_total", "refId": "A", "step": 10 }, { "datasource": { "type": "prometheus", "uid": "LC4fjIn4z" }, "expr": "rate(namedprocess_namegroup_cpu_seconds_total{groupname=~\"$processes\",host=~\"$host\",mode=\"system\"}[3m])", "format": "time_series", "hide": false, "instant": false, "interval": "", "intervalFactor": 1, "legendFormat": "{{groupname}}_{{mode}}", "refId": "B" } ], "thresholds": [], "timeRegions": [], "title": "Top processes by System CPU cores used", "tooltip": { "msResolution": false, "shared": true, "sort": 0, "value_type": "cumulative" }, "type": "graph", "xaxis": { "mode": "time", "show": true, "values": [] }, "yaxes": [ { "format": "percentunit", "logBase": 1, "min": 0, "show": true }, { "decimals": 2, "format": "short", "logBase": 1, "show": false } ], "yaxis": { "align": false } }, { "collapsed": false, "datasource": { "type": "prometheus", "uid": "LC4fjIn4z" }, "gridPos": { "h": 1, "w": 24, "x": 0, "y": 10 }, "id": 39, "panels": [], "targets": [ { "datasource": { "type": "prometheus", "uid": "LC4fjIn4z" }, "refId": "A" } ], "title": "Process Memory Usage", "type": "row" }, { "aliasColors": {}, "bars": false, "dashLength": 10, "dashes": false, "datasource": { "type": "prometheus", "uid": "LC4fjIn4z" }, "decimals": 2, "description": "Memory Used by Processes, counted as Resident Memory + Space used in Swap Space", "editable": true, "error": false, "fill": 2, "fillGradient": 0, "grid": {}, "gridPos": { "h": 7, "w": 12, "x": 0, "y": 11 }, "hiddenSeries": false, "id": 22, "legend": { "alignAsTable": true, "avg": true, "current": true, "hideEmpty": true, "hideZero": true, "max": true, "min": true, "rightSide": false, "show": true, "sort": "avg", "sortDesc": true, "total": false, "values": true }, "lines": true, "linewidth": 2, "links": [], "nullPointMode": "null as zero", "options": { "alertThreshold": true }, "percentage": false, "pluginVersion": "9.1.5", "pointradius": 1, "points": false, "renderer": "flot", "seriesOverrides": [], "spaceLength": 10, "stack": false, "steppedLine": false, "targets": [ { "datasource": { "type": "prometheus", "uid": "LC4fjIn4z" }, "expr": "topk(5,(\r\n(avg_over_time(namedprocess_namegroup_memory_bytes{groupname=~\"$processes\", memtype=\"swapped\",host=~\"$host\"}[$interval])+ ignoring (memtype) avg_over_time(namedprocess_namegroup_memory_bytes{groupname=~\"$processes\", memtype=\"resident\",host=~\"$host\"}[$interval]))\r\nor\r\n(avg_over_time(namedprocess_namegroup_memory_bytes{groupname=~\"$processes\", memtype=\"swapped\",host=~\"$host\"}[5m])+ ignoring (memtype) avg_over_time(namedprocess_namegroup_memory_bytes{groupname=~\"$processes\", memtype=\"resident\",host=~\"$host\"}[5m]))\r\n))", "format": "time_series", "interval": "$interval", "intervalFactor": 1, "legendFormat": "{{groupname}}", "metric": "namedprocess_namegroup_memory_bytes", "refId": "A", "step": 10 } ], "thresholds": [], "timeRegions": [], "title": "Top processes by Used memory", "tooltip": { "msResolution": false, "shared": true, "sort": 0, "value_type": "individual" }, "type": "graph", "xaxis": { "mode": "time", "show": true, "values": [] }, "yaxes": [ { "format": "bytes", "logBase": 1, "min": 0, "show": true }, { "format": "short", "logBase": 1, "show": true } ], "yaxis": { "align": false } }, { "aliasColors": {}, "bars": false, "dashLength": 10, "dashes": false, "datasource": { "type": "prometheus", "uid": "LC4fjIn4z" }, "decimals": 2, "editable": true, "error": false, "fill": 2, "fillGradient": 0, "grid": {}, "gridPos": { "h": 7, "w": 12, "x": 12, "y": 11 }, "hiddenSeries": false, "id": 5, "legend": { "alignAsTable": true, "avg": true, "current": true, "max": true, "min": true, "rightSide": false, "show": true, "sort": "avg", "sortDesc": true, "total": false, "values": true }, "lines": true, "linewidth": 2, "links": [], "nullPointMode": "null as zero", "options": { "alertThreshold": true }, "percentage": false, "pluginVersion": "9.1.5", "pointradius": 1, "points": false, "renderer": "flot", "seriesOverrides": [], "spaceLength": 10, "stack": false, "steppedLine": false, "targets": [ { "datasource": { "type": "prometheus", "uid": "LC4fjIn4z" }, "expr": "topk(5,\n(avg_over_time(namedprocess_namegroup_memory_bytes{groupname=~\"$processes\", memtype=\"resident\",host=~\"$host\"}[$interval]) \nor\navg_over_time(namedprocess_namegroup_memory_bytes{groupname=~\"$processes\", memtype=\"resident\",host=~\"$host\"}[5m])\n))", "format": "time_series", "interval": "$interval", "intervalFactor": 1, "legendFormat": "{{groupname}}", "metric": "namedprocess_namegroup_memory_bytes", "refId": "A", "step": 10 } ], "thresholds": [], "timeRegions": [], "title": "Top processes by Resident Memory", "tooltip": { "msResolution": false, "shared": true, "sort": 0, "value_type": "individual" }, "type": "graph", "xaxis": { "mode": "time", "show": true, "values": [] }, "yaxes": [ { "format": "bytes", "logBase": 1, "min": 0, "show": true }, { "format": "short", "logBase": 1, "show": true } ], "yaxis": { "align": false } }, { "aliasColors": {}, "bars": false, "dashLength": 10, "dashes": false, "datasource": { "type": "prometheus", "uid": "LC4fjIn4z" }, "decimals": 2, "editable": true, "error": false, "fill": 2, "fillGradient": 0, "grid": {}, "gridPos": { "h": 7, "w": 12, "x": 0, "y": 18 }, "hiddenSeries": false, "id": 6, "legend": { "alignAsTable": true, "avg": true, "current": true, "hideEmpty": true, "hideZero": true, "max": true, "min": true, "rightSide": false, "show": true, "sort": "avg", "sortDesc": true, "total": false, "values": true }, "lines": true, "linewidth": 2, "links": [], "nullPointMode": "null as zero", "options": { "alertThreshold": true }, "percentage": false, "pluginVersion": "8.1.2", "pointradius": 1, "points": false, "renderer": "flot", "seriesOverrides": [], "spaceLength": 10, "stack": false, "steppedLine": false, "targets": [ { "datasource": { "type": "prometheus", "uid": "LC4fjIn4z" }, "expr": "topk(5,(\navg_over_time(namedprocess_namegroup_memory_bytes{groupname=~\"$processes\", memtype=\"virtual\",host=~\"$host\"}[$interval])\nor\navg_over_time(namedprocess_namegroup_memory_bytes{groupname=~\"$processes\", memtype=\"virtual\",host=~\"$host\"}[5m])))\n", "format": "time_series", "hide": false, "interval": "$interval", "intervalFactor": 1, "legendFormat": "{{groupname}}", "metric": "namedprocess_namegroup_memory_bytes", "refId": "A", "step": 10 } ], "thresholds": [], "timeRegions": [], "title": "Top processes by Virtual memory", "tooltip": { "msResolution": false, "shared": true, "sort": 0, "value_type": "individual" }, "type": "graph", "xaxis": { "mode": "time", "show": true, "values": [] }, "yaxes": [ { "format": "bytes", "logBase": 1, "min": 0, "show": true }, { "format": "short", "logBase": 1, "show": true } ], "yaxis": { "align": false } }, { "aliasColors": {}, "bars": false, "dashLength": 10, "dashes": false, "datasource": { "type": "prometheus", "uid": "LC4fjIn4z" }, "decimals": 2, "editable": true, "error": false, "fill": 2, "fillGradient": 0, "grid": {}, "gridPos": { "h": 7, "w": 12, "x": 12, "y": 18 }, "hiddenSeries": false, "id": 21, "legend": { "alignAsTable": true, "avg": true, "current": true, "hideEmpty": false, "hideZero": false, "max": true, "min": true, "rightSide": false, "show": true, "sort": "avg", "sortDesc": true, "total": false, "values": true }, "lines": true, "linewidth": 2, "links": [], "nullPointMode": "null as zero", "options": { "alertThreshold": true }, "percentage": false, "pluginVersion": "8.1.2", "pointradius": 1, "points": false, "renderer": "flot", "seriesOverrides": [], "spaceLength": 10, "stack": false, "steppedLine": false, "targets": [ { "datasource": { "type": "prometheus", "uid": "LC4fjIn4z" }, "expr": "topk(5,(\navg_over_time(namedprocess_namegroup_memory_bytes{groupname=~\"$processes\", memtype=\"swapped\",host=~\"$host\"}[$interval])\nor\navg_over_time(namedprocess_namegroup_memory_bytes{groupname=~\"$processes\", memtype=\"swapped\",host=~\"$host\"}[5m])))\n", "format": "time_series", "hide": false, "interval": "$interval", "intervalFactor": 1, "legendFormat": "{{groupname}}", "metric": "namedprocess_namegroup_memory_bytes", "refId": "A", "step": 10 } ], "thresholds": [], "timeRegions": [], "title": "Top processes by Swapped Memory", "tooltip": { "msResolution": false, "shared": true, "sort": 0, "value_type": "individual" }, "type": "graph", "xaxis": { "mode": "time", "show": true, "values": [] }, "yaxes": [ { "format": "bytes", "logBase": 1, "min": 0, "show": true }, { "format": "short", "logBase": 1, "show": true } ], "yaxis": { "align": false } }, { "collapsed": false, "datasource": { "type": "prometheus", "uid": "LC4fjIn4z" }, "gridPos": { "h": 1, "w": 24, "x": 0, "y": 25 }, "id": 37, "panels": [], "targets": [ { "datasource": { "type": "prometheus", "uid": "LC4fjIn4z" }, "refId": "A" } ], "title": "Process Disk IO Usage", "type": "row" }, { "aliasColors": {}, "bars": false, "dashLength": 10, "dashes": false, "datasource": { "type": "prometheus", "uid": "LC4fjIn4z" }, "decimals": 2, "editable": true, "error": false, "fill": 2, "fillGradient": 0, "grid": {}, "gridPos": { "h": 7, "w": 12, "x": 0, "y": 26 }, "hiddenSeries": false, "id": 4, "legend": { "alignAsTable": true, "avg": true, "current": true, "max": true, "min": true, "rightSide": false, "show": true, "sort": "avg", "sortDesc": true, "total": false, "values": true }, "lines": true, "linewidth": 2, "links": [], "nullPointMode": "null", "options": { "alertThreshold": true }, "percentage": false, "pluginVersion": "8.1.2", "pointradius": 1, "points": false, "renderer": "flot", "seriesOverrides": [], "spaceLength": 10, "stack": false, "steppedLine": false, "targets": [ { "datasource": { "type": "prometheus", "uid": "LC4fjIn4z" }, "expr": "topk(5,(rate(namedprocess_namegroup_write_bytes_total{groupname=~\"$processes\",host=~\"$host\"}[$interval]) or irate(namedprocess_namegroup_write_bytes_total{groupname=~\"$processes\",host=~\"$host\"}[3m])))", "format": "time_series", "interval": "$interval", "intervalFactor": 1, "legendFormat": "{{groupname}}", "metric": "namedprocess_namegroup_read_bytes_total", "refId": "A", "step": 10 } ], "thresholds": [], "timeRegions": [], "title": "Top processes by Bytes Written", "tooltip": { "msResolution": false, "shared": true, "sort": 0, "value_type": "individual" }, "type": "graph", "xaxis": { "mode": "time", "show": true, "values": [] }, "yaxes": [ { "format": "Bps", "logBase": 1, "min": 0, "show": true }, { "format": "short", "logBase": 1, "show": true } ], "yaxis": { "align": false } }, { "aliasColors": {}, "bars": false, "dashLength": 10, "dashes": false, "datasource": { "type": "prometheus", "uid": "LC4fjIn4z" }, "decimals": 2, "editable": true, "error": false, "fill": 2, "fillGradient": 0, "grid": {}, "gridPos": { "h": 7, "w": 12, "x": 12, "y": 26 }, "hiddenSeries": false, "id": 3, "legend": { "alignAsTable": true, "avg": true, "current": true, "hideEmpty": false, "hideZero": false, "max": true, "min": true, "rightSide": false, "show": true, "sort": "avg", "sortDesc": true, "total": false, "values": true }, "lines": true, "linewidth": 2, "links": [], "nullPointMode": "null", "options": { "alertThreshold": true }, "percentage": false, "pluginVersion": "8.1.2", "pointradius": 1, "points": false, "renderer": "flot", "seriesOverrides": [], "spaceLength": 10, "stack": false, "steppedLine": false, "targets": [ { "datasource": { "type": "prometheus", "uid": "LC4fjIn4z" }, "expr": "topk(5,(rate(namedprocess_namegroup_read_bytes_total{groupname=~\"$processes\",host=~\"$host\"}[$interval]) or irate(namedprocess_namegroup_read_bytes_total{groupname=~\"$processes\",host=~\"$host\"}[3m])))", "format": "time_series", "interval": "$interval", "intervalFactor": 1, "legendFormat": "{{groupname}}", "metric": "namedprocess_namegroup_read_bytes_total", "refId": "A", "step": 10 } ], "thresholds": [], "timeRegions": [], "title": "Top processes by Bytes Read", "tooltip": { "msResolution": false, "shared": true, "sort": 0, "value_type": "individual" }, "type": "graph", "xaxis": { "mode": "time", "show": true, "values": [] }, "yaxes": [ { "format": "Bps", "logBase": 1, "min": 0, "show": true }, { "format": "short", "logBase": 1, "show": false } ], "yaxis": { "align": false } }, { "collapsed": false, "datasource": { "type": "prometheus", "uid": "LC4fjIn4z" }, "gridPos": { "h": 1, "w": 24, "x": 0, "y": 33 }, "id": 33, "panels": [], "targets": [ { "datasource": { "type": "prometheus", "uid": "LC4fjIn4z" }, "refId": "A" } ], "title": "Process and Thread Counts", "type": "row" }, { "aliasColors": {}, "bars": false, "dashLength": 10, "dashes": false, "datasource": { "type": "prometheus", "uid": "LC4fjIn4z" }, "decimals": 2, "editable": true, "error": false, "fill": 2, "fillGradient": 0, "grid": {}, "gridPos": { "h": 7, "w": 12, "x": 0, "y": 34 }, "hiddenSeries": false, "id": 1, "legend": { "alignAsTable": true, "avg": true, "current": true, "hideZero": true, "max": true, "min": true, "rightSide": false, "show": true, "sort": "avg", "sortDesc": true, "total": false, "values": true }, "lines": true, "linewidth": 2, "links": [], "nullPointMode": "null as zero", "options": { "alertThreshold": true }, "percentage": false, "pluginVersion": "8.1.2", "pointradius": 1, "points": false, "renderer": "flot", "seriesOverrides": [], "spaceLength": 10, "stack": false, "steppedLine": false, "targets": [ { "datasource": { "type": "prometheus", "uid": "LC4fjIn4z" }, "expr": "topk(5,(max_over_time(namedprocess_namegroup_num_procs{groupname=~\"$processes\",host=~\"$host\"}[$interval]) \nor max_over_time(namedprocess_namegroup_num_procs{groupname=~\"$processes\",host=~\"$host\"}[5m])))", "format": "time_series", "hide": false, "interval": "$interval", "intervalFactor": 1, "legendFormat": "{{groupname}}", "metric": "process_namegroup_num_procs", "refId": "A", "step": 10 } ], "thresholds": [], "timeRegions": [], "title": "Top processes by number of processes instances", "tooltip": { "msResolution": false, "shared": true, "sort": 0, "value_type": "individual" }, "type": "graph", "xaxis": { "mode": "time", "show": true, "values": [] }, "yaxes": [ { "format": "short", "logBase": 1, "min": "0", "show": true }, { "format": "short", "logBase": 1, "show": true } ], "yaxis": { "align": false } }, { "aliasColors": {}, "bars": false, "dashLength": 10, "dashes": false, "datasource": { "type": "prometheus", "uid": "LC4fjIn4z" }, "decimals": 2, "fill": 2, "fillGradient": 0, "gridPos": { "h": 7, "w": 12, "x": 12, "y": 34 }, "hiddenSeries": false, "id": 10, "legend": { "alignAsTable": true, "avg": true, "current": true, "hideZero": true, "max": true, "min": true, "rightSide": false, "show": true, "sort": "avg", "sortDesc": true, "total": false, "values": true }, "lines": true, "linewidth": 2, "links": [], "nullPointMode": "null as zero", "options": { "alertThreshold": true }, "percentage": false, "pluginVersion": "8.1.2", "pointradius": 1, "points": false, "renderer": "flot", "seriesOverrides": [], "spaceLength": 10, "stack": false, "steppedLine": false, "targets": [ { "datasource": { "type": "prometheus", "uid": "LC4fjIn4z" }, "expr": "topk(5,(max_over_time(namedprocess_namegroup_num_threads{groupname=~\"$processes\",host=~\"$host\"}[$interval]) or\nmax_over_time(namedprocess_namegroup_num_threads{groupname=~\"$processes\",host=~\"$host\"}[5m])))", "format": "time_series", "interval": "$interval", "intervalFactor": 1, "legendFormat": "{{groupname}}", "refId": "A" } ], "thresholds": [], "timeRegions": [], "title": "Top processes by number of threads", "tooltip": { "shared": true, "sort": 0, "value_type": "individual" }, "type": "graph", "xaxis": { "mode": "time", "show": true, "values": [] }, "yaxes": [ { "format": "short", "logBase": 1, "show": true }, { "format": "short", "logBase": 1, "show": false } ], "yaxis": { "align": false } }, { "collapsed": false, "datasource": { "type": "prometheus", "uid": "LC4fjIn4z" }, "gridPos": { "h": 1, "w": 24, "x": 0, "y": 41 }, "id": 43, "panels": [], "targets": [ { "datasource": { "type": "prometheus", "uid": "LC4fjIn4z" }, "refId": "A" } ], "title": "Process Context Switches", "type": "row" }, { "aliasColors": {}, "bars": false, "dashLength": 10, "dashes": false, "datasource": { "type": "prometheus", "uid": "LC4fjIn4z" }, "decimals": 2, "fill": 2, "fillGradient": 0, "gridPos": { "h": 7, "w": 12, "x": 0, "y": 42 }, "hiddenSeries": false, "id": 24, "legend": { "alignAsTable": true, "avg": true, "current": true, "max": true, "min": true, "rightSide": false, "show": true, "sort": "avg", "sortDesc": true, "total": false, "values": true }, "lines": true, "linewidth": 2, "links": [], "nullPointMode": "null as zero", "options": { "alertThreshold": true }, "percentage": false, "pluginVersion": "8.1.2", "pointradius": 1, "points": false, "renderer": "flot", "seriesOverrides": [], "spaceLength": 10, "stack": false, "steppedLine": false, "targets": [ { "datasource": { "type": "prometheus", "uid": "LC4fjIn4z" }, "expr": "topk(5,(\nrate(namedprocess_namegroup_context_switches_total{groupname=~\"$processes\",host=~\"$host\",ctxswitchtype=\"voluntary\"}[$interval]) or\nirate(namedprocess_namegroup_context_switches_total{groupname=~\"$processes\",host=~\"$host\",ctxswitchtype=\"voluntary\"}[5m])))", "format": "time_series", "interval": "$interval", "intervalFactor": 1, "legendFormat": "{{groupname}}", "refId": "A" } ], "thresholds": [], "timeRegions": [], "title": "Top Processes by Voluntary Context Switches", "tooltip": { "shared": true, "sort": 0, "value_type": "individual" }, "type": "graph", "xaxis": { "mode": "time", "show": true, "values": [] }, "yaxes": [ { "format": "ops", "logBase": 1, "min": "0", "show": true }, { "format": "short", "logBase": 1, "show": false } ], "yaxis": { "align": false } }, { "aliasColors": {}, "bars": false, "dashLength": 10, "dashes": false, "datasource": { "type": "prometheus", "uid": "LC4fjIn4z" }, "decimals": 2, "fill": 2, "fillGradient": 0, "gridPos": { "h": 7, "w": 12, "x": 12, "y": 42 }, "hiddenSeries": false, "id": 25, "legend": { "alignAsTable": true, "avg": true, "current": true, "max": true, "min": true, "rightSide": false, "show": true, "sort": "avg", "sortDesc": true, "total": false, "values": true }, "lines": true, "linewidth": 2, "links": [], "nullPointMode": "null as zero", "options": { "alertThreshold": true }, "percentage": false, "pluginVersion": "8.1.2", "pointradius": 1, "points": false, "renderer": "flot", "seriesOverrides": [], "spaceLength": 10, "stack": false, "steppedLine": false, "targets": [ { "datasource": { "type": "prometheus", "uid": "LC4fjIn4z" }, "expr": "topk(5,(\nrate(namedprocess_namegroup_context_switches_total{groupname=~\"$processes\",host=~\"$host\",ctxswitchtype=\"nonvoluntary\"}[$interval]) or\nirate(namedprocess_namegroup_context_switches_total{groupname=~\"$processes\",host=~\"$host\",ctxswitchtype=\"nonvoluntary\"}[5m])))", "format": "time_series", "interval": "$interval", "intervalFactor": 1, "legendFormat": "{{groupname}}", "refId": "A" } ], "thresholds": [], "timeRegions": [], "title": "Top Processes by Non-Voluntary Context Switches", "tooltip": { "shared": true, "sort": 0, "value_type": "individual" }, "type": "graph", "xaxis": { "mode": "time", "show": true, "values": [] }, "yaxes": [ { "format": "ops", "logBase": 1, "min": "0", "show": true }, { "format": "short", "logBase": 1, "show": false } ], "yaxis": { "align": false } }, { "collapsed": false, "datasource": { "type": "prometheus", "uid": "LC4fjIn4z" }, "gridPos": { "h": 1, "w": 24, "x": 0, "y": 49 }, "id": 35, "panels": [], "targets": [ { "datasource": { "type": "prometheus", "uid": "LC4fjIn4z" }, "refId": "A" } ], "title": "Process File Descriptors", "type": "row" }, { "aliasColors": {}, "bars": false, "dashLength": 10, "dashes": false, "datasource": { "type": "prometheus", "uid": "LC4fjIn4z" }, "fill": 2, "fillGradient": 0, "gridPos": { "h": 7, "w": 12, "x": 0, "y": 50 }, "hiddenSeries": false, "id": 13, "legend": { "alignAsTable": true, "avg": true, "current": true, "max": true, "min": true, "rightSide": false, "show": true, "sort": "avg", "sortDesc": true, "total": false, "values": true }, "lines": true, "linewidth": 2, "links": [], "nullPointMode": "null as zero", "options": { "alertThreshold": true }, "percentage": false, "pluginVersion": "8.1.2", "pointradius": 1, "points": false, "renderer": "flot", "seriesOverrides": [], "spaceLength": 10, "stack": false, "steppedLine": true, "targets": [ { "datasource": { "type": "prometheus", "uid": "LC4fjIn4z" }, "expr": "topk(5,(max_over_time(namedprocess_namegroup_open_filedesc{groupname=~\"$processes\",host=~\"$host\"}[$interval]) or\nmax_over_time(namedprocess_namegroup_open_filedesc{groupname=~\"$processes\",host=~\"$host\"}[5m])))", "format": "time_series", "hide": false, "interval": "$interval", "intervalFactor": 1, "legendFormat": "{{groupname}}", "refId": "A" } ], "thresholds": [], "timeRegions": [], "title": "Top processes by Open File Descriptors", "tooltip": { "shared": true, "sort": 0, "value_type": "individual" }, "type": "graph", "xaxis": { "mode": "time", "show": true, "values": [] }, "yaxes": [ { "format": "short", "logBase": 1, "min": "0", "show": true }, { "format": "short", "logBase": 1, "show": false } ], "yaxis": { "align": false } }, { "aliasColors": {}, "bars": false, "dashLength": 10, "dashes": false, "datasource": { "type": "prometheus", "uid": "LC4fjIn4z" }, "fill": 2, "fillGradient": 0, "gridPos": { "h": 7, "w": 12, "x": 12, "y": 50 }, "hiddenSeries": false, "id": 7, "legend": { "alignAsTable": true, "avg": true, "current": true, "max": true, "min": true, "rightSide": false, "show": true, "sort": "avg", "sortDesc": true, "total": false, "values": true }, "lines": true, "linewidth": 2, "links": [], "nullPointMode": "null as zero", "options": { "alertThreshold": true }, "percentage": false, "pluginVersion": "8.1.2", "pointradius": 1, "points": false, "renderer": "flot", "seriesOverrides": [], "spaceLength": 10, "stack": false, "steppedLine": true, "targets": [ { "datasource": { "type": "prometheus", "uid": "LC4fjIn4z" }, "expr": "topk(5,(\nmax_over_time(namedprocess_namegroup_worst_fd_ratio{groupname=~\"$processes\",host=~\"$host\"}[$interval]) or\nmax_over_time(namedprocess_namegroup_worst_fd_ratio{groupname=~\"$processes\",host=~\"$host\"}[5m])\n))*100", "format": "time_series", "interval": "$interval", "intervalFactor": 1, "legendFormat": "{{groupname}}", "refId": "A" } ], "thresholds": [], "timeRegions": [], "title": "Top processes by File Descriptor Usage Percent", "tooltip": { "shared": true, "sort": 0, "value_type": "individual" }, "type": "graph", "xaxis": { "mode": "time", "show": true, "values": [] }, "yaxes": [ { "format": "percent", "label": "", "logBase": 1, "min": "0", "show": true }, { "format": "short", "logBase": 1, "show": false } ], "yaxis": { "align": false } }, { "collapsed": false, "datasource": { "type": "prometheus", "uid": "LC4fjIn4z" }, "gridPos": { "h": 1, "w": 24, "x": 0, "y": 57 }, "id": 27, "panels": [], "targets": [ { "datasource": { "type": "prometheus", "uid": "LC4fjIn4z" }, "refId": "A" } ], "title": "Process Page Faults", "type": "row" }, { "aliasColors": {}, "bars": false, "dashLength": 10, "dashes": false, "datasource": { "type": "prometheus", "uid": "LC4fjIn4z" }, "decimals": 2, "fill": 2, "fillGradient": 0, "gridPos": { "h": 7, "w": 12, "x": 0, "y": 58 }, "hiddenSeries": false, "id": 8, "legend": { "alignAsTable": true, "avg": true, "current": true, "max": true, "min": true, "rightSide": false, "show": true, "sort": "avg", "sortDesc": true, "total": false, "values": true }, "lines": true, "linewidth": 2, "links": [], "nullPointMode": "null as zero", "options": { "alertThreshold": true }, "percentage": false, "pluginVersion": "8.1.2", "pointradius": 1, "points": false, "renderer": "flot", "seriesOverrides": [], "spaceLength": 10, "stack": false, "steppedLine": false, "targets": [ { "datasource": { "type": "prometheus", "uid": "LC4fjIn4z" }, "expr": "topk(5,(\nrate(namedprocess_namegroup_major_page_faults_total{groupname=~\"$processes\",host=~\"$host\"}[$interval]) or\nirate(namedprocess_namegroup_major_page_faults_total{groupname=~\"$processes\",host=~\"$host\"}[5m])))", "format": "time_series", "interval": "$interval", "intervalFactor": 1, "legendFormat": "{{groupname}}", "refId": "A" } ], "thresholds": [], "timeRegions": [], "title": "Top processes by Major Page Faults", "tooltip": { "shared": true, "sort": 0, "value_type": "individual" }, "type": "graph", "xaxis": { "mode": "time", "show": true, "values": [] }, "yaxes": [ { "format": "ops", "logBase": 1, "min": "0", "show": true }, { "format": "short", "logBase": 1, "show": false } ], "yaxis": { "align": false } }, { "aliasColors": {}, "bars": false, "dashLength": 10, "dashes": false, "datasource": { "type": "prometheus", "uid": "LC4fjIn4z" }, "decimals": 2, "fill": 2, "fillGradient": 0, "gridPos": { "h": 7, "w": 12, "x": 12, "y": 58 }, "hiddenSeries": false, "id": 9, "legend": { "alignAsTable": true, "avg": true, "current": true, "max": true, "min": true, "rightSide": false, "show": true, "sort": "avg", "sortDesc": true, "total": false, "values": true }, "lines": true, "linewidth": 2, "links": [], "nullPointMode": "null as zero", "options": { "alertThreshold": true }, "percentage": false, "pluginVersion": "8.1.2", "pointradius": 1, "points": false, "renderer": "flot", "seriesOverrides": [], "spaceLength": 10, "stack": false, "steppedLine": false, "targets": [ { "datasource": { "type": "prometheus", "uid": "LC4fjIn4z" }, "expr": "topk(5,(\nrate(namedprocess_namegroup_minor_page_faults_total{groupname=~\"$processes\",host=~\"$host\"}[$interval]) or\nirate(namedprocess_namegroup_minor_page_faults_total{groupname=~\"$processes\",host=~\"$host\"}[5m])))", "format": "time_series", "interval": "$interval", "intervalFactor": 1, "legendFormat": "{{groupname}}", "refId": "A" } ], "thresholds": [], "timeRegions": [], "title": "Top processes by Minor Page Faults", "tooltip": { "shared": true, "sort": 0, "value_type": "individual" }, "type": "graph", "xaxis": { "mode": "time", "show": true, "values": [] }, "yaxes": [ { "format": "ops", "logBase": 1, "min": "0", "show": true }, { "format": "short", "logBase": 1, "show": false } ], "yaxis": { "align": false } }, { "collapsed": false, "datasource": { "type": "prometheus", "uid": "LC4fjIn4z" }, "gridPos": { "h": 1, "w": 24, "x": 0, "y": 65 }, "id": 29, "panels": [], "targets": [ { "datasource": { "type": "prometheus", "uid": "LC4fjIn4z" }, "refId": "A" } ], "title": "Process Statuses", "type": "row" }, { "aliasColors": {}, "bars": false, "dashLength": 10, "dashes": false, "datasource": { "type": "prometheus", "uid": "LC4fjIn4z" }, "decimals": 2, "description": "", "fill": 2, "fillGradient": 0, "gridPos": { "h": 7, "w": 12, "x": 0, "y": 66 }, "hiddenSeries": false, "id": 11, "legend": { "alignAsTable": true, "avg": true, "current": true, "hideZero": false, "max": true, "min": true, "rightSide": false, "show": true, "sort": "avg", "sortDesc": true, "total": false, "values": true }, "lines": true, "linewidth": 2, "links": [], "nullPointMode": "null as zero", "options": { "alertThreshold": true }, "percentage": false, "pluginVersion": "8.1.2", "pointradius": 1, "points": false, "renderer": "flot", "seriesOverrides": [], "spaceLength": 10, "stack": false, "steppedLine": true, "targets": [ { "datasource": { "type": "prometheus", "uid": "LC4fjIn4z" }, "expr": "topk(5,(\nmax_over_time(namedprocess_namegroup_states{host=~\"$host\", groupname=~\"$processes\", state=\"Running\"}[$interval]) or\nmax_over_time(namedprocess_namegroup_states{host=~\"$host\", groupname=~\"$processes\", state=\"Running\"}[5m])))", "format": "time_series", "interval": "$interval", "intervalFactor": 1, "legendFormat": "{{groupname}}", "refId": "A" } ], "thresholds": [], "timeRegions": [], "title": "Top running processes", "tooltip": { "shared": true, "sort": 0, "value_type": "individual" }, "type": "graph", "xaxis": { "mode": "time", "show": true, "values": [] }, "yaxes": [ { "format": "short", "logBase": 1, "min": "0", "show": true }, { "format": "short", "logBase": 1, "show": false } ], "yaxis": { "align": false } }, { "aliasColors": {}, "bars": false, "dashLength": 10, "dashes": false, "datasource": { "type": "prometheus", "uid": "LC4fjIn4z" }, "decimals": 2, "description": "", "fill": 1, "fillGradient": 0, "gridPos": { "h": 7, "w": 12, "x": 12, "y": 66 }, "hiddenSeries": false, "id": 14, "legend": { "alignAsTable": true, "avg": true, "current": true, "max": true, "min": true, "rightSide": false, "show": true, "sort": "avg", "sortDesc": true, "total": false, "values": true }, "lines": true, "linewidth": 1, "links": [], "nullPointMode": "null as zero", "options": { "alertThreshold": true }, "percentage": false, "pluginVersion": "8.1.2", "pointradius": 1, "points": false, "renderer": "flot", "seriesOverrides": [], "spaceLength": 10, "stack": false, "steppedLine": false, "targets": [ { "datasource": { "type": "prometheus", "uid": "LC4fjIn4z" }, "expr": "topk(5,(\nmax_over_time(namedprocess_namegroup_states{host=~\"$host\", groupname=~\"$processes\", state=\"Waiting\"}[$interval]) ))", "format": "time_series", "hide": false, "instant": false, "interval": "$interval", "intervalFactor": 1, "legendFormat": "{{groupname}}", "refId": "A" } ], "thresholds": [], "timeRegions": [], "title": "Top of processes waiting on IO", "tooltip": { "shared": true, "sort": 0, "value_type": "individual" }, "type": "graph", "xaxis": { "mode": "time", "show": true, "values": [] }, "yaxes": [ { "format": "short", "logBase": 1, "min": "0", "show": true }, { "format": "short", "logBase": 1, "show": false } ], "yaxis": { "align": false } }, { "collapsed": false, "datasource": { "type": "prometheus", "uid": "LC4fjIn4z" }, "gridPos": { "h": 1, "w": 24, "x": 0, "y": 73 }, "id": 45, "panels": [], "targets": [ { "datasource": { "type": "prometheus", "uid": "LC4fjIn4z" }, "refId": "A" } ], "title": "Process Kernel Waits (WCHAN)", "type": "row" }, { "aliasColors": {}, "bars": false, "dashLength": 10, "dashes": false, "datasource": { "type": "prometheus", "uid": "LC4fjIn4z" }, "decimals": 2, "description": "", "fill": 1, "fillGradient": 0, "gridPos": { "h": 7, "w": 12, "x": 0, "y": 74 }, "hiddenSeries": false, "id": 46, "legend": { "alignAsTable": true, "avg": true, "current": true, "max": true, "min": true, "rightSide": false, "show": true, "sort": "avg", "sortDesc": true, "total": false, "values": true }, "lines": true, "linewidth": 1, "links": [], "nullPointMode": "null as zero", "options": { "alertThreshold": true }, "percentage": false, "pluginVersion": "8.1.2", "pointradius": 1, "points": false, "renderer": "flot", "seriesOverrides": [], "spaceLength": 10, "stack": false, "steppedLine": false, "targets": [ { "datasource": { "type": "prometheus", "uid": "LC4fjIn4z" }, "exemplar": true, "expr": "topk(5,sum(avg_over_time(namedprocess_namegroup_threads_wchan{host=~\"$host\", groupname=~\"$processes\"}[$interval])) by (wchan) )", "format": "time_series", "interval": "$interval", "intervalFactor": 1, "legendFormat": "{{wchan}}", "refId": "A" } ], "thresholds": [], "timeRegions": [], "title": "Kernel waits for $processes", "tooltip": { "shared": true, "sort": 0, "value_type": "individual" }, "type": "graph", "xaxis": { "mode": "time", "show": true, "values": [] }, "yaxes": [ { "format": "short", "logBase": 1, "min": "0", "show": true }, { "format": "short", "logBase": 1, "show": false } ], "yaxis": { "align": false } }, { "aliasColors": {}, "bars": false, "dashLength": 10, "dashes": false, "datasource": { "type": "prometheus", "uid": "LC4fjIn4z" }, "decimals": 2, "description": "", "fill": 1, "fillGradient": 0, "gridPos": { "h": 7, "w": 12, "x": 12, "y": 74 }, "hiddenSeries": false, "id": 47, "legend": { "alignAsTable": true, "avg": true, "current": true, "max": true, "min": true, "rightSide": false, "show": true, "sort": "avg", "sortDesc": true, "total": false, "values": true }, "lines": true, "linewidth": 1, "links": [], "nullPointMode": "null as zero", "options": { "alertThreshold": true }, "percentage": false, "pluginVersion": "8.1.2", "pointradius": 1, "points": false, "renderer": "flot", "seriesOverrides": [], "spaceLength": 10, "stack": false, "steppedLine": false, "targets": [ { "datasource": { "type": "prometheus", "uid": "LC4fjIn4z" }, "expr": "topk(5,sum(avg_over_time(namedprocess_namegroup_threads_wchan{host=~\"$host\", groupname=~\"$processes\"}[$interval])) by (wchan,groupname) )", "format": "time_series", "interval": "$interval", "intervalFactor": 1, "legendFormat": "{{groupname}} : {{wchan}}", "refId": "A" } ], "thresholds": [], "timeRegions": [], "title": "Kernel wait Details for $processes", "tooltip": { "shared": true, "sort": 0, "value_type": "individual" }, "type": "graph", "xaxis": { "mode": "time", "show": true, "values": [] }, "yaxes": [ { "format": "short", "logBase": 1, "min": "0", "show": true }, { "format": "short", "logBase": 1, "show": false } ], "yaxis": { "align": false } }, { "collapsed": false, "datasource": { "type": "prometheus", "uid": "LC4fjIn4z" }, "gridPos": { "h": 1, "w": 24, "x": 0, "y": 81 }, "id": 41, "panels": [], "targets": [ { "datasource": { "type": "prometheus", "uid": "LC4fjIn4z" }, "refId": "A" } ], "title": "Process Uptime", "type": "row" }, { "columns": [], "datasource": { "type": "prometheus", "uid": "LC4fjIn4z" }, "fontSize": "100%", "gridPos": { "h": 10, "w": 24, "x": 0, "y": 82 }, "id": 19, "links": [], "scroll": true, "showHeader": true, "sort": { "col": 3, "desc": false }, "styles": [ { "alias": "Time", "align": "auto", "dateFormat": "YYYY-MM-DD HH:mm:ss", "link": false, "pattern": "Time", "type": "date" }, { "alias": "Uptime", "align": "auto", "colors": [ "rgba(245, 54, 54, 0.9)", "rgba(237, 129, 40, 0.89)", "rgba(50, 172, 45, 0.97)" ], "dateFormat": "YYYY-MM-DD HH:mm:ss", "decimals": 2, "pattern": "Value", "thresholds": [], "type": "number", "unit": "s" }, { "alias": "", "align": "auto", "colors": [ "rgba(245, 54, 54, 0.9)", "rgba(237, 129, 40, 0.89)", "rgba(50, 172, 45, 0.97)" ], "dateFormat": "YYYY-MM-DD HH:mm:ss", "decimals": 2, "pattern": "instance", "sanitize": false, "thresholds": [], "type": "hidden", "unit": "short" }, { "alias": "", "align": "auto", "colors": [ "rgba(245, 54, 54, 0.9)", "rgba(237, 129, 40, 0.89)", "rgba(50, 172, 45, 0.97)" ], "dateFormat": "YYYY-MM-DD HH:mm:ss", "decimals": 2, "pattern": "host", "thresholds": [], "type": "number", "unit": "short" }, { "alias": "Processes", "align": "auto", "colors": [ "rgba(245, 54, 54, 0.9)", "rgba(237, 129, 40, 0.89)", "rgba(50, 172, 45, 0.97)" ], "dateFormat": "YYYY-MM-DD HH:mm:ss", "decimals": 2, "link": false, "mappingType": 2, "pattern": "groupname", "sanitize": false, "thresholds": [], "type": "string", "unit": "short" }, { "alias": "", "align": "auto", "colors": [ "rgba(245, 54, 54, 0.9)", "rgba(237, 129, 40, 0.89)", "rgba(50, 172, 45, 0.97)" ], "decimals": 2, "pattern": "/.*/", "thresholds": [], "type": "hidden", "unit": "short" } ], "targets": [ { "datasource": { "type": "prometheus", "uid": "LC4fjIn4z" }, "expr": "time()-(namedprocess_namegroup_oldest_start_time_seconds{host=~\"$host\"}>0)", "format": "table", "instant": true, "interval": "", "intervalFactor": 1, "legendFormat": "", "refId": "A" } ], "title": "Processes by uptime", "transform": "table", "type": "table-old" } ], "refresh": false, "schemaVersion": 37, "style": "dark", "tags": [], "templating": { "list": [ { "auto": true, "auto_count": 200, "auto_min": "1s", "current": { "selected": false, "text": "auto", "value": "$__auto_interval_interval" }, "hide": 0, "includeAll": false, "label": "Interval", "multi": false, "name": "interval", "options": [ { "selected": true, "text": "auto", "value": "$__auto_interval_interval" }, { "selected": false, "text": "1s", "value": "1s" }, { "selected": false, "text": "5s", "value": "5s" }, { "selected": false, "text": "30s", "value": "30s" }, { "selected": false, "text": "1m", "value": "1m" }, { "selected": false, "text": "5m", "value": "5m" }, { "selected": false, "text": "1h", "value": "1h" }, { "selected": false, "text": "6h", "value": "6h" }, { "selected": false, "text": "1d", "value": "1d" } ], "query": "1s,5s,30s,1m,5m,1h,6h,1d", "queryValue": "", "refresh": 2, "skipUrlSync": false, "type": "interval" }, { "current": { "selected": false, "text": "192.168.247.51", "value": "192.168.247.51" }, "datasource": { "type": "prometheus", "uid": "LC4fjIn4z" }, "definition": "label_values(namedprocess_namegroup_num_procs, host)", "hide": 0, "includeAll": false, "label": "Host", "multi": false, "name": "host", "options": [], "query": { "query": "label_values(namedprocess_namegroup_num_procs, host)", "refId": "Prometheus-host-Variable-Query" }, "refresh": 2, "regex": "", "skipUrlSync": false, "sort": 1, "tagValuesQuery": "", "tagsQuery": "", "type": "query", "useTags": false }, { "allValue": ".+", "current": { "selected": false, "text": "All", "value": "$__all" }, "datasource": { "type": "prometheus", "uid": "LC4fjIn4z" }, "definition": "label_values(namedprocess_namegroup_cpu_seconds_total{host=~\"$host\"},groupname)", "hide": 0, "includeAll": true, "label": "Processes", "multi": true, "name": "processes", "options": [], "query": { "query": "label_values(namedprocess_namegroup_cpu_seconds_total{host=~\"$host\"},groupname)", "refId": "Prometheus-processes-Variable-Query" }, "refresh": 2, "regex": "", "skipUrlSync": false, "sort": 0, "tagValuesQuery": "", "tagsQuery": "", "type": "query", "useTags": false }, { "current": { "selected": false, "text": "monitoring-node-01", "value": "monitoring-node-01" }, "datasource": { "type": "prometheus", "uid": "LC4fjIn4z" }, "definition": "label_values(namedprocess_namegroup_cpu_seconds_total{host='$host'},hostname)", "hide": 0, "includeAll": false, "label": "hostname", "multi": false, "name": "hostname", "options": [], "query": { "query": "label_values(namedprocess_namegroup_cpu_seconds_total{host='$host'},hostname)", "refId": "Prometheus-hostname-Variable-Query" }, "refresh": 1, "regex": "", "skipUrlSync": false, "sort": 0, "tagValuesQuery": "", "tagsQuery": "", "type": "query", "useTags": false } ] }, "time": { "from": "now-5m", "to": "now" }, "timepicker": { "refresh_intervals": [ "24h" ], "time_options": [ "5m", "15m", "1h", "6h", "12h", "24h", "2d", "7d", "30d" ] }, "timezone": "browser", "title": "虚机-System-Processes", "uid": "jOmVeJS7z", "version": 1, "weekStart": "" }
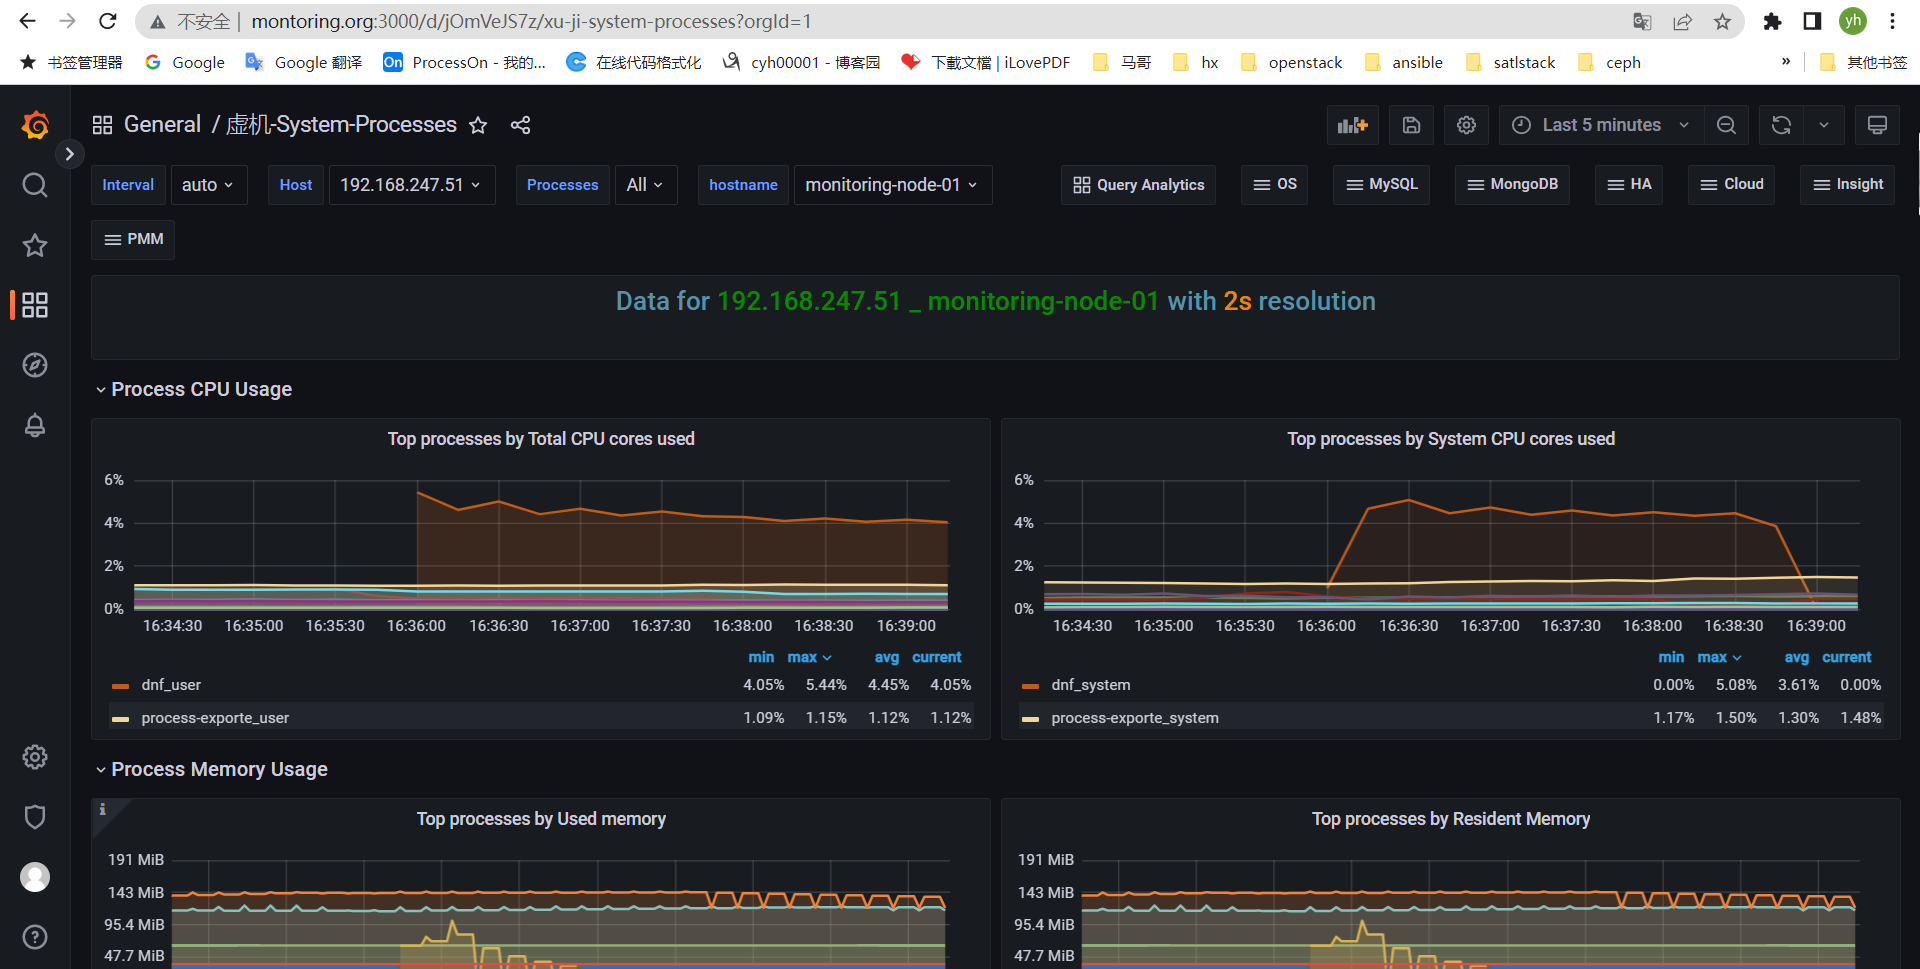
九、Alertmanager告警配置
下载Alertmanager二进制包
wget https://github.com/prometheus/alertmanager/releases/download/v0.24.0/alertmanager-0.24.0.linux-amd64.tar.gz
tar -xf alertmanager-0.24.0.linux-amd64.tar.gz
mv alertmanager-0.24.0.linux-amd64/ alertmanager
mv alertmanager /opt/
[root@monitoring-node-01 ~]# vim /etc/systemd/system/alertmanager.service
[root@monitoring-node-01 ~]# cat /etc/systemd/system/alertmanager.service
[Unit]
Description=Prometheus alertmanager
After=network.target

[Service]
ExecStart=/opt/alertmanager/alertmanager --config.file=/opt/alertmanager/alertmanager.yml

[Install]
WantedBy=multi-user.target
[root@monitoring-node-01 ~]#
systemctl enable --now alertmanager
创建Prometheus告警规则
[root@monitoring-node-01 prometheus-2.37.1.linux-amd64]# cat rules/all-alter.rules
groups:
- name: defaultStatsAlert
  rules:
  - alert: cpuUsageAlert
    expr: (100 - (avg by (instance,hostname,hosttype,responsibility)(irate(node_cpu_seconds_total{job="consul_sd_node_exporter",mode="idle"}[3m])) * 100)) > 80
    for: 10m
    labels:
      team: node
#    labels:
#      severity: page
    annotations:
      summary: "{{ $labels.host }} CPU usgae high"
      description: "{{ $labels.host }} CPU usage above 80% (current value: {{ $value }})"

  - alert: cpuIOwaitAlert
    expr: (avg by (hostname,instance,hosttype,responsibility)(irate(node_cpu_seconds_total{business=~'test',job="consul_sd_node_exporter",mode="iowait"}[3m])) * 100) > 25
    for: 10m
    labels:
      team: node
    annotations:
      summary: "{{ $labels.instance }} CPU iowait high"
      description: "{{ $labels.host }} CPU iowait above 25% (current value: {{ $value }})"

  - alert: sysLoadAlert
    expr: sum by(hostname, instance,business,hosttype,responsibility) (node_load5{job="consul_sd_node_exporter"}) / count by(hostname, instance,business,hosttype,responsibility) (count by(cpu, hostname, instance,business,hosttype,responsibility) (node_cpu_seconds_total{job="consul_sd_node_exporter"})) > 0.85
    for: 10m
    labels:
      team: node
    annotations:
    #  summary: "{{ $labels.instance }} CPU usgae high"
      #description: "{{ $labels.host }} CPU load1m is greater than cpu core number for 1min(current value: {{ $value }})"
      description: "{{ $labels.host }} CPU load5m is greater than cpu core number(current value: cpu 核数的{{ $value }}倍 )"

  - alert: sys-time-Alert
    expr: time() - node_time_seconds{job="consul_sd_node_exporter"} > 125
    for: 10m
    labels:
      team: node
    annotations:
      description: "{{ $labels.host }} system time is inconsistent (current value: {{ $value }}s)"
  - alert: sys-time-Alert1
    expr: time() - node_time_seconds{job="consul_sd_node_exporter"} < -125
    for: 10m
    labels:
      team: node
    annotations:
      description: "{{ $labels.host }} system time is inconsistent (current value: {{ $value }}s)"

  - alert: memUsageAlert
    #expr: ((node_memory_MemTotal_bytes{job="consul_sd_node_exporter"} - (node_memory_MemAvailable_bytes{job="consul_sd_node_exporter"}))/node_memory_MemTotal_bytes{job="consul_sd_node_exporter"}) * 100 > 90
    expr: ((node_memory_MemTotal_bytes{job="consul_sd_node_exporter"} - (node_memory_MemFree_bytes{job="consul_sd_node_exporter"}+node_memory_Buffers_bytes{job="consul_sd_node_exporter"}+node_memory_Cached_bytes{job="consul_sd_node_exporter"}+node_memory_SReclaimable_bytes{job="consul_sd_node_exporter"}))/node_memory_MemTotal_bytes{job="consul_sd_node_exporter"}) * 100 > 90
    for: 15m
    labels:
      team: mem
#    labels:
#      severity: page
    annotations:
      summary: "{{ $labels.host }} MEM usgae high"
      description: "{{ $labels.host }} MEM usage above 90% (current value: {{ $value }})"

  - alert: NodeDown
    expr: up{job="consul_sd_node_exporter"} == 0
    for: 1m
    labels:
      team: down
#    labels:   可以使用这个label在altermanager中配置match分组
#      team: node
    annotations:
      description: '{{ $labels.host}} has been down for 1m'

  - alert: disk_utilization_rate
    expr: 100 - ((node_filesystem_avail_bytes{business=~'test',fstype!~"rootfs|selinuxfs|autofs|rpc_pipefs|tmpfs|fuse.lxcfs|iso9660",mountpoint!~"/boot",job="consul_sd_node_exporter"} * 100) / node_filesystem_size_bytes {business=~'test',fstype!~"rootfs|selinuxfs|autofs|rpc_pipefs|tmpfs|fuse.lxcfs|iso9660",mountpoint!~"/boot",job="consul_sd_node_exporter"}) > 90
    for: 10m
    labels:
      team: disk
    annotations:
      description: '{{$labels.host}} {{$labels.mountpoint}} excess 90% --> {{$value}}'

  - alert: network_receive_bytes
    expr: irate(node_network_receive_bytes_total{business=~'test',device!~'tap.*|veth.*|br.*|docker.*|virbr*|lo*',job="consul_sd_node_exporter"}[3m])*8/1024/1024 > 800
    for: 5m
    labels:
      team: node
    annotations:
      description: '{{$labels.host}} network receive bytes reach to {{$value}} MB/s'

  - alert: network_transmit_bytes
    expr: irate(node_network_transmit_bytes_total{business=~'test',device!~'tap.*|veth.*|br.*|docker.*|virbr*|lo*',job="consul_sd_node_exporter"}[3m])*8/1024/1024 > 800
    for: 5m
    labels:
      team: node
    annotations:
      description: '{{$labels.host}} network transmit bytes reach to {{$value}} MB/s'

  - alert: frame-alert
    expr: node_network_receive_frame_total{device!~"tap.*|veth.*|br.*|docker.*|virbr*|lo*"} - min_over_time(node_network_receive_frame_total{device!~"tap.*|veth.*|br.*|docker.*|virbr*|lo*"}[1h]) >= 5
    for: 10s
    labels:
      team: node
    annotations:
      description: '{{$labels.host}} network frame growth {{$value}}'

  - alert: time_zone-alert
    expr: time_zone{tz!="CST"} == 0
    for: 10s
    labels:
      team: node
    annotations:
      description: '{{$labels.host}} time zone is not CST'
[root@monitoring-node-01 prometheus-2.37.1.linux-amd64]#
配置Prometheus配置
[root@monitoring-node-01 prometheus-2.37.1.linux-amd64]# cat prometheus.yml
# my global config
global:
  scrape_interval: 15s # Set the scrape interval to every 15 seconds. Default is every 1 minute.
  evaluation_interval: 15s # Evaluate rules every 15 seconds. The default is every 1 minute.
  # scrape_timeout is set to the global default (10s).

# Alertmanager configuration
alerting:
  alertmanagers:
    - static_configs:
        - targets:
           - "192.168.247.51:9093"

# Load rules once and periodically evaluate them according to the global 'evaluation_interval'.
rule_files:
  # - "first_rules.yml"
  # - "second_rules.yml"
  - "./rules/*"

# A scrape configuration containing exactly one endpoint to scrape:
# Here it's Prometheus itself.
scrape_configs:
  # The job name is added as a label `job=<job_name>` to any timeseries scraped from this config.
  - job_name: "prometheus"
    # metrics_path defaults to '/metrics'
    # scheme defaults to 'http'.
    static_configs:
      - targets: ["192.168.247.51:9090"]

  - job_name: "alertmanager"
    static_configs:
    - targets: ["192.168.247.51:9093"]

  - job_name: 'file_sd_node_export'
    file_sd_configs:
      - files:
        - /opt/prometheus/prometheus-2.37.1.linux-amd64/file_sd/sd_node-exporter.json
        refresh_interval: 10s

  - job_name: 'file_sd_process_export'
    file_sd_configs:
      - files:
        - /opt/prometheus/prometheus-2.37.1.linux-amd64/file_sd/sd_process-exporter.json
        refresh_interval: 10s

  - job_name: 'consul_sd_node_exporter'
    metrics_path: /metrics
    honor_labels: false
    consul_sd_configs:
      - server: '192.168.247.52:8500'
        scheme: http
        services: ['node_exporter']
    relabel_configs:                        #根据实际监控所需添加label,并在注册时注册
    - source_labels: ['__meta_consul_test']   # datacenter,会显示注册到的consul的datacenter
      target_label: 'bgy'
    - source_labels: ['__meta_consul_service_address']
      target_label: 'host'
    - source_labels: ['__meta_consul_service_metadata_hostname']
      target_label: 'hostname'
    - source_labels: ['__meta_consul_service_metadata_business']
      target_label: 'business'
  - job_name: 'sa_process_exporter'
    scrape_interval: 10s
    honor_labels: false
    consul_sd_configs:
      - server: '192.168.247.52:8500'
        scheme: http
        services: ['process_exporter']
    relabel_configs:
    - source_labels: ['__meta_consul_service_address']
      target_label: 'host'
    - source_labels: ['__meta_consul_service_metadata_hostname']
      target_label: 'hostname'
[root@monitoring-node-01 prometheus-2.37.1.linux-amd64]#
配置alertmanager告警
vim /opt/alertmanager/alertmanager.yml
global:
  resolve_timeout: 5m
  smtp_smarthost: 'smtp.139.com:25'
  smtp_from: '1xxxxxxxxx3@139.com'
  smtp_auth_username: '1xxxxxxxxxxx3@139.com'
  smtp_auth_password: '2xxxxxxxxxxxx00'
  smtp_require_tls: false

route:
  group_by: ['alertname']
  group_wait: 10s
  group_interval: 2m
  repeat_interval: 5m
  receiver: 'ops'

receivers:
  - name: 'ops'
    webhook_configs:
    - url: 'http://localhost:8060/dingtalk/webhook1/send'
      send_resolved: true

inhibit_rules:
  - source_match:
     severity: 'critical'
    target_match:
     severity: 'warning'
    equal: ['alertname', 'dev', 'instance']
systemctl restart alertmanager && systemctl restart prometheus
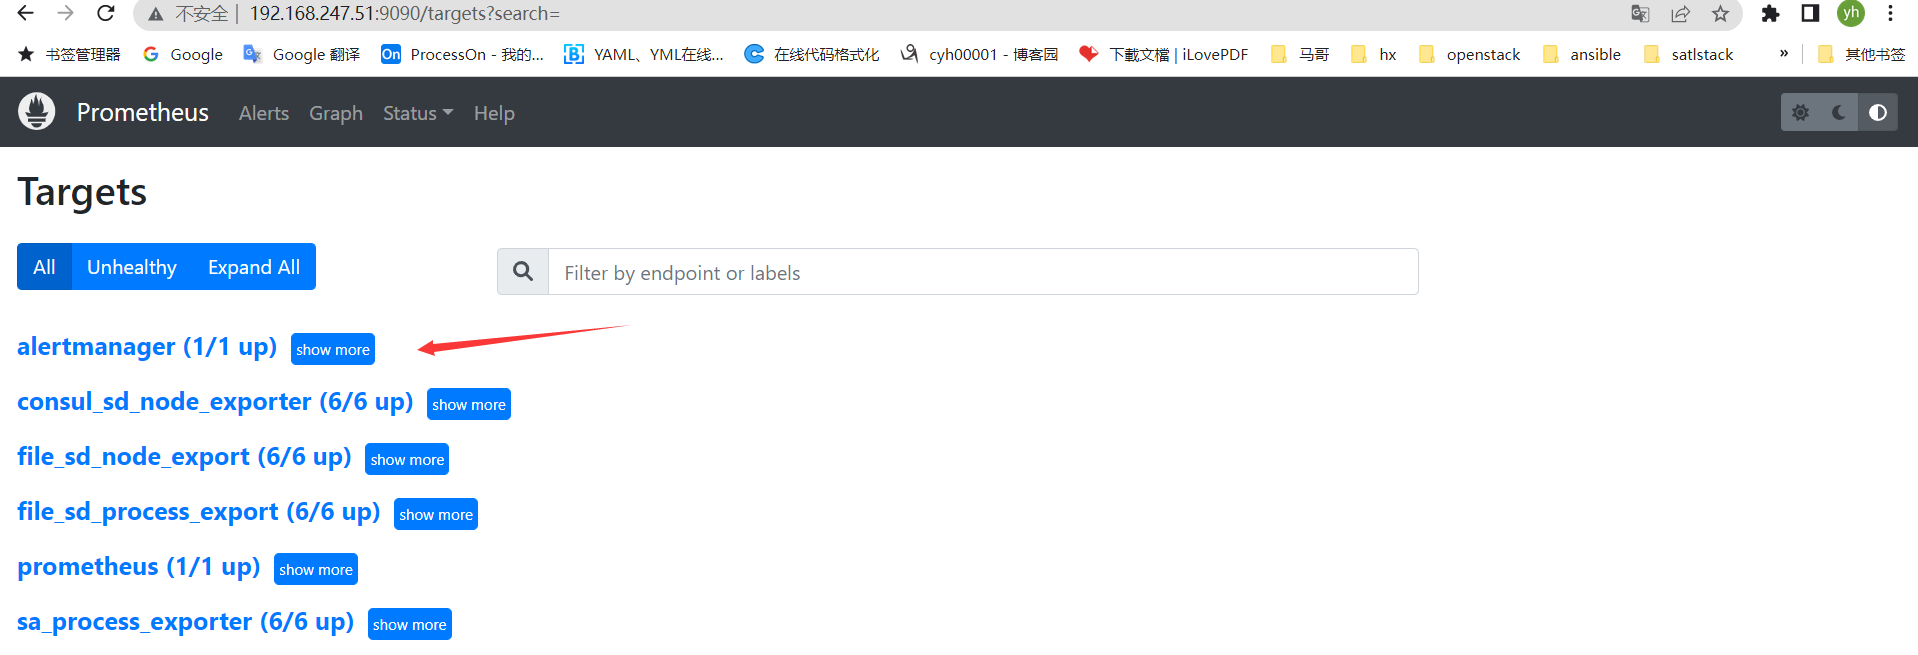
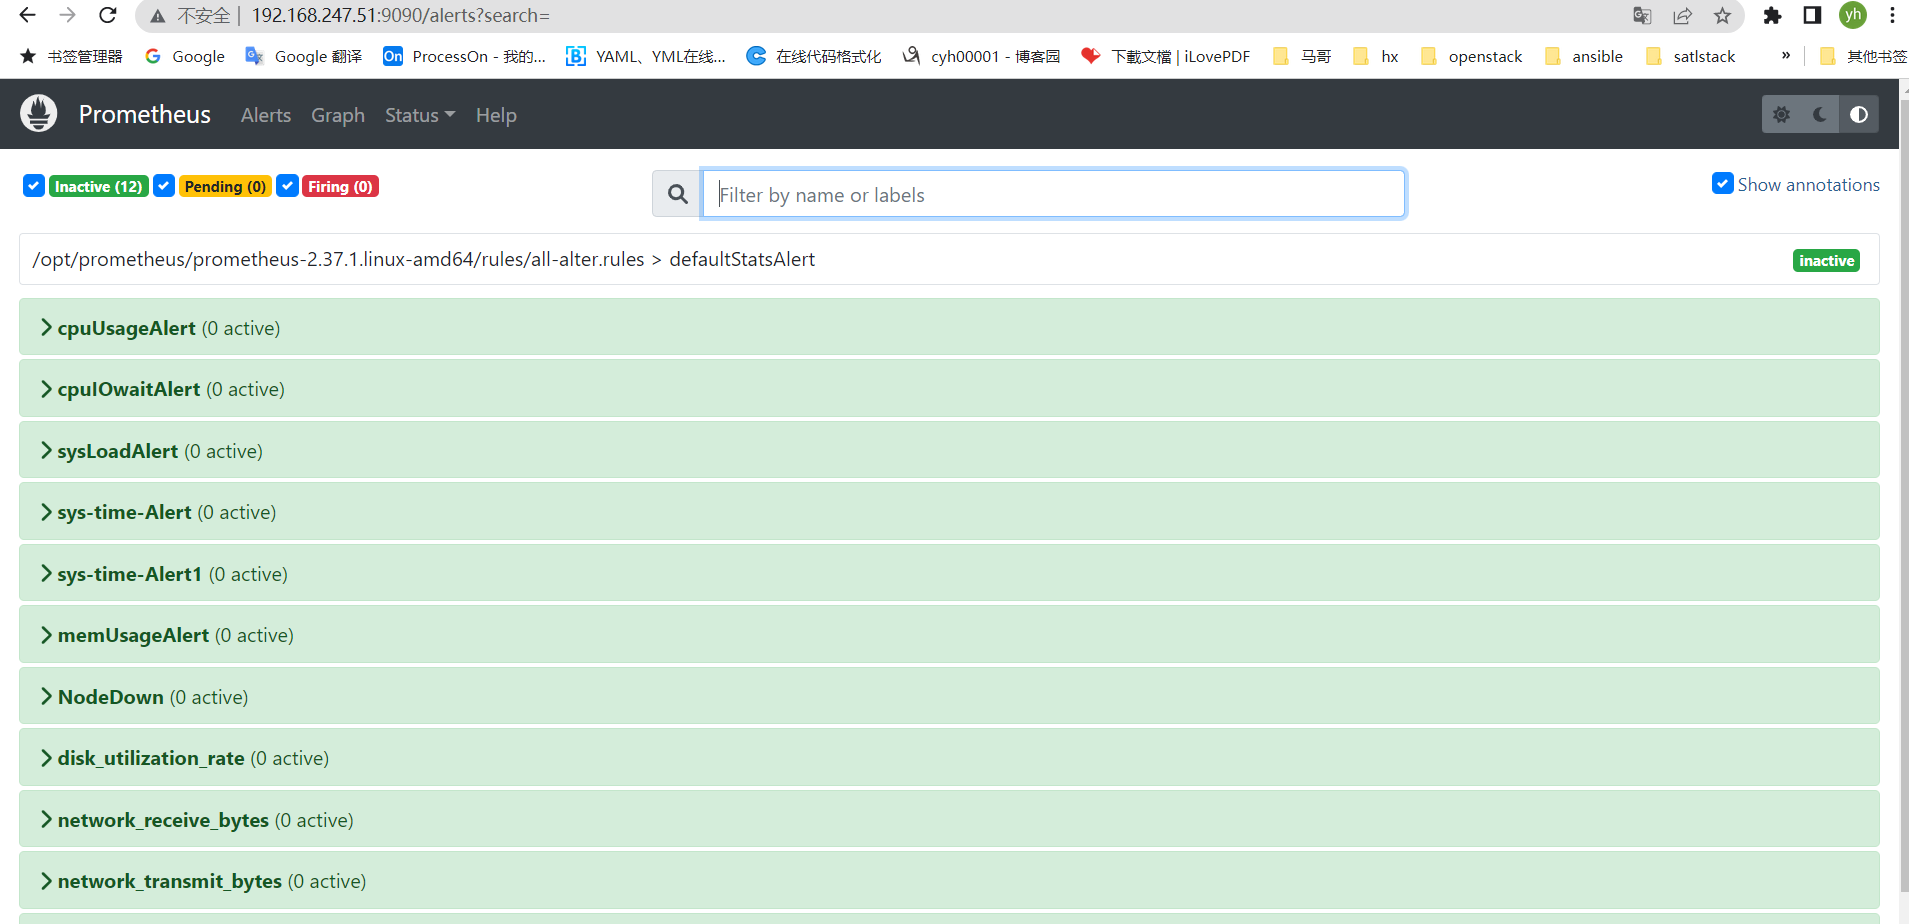
测试告警
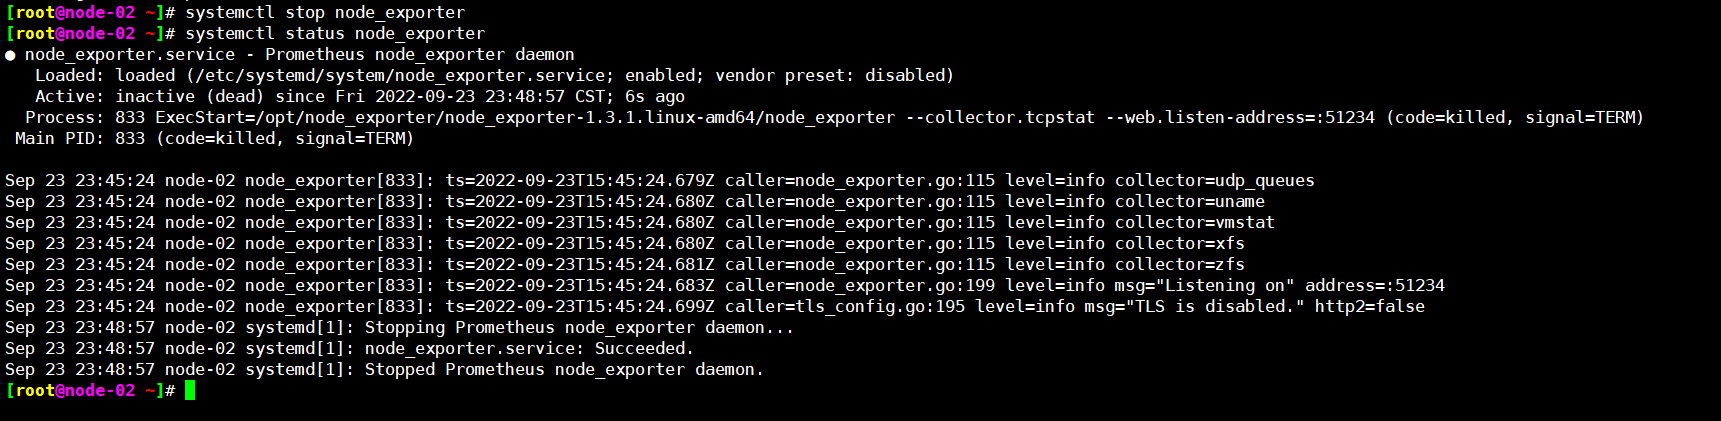
此时Prometheus已经监测节点异常
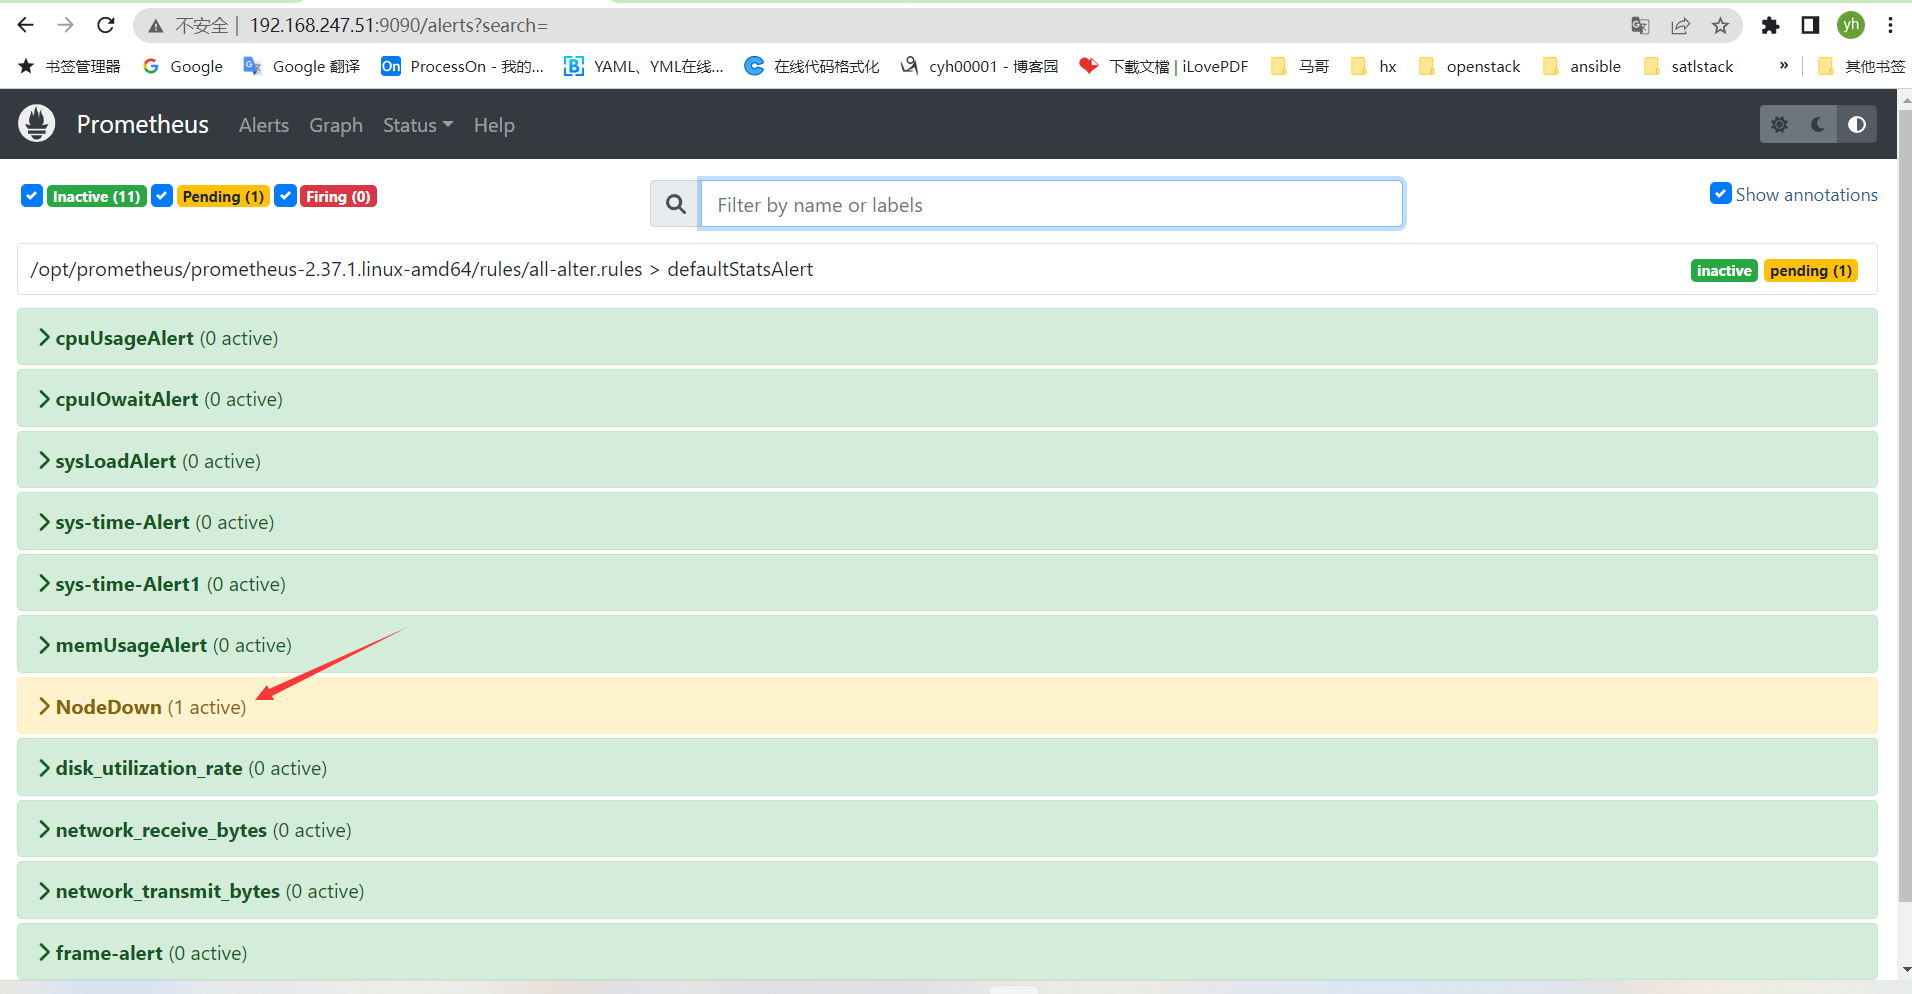
点击查看显示1分钟未处理恢复,将自己的触发告警机制,发送邮件通知
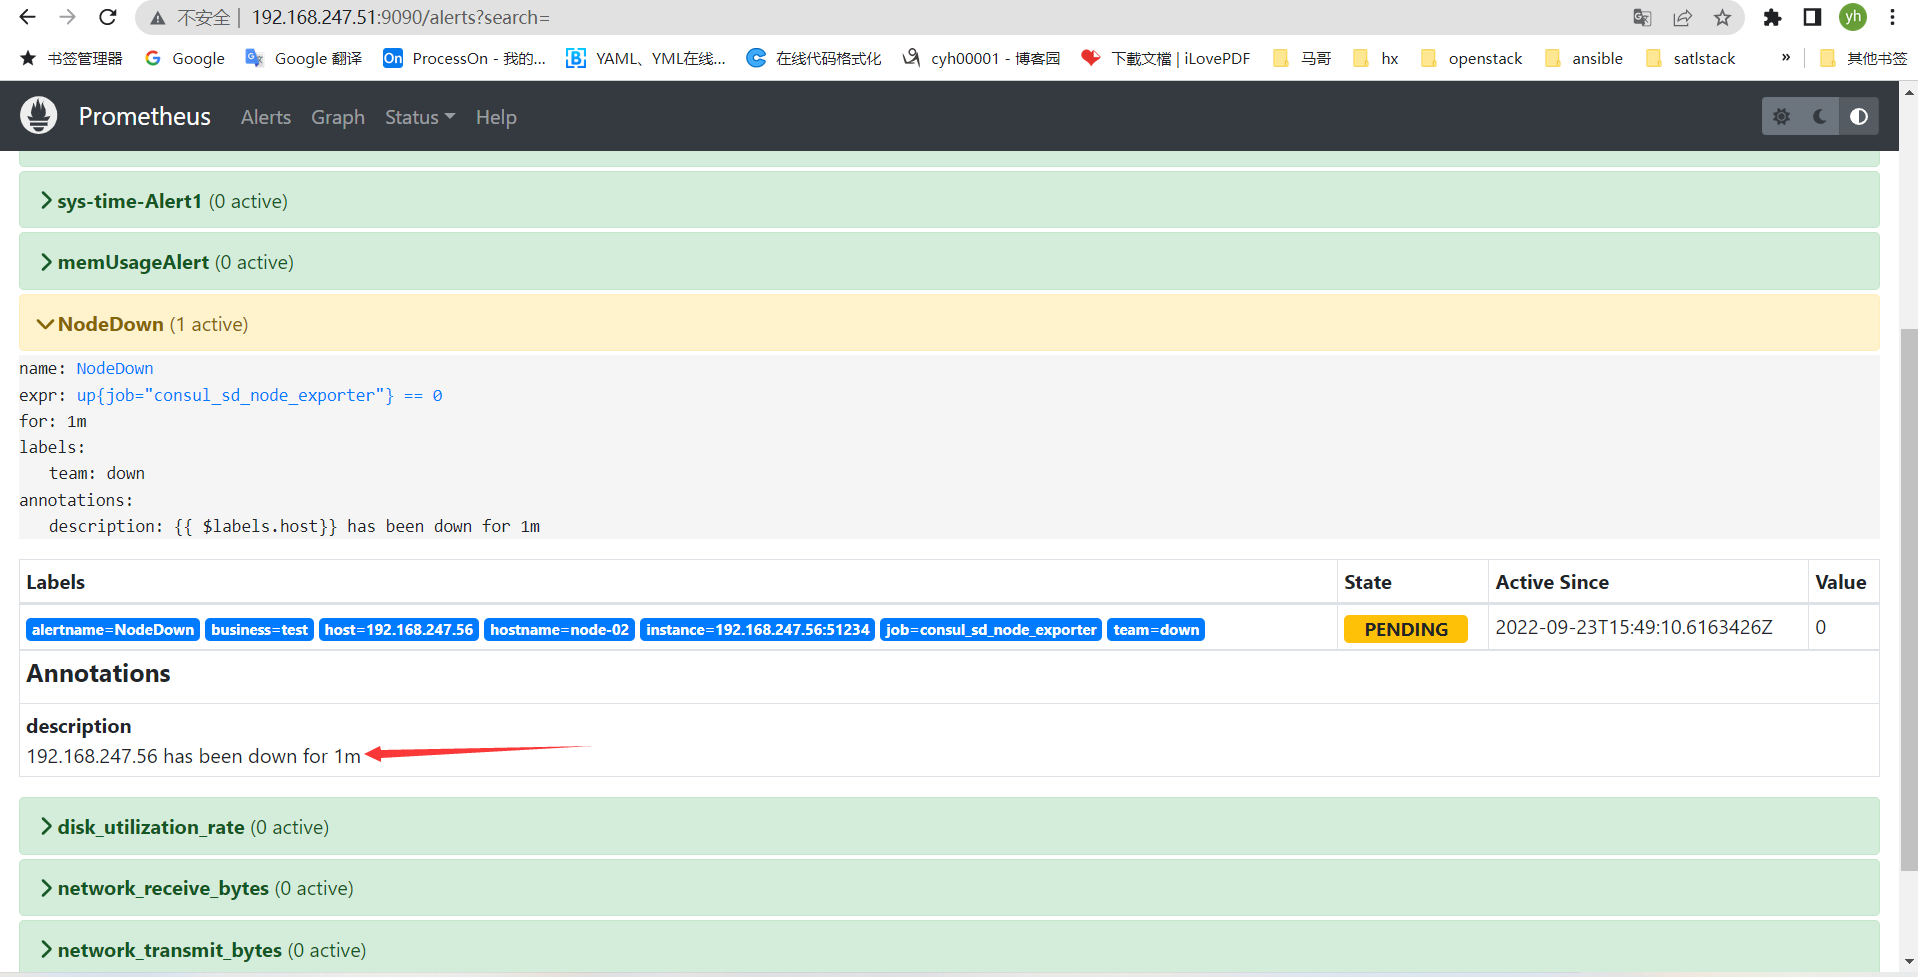
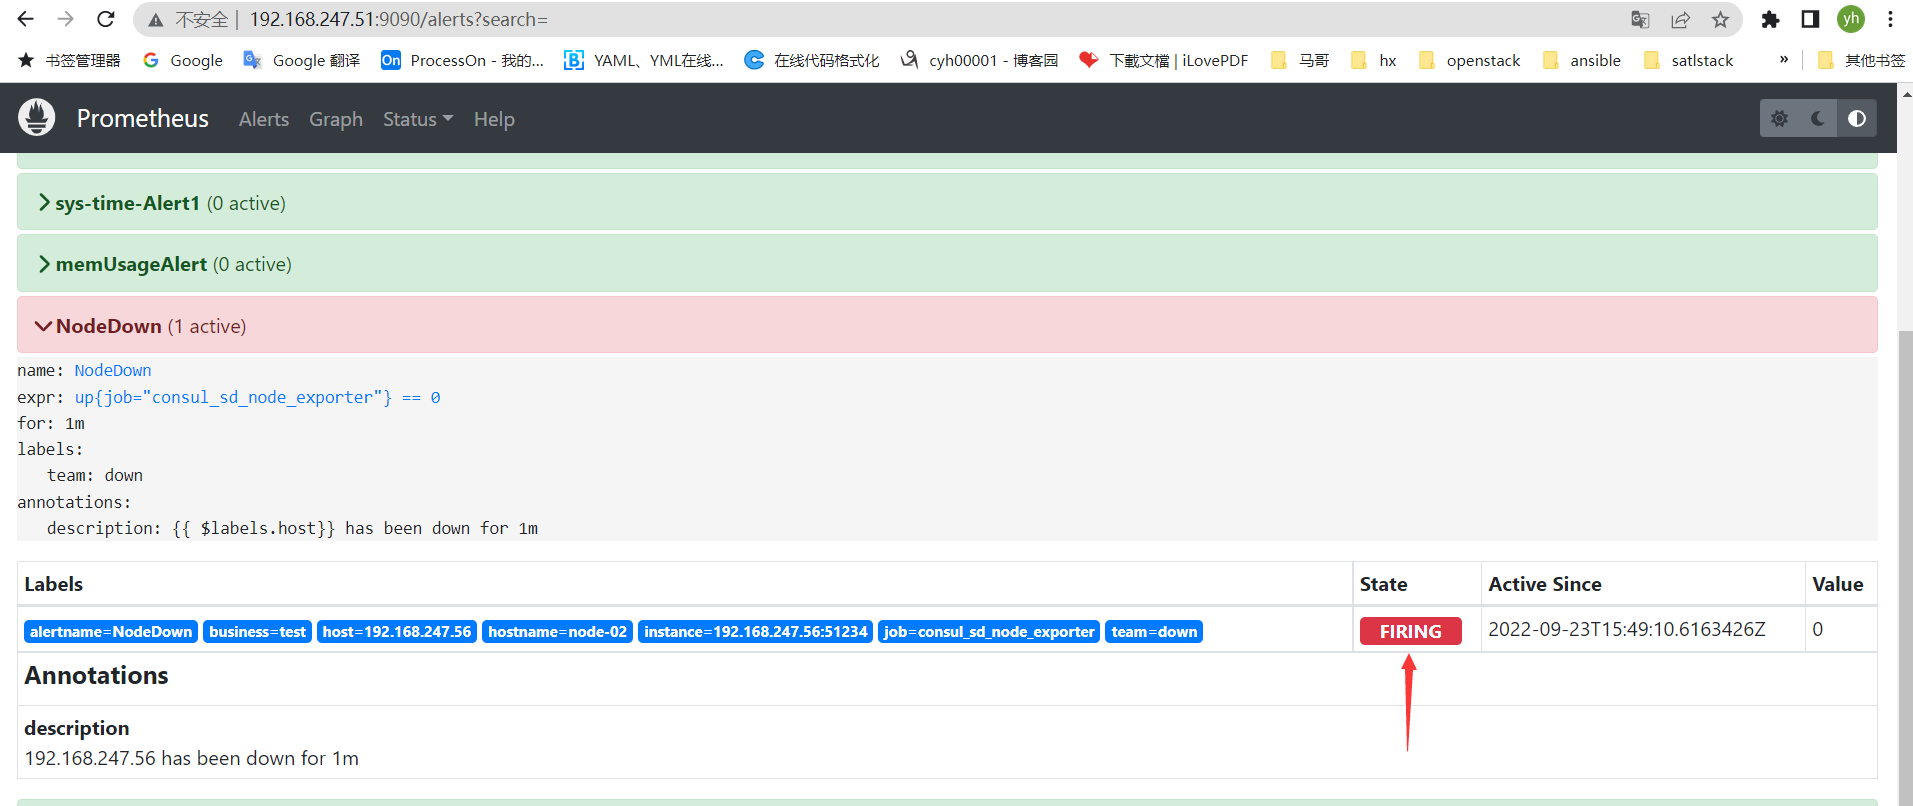
十、配置钉钉告警
下载钉钉二进制包
wget https://github.com/timonwong/prometheus-webhook-dingtalk/releases/download/v2.1.0/prometheus-webhook-dingtalk-2.1.0.linux-amd64.tar.gz
tar -xf prometheus-webhook-dingtalk-2.1.0.linux-amd64.tar.gz -C /opt/
cd /opt/
mv prometheus-webhook-dingtalk-2.1.0.linux-amd64/ prometheus-webhook-dingtalk
systemctl enable --now prometheus-dingtalk
[root@monitoring-node-01 ~]# cat /etc/systemd/system/prometheus-dingtalk.service
[Unit]
Description=Prometheus dingtalk
After=network.target

[Service]
ExecStart=/opt/prometheus-webhook-dingtalk/prometheus-webhook-dingtalk --config.file=/opt/prometheus-webhook-dingtalk/config.yml --web.listen-address=:8060

[Install]
WantedBy=multi-user.target
[root@monitoring-node-01 ~]#
配置钉钉告警规则
vim /opt/prometheus-webhook-dingtalk/config.yml
## Request timeout
# timeout: 5s

## Uncomment following line in order to write template from scratch (be careful!)
#no_builtin_template: true

## Customizable templates path
templates:
  - contrib/templates/dingding.yml

## You can also override default template using `default_message`
## The following example to use the 'legacy' template from v0.3.0
#default_message:
#  title: '{{ template "legacy.title" . }}'
#  text: '{{ template "legacy.content" . }}'

## Targets, previously was known as "profiles"
targets:
  webhook1:
    url: https://oapi.dingtalk.com/robot/send?access_token=axxxxxxxxxxxxxxxxxxxxxxxxxxxxxxxxxxxxxd
    # secret for signature
    secret: SECd1557e7bd1b609a7be1ac1407316caea32fa5ab34a4a529dea67c6684d7ebaf8
  webhook2:
    url: https://oapi.dingtalk.com/robot/send?access_token=axxxxxxxxxxxxxxxxxxxxxxxxxxxxxxxxxxxxxxxd
  webhook_legacy:
    url: https://oapi.dingtalk.com/robot/send?access_token=axxxxxxxxxxxxxxxxxxxxxxxxxxxxxxxxxxxxxxxd
vim /opt/prometheus-webhook-dingtalk/contrib/templates/dingding.yml
{{ define "__subject" }}[{{ .Status | toUpper }}{{ if eq .Status "firing" }}:{{ .Alerts.Firing | len }}{{ end }}{{ if eq .Status "resolved" }}:{{ .Alerts.Resolved | len }}{{ end }}] {{ .GroupLabels.SortedPairs.Values | join " " }} {{ if gt (len .CommonLabels) (len .GroupLabels) }}({{ with .CommonLabels.Remove .GroupLabels.Names }}{{ .Values | join " " }}{{ end }}){{ end }}{{ end }}
{{ define "__alertmanagerURL" }}{{ .ExternalURL }}/#/alerts?receiver={{ .Receiver }}{{ end }}

{{ define "__text_alert_list" }}{{ range . }}
**Labels**
{{ range .Labels.SortedPairs }}> - {{ .Name }}: {{ .Value | markdown | html }}
{{ end }}
**Annotations**
{{ range .Annotations.SortedPairs }}> - {{ .Name }}: {{ .Value | markdown | html }}
{{ end }}

{{ end }}{{ end }}

{{ define "ding.link.title" }}{{ template "__subject" . }}{{ end }}
{{ define "ding.link.content" }}#### \[{{ .Status | toUpper }}{{ if eq .Status "firing" }}:{{ .Alerts.Firing | len }}{{ end }}\] **[{{ index .GroupLabels "alertname" }}]({{ template "__alertmanagerURL" . }})**
{{ template "__text_alert_list" .Alerts.Firing }}
{{ template "__text_alert_list" .Alerts.Resolved }}
{{ end }}
启动钉钉
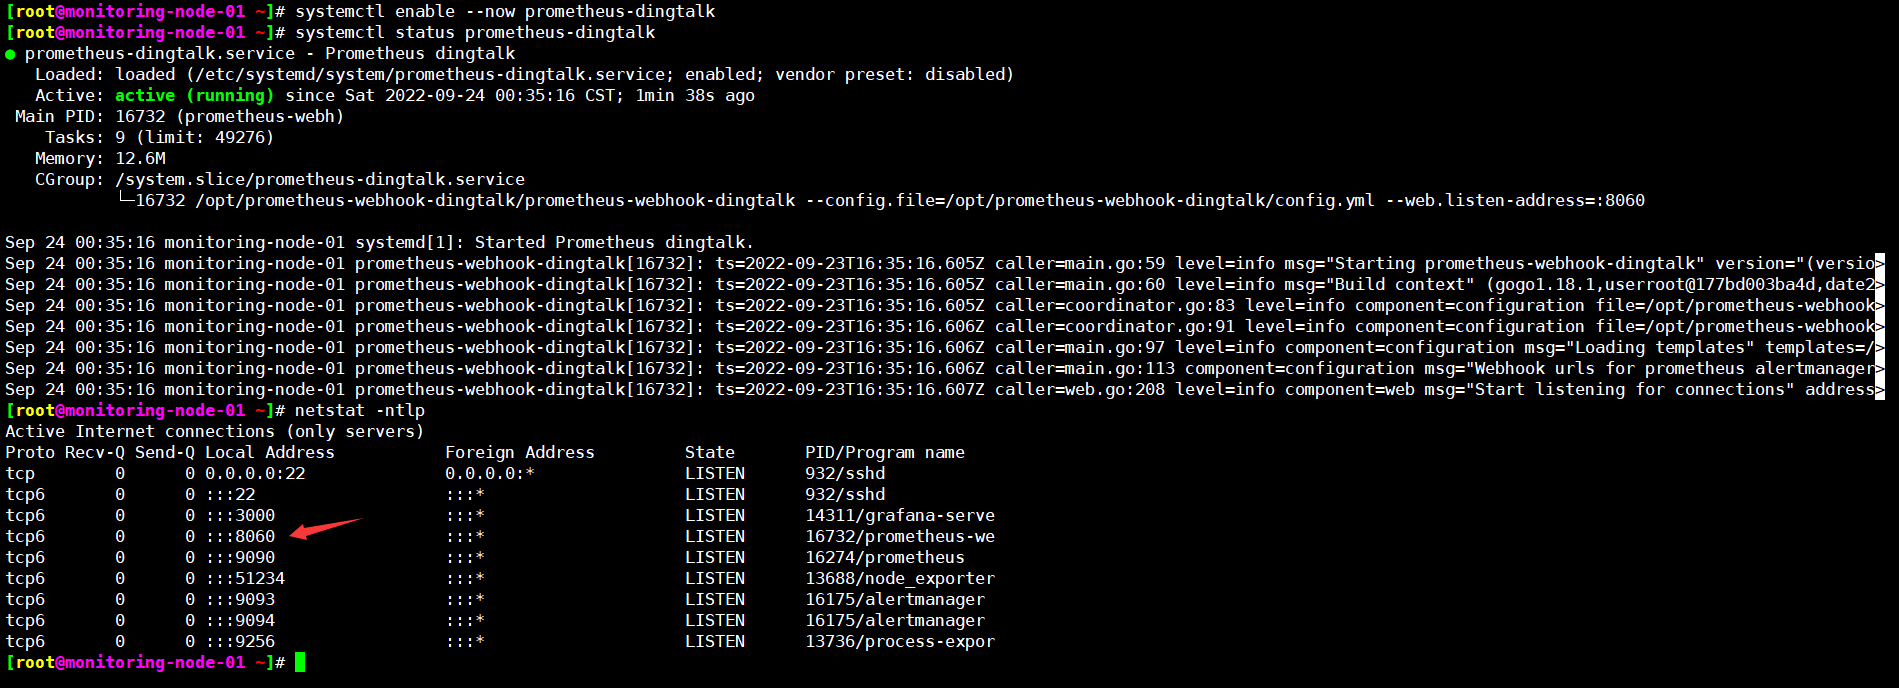
钉钉app接收到相关告警
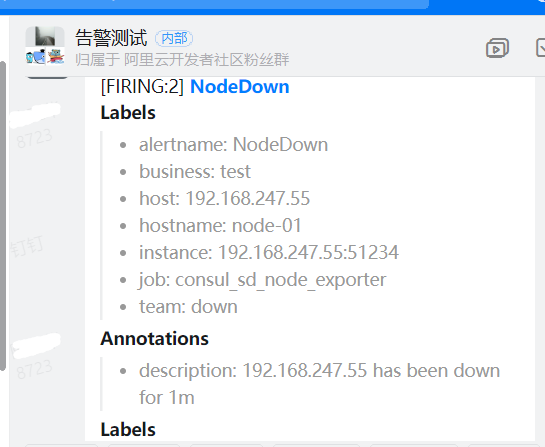
恢复服务