
基于Operator方式在k8s集群安装kube-prometheus+rook-ceph
一、k8s集群环境搭建
请参考:https://www.cnblogs.com/cyh00001/p/16520847.html
二、部署rook-ceph集群
2.1、环境需求
准备ceph节点,并把它当成node节点加入k8s集群
easzlab-k8s-ceph-01     172.16.88.163 4vcpu 8G  3*100G
easzlab-k8s-ceph-02     172.16.88.164 4vcpu 8G  3*100G
easzlab-k8s-ceph-03     172.16.88.165 4vcpu 8G  3*100G
2.2、安装部署
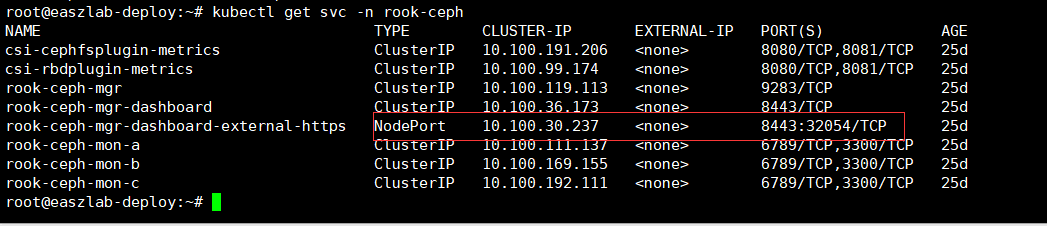
root@easzlab-deploy:~# wget  https://github.com/rook/rook/archive/refs/tags/v1.9.8.tar.gz
root@easzlab-deploy:~# tar -xf v1.9.8.tar.gz
root@easzlab-deploy:~# cd rook-1.9.8/deploy/examples/
root@easzlab-deploy:~/rook-1.9.8/deploy/examples# kubectl create -f crds.yaml -f common.yaml -f operator.yaml
root@easzlab-deploy:~/rook-1.9.8/deploy/examples# kubectl create -f cluster.yaml
root@easzlab-deploy:~/rook-1.9.8/deploy/examples# kubectl apply -f toolbox.yaml   #安装ceph管理端
root@easzlab-deploy:~/rook-1.9.8/deploy/examples# kubectl apply -f dashboard-external-https.yam  #通过svc映射端口到本地
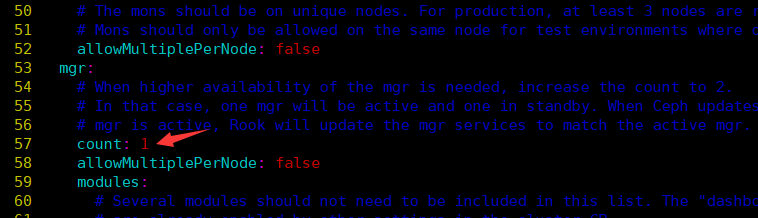
注意:cluster.yml下mgr count数要调成1,默认是2,如果设为2,在安装ceph dashboard后,访问ceph dashboard会出错
2.3、安装完成后效果

root@easzlab-deploy:~# kubectl get pod -n rook-ceph
NAME                                                      READY   STATUS      RESTARTS       AGE
csi-cephfsplugin-d2vrl                                    3/3     Running     6 (25h ago)    25d
csi-cephfsplugin-f5pww                                    3/3     Running     3 (24d ago)    25d
csi-cephfsplugin-fnhzm                                    3/3     Running     6 (25h ago)    25d
csi-cephfsplugin-h6hx5                                    3/3     Running     3 (24d ago)    25d
csi-cephfsplugin-kps24                                    3/3     Running     3 (24d ago)    25d
csi-cephfsplugin-lp27f                                    3/3     Running     6 (25h ago)    25d
csi-cephfsplugin-lqnrd                                    3/3     Running     3 (24d ago)    25d
csi-cephfsplugin-provisioner-7b867fbd5f-66zqc             6/6     Running     6 (24d ago)    25d
csi-cephfsplugin-provisioner-7b867fbd5f-6qp92             6/6     Running     6 (24d ago)    25d
csi-cephfsplugin-xvvsc                                    3/3     Running     3 (24d ago)    25d
csi-cephfsplugin-zhlhv                                    3/3     Running     3 (24d ago)    25d
csi-rbdplugin-2lfch                                       3/3     Running     3 (24d ago)    25d
csi-rbdplugin-47264                                       3/3     Running     3 (24d ago)    25d
csi-rbdplugin-5bxrl                                       3/3     Running     6 (25h ago)    25d
csi-rbdplugin-h7vz9                                       3/3     Running     3 (24d ago)    25d
csi-rbdplugin-pnpdr                                       3/3     Running     3 (24d ago)    25d
csi-rbdplugin-provisioner-59fc59c8ff-b8knh                6/6     Running     12 (25h ago)   25d
csi-rbdplugin-provisioner-59fc59c8ff-v8cb8                6/6     Running     6 (24d ago)    25d
csi-rbdplugin-rcbmb                                       3/3     Running     6 (25h ago)    25d
csi-rbdplugin-rntvf                                       3/3     Running     3 (24d ago)    25d
csi-rbdplugin-vvbqz                                       3/3     Running     6 (25h ago)    25d
csi-rbdplugin-z9vs2                                       3/3     Running     3 (24d ago)    25d
rook-ceph-crashcollector-172.16.88.157-67d49d4c7f-t5xvh   1/1     Running     0              24d
rook-ceph-crashcollector-172.16.88.163-6d5c77d66-fc6ln    1/1     Running     2 (25h ago)    25d
rook-ceph-crashcollector-172.16.88.164-b5685db67-dk9rb    1/1     Running     2 (25h ago)    25d
rook-ceph-crashcollector-172.16.88.165-64d758974d-9w4gj   1/1     Running     2 (25h ago)    25d
rook-ceph-mgr-a-799d564c7f-pf87c                          1/1     Running     0              24d
rook-ceph-mon-a-79c9599bcd-27tz7                          1/1     Running     2 (25h ago)    25d
rook-ceph-mon-b-7448c6ff79-mhtq7                          1/1     Running     3 (25h ago)    25d
rook-ceph-mon-c-659cb46b87-z5k9h                          1/1     Running     1 (24d ago)    25d
rook-ceph-operator-7f4cc48c84-b68kn                       1/1     Running     3 (25h ago)    25d
rook-ceph-osd-0-8699855f87-g9cvb                          1/1     Running     2 (25h ago)    25d
rook-ceph-osd-1-7df7bdb9dc-cgkbs                          1/1     Running     2 (25h ago)    25d
rook-ceph-osd-2-56897b8df-6hnp7                           1/1     Running     2 (25h ago)    25d
rook-ceph-osd-3-85f7b4c965-wrf5b                          1/1     Running     2 (25h ago)    25d
rook-ceph-osd-4-66d6ff6bc8-2wsfs                          1/1     Running     2 (25h ago)    25d
rook-ceph-osd-5-684f4bdcbd-wd922                          1/1     Running     2 (25h ago)    25d
rook-ceph-osd-6-db4b5699-bnf68                            1/1     Running     2 (25h ago)    25d
rook-ceph-osd-7-d6ccbb9c4-lj7hd                           1/1     Running     2 (25h ago)    25d
rook-ceph-osd-8-5dddc545c6-hblb8                          1/1     Running     2 (25h ago)    25d
rook-ceph-osd-prepare-172.16.88.157-hvrv2                 0/1     Completed   0              5h6m
rook-ceph-osd-prepare-172.16.88.158-jm2vg                 0/1     Completed   0              5h6m
rook-ceph-osd-prepare-172.16.88.159-9cnlk                 0/1     Completed   0              5h6m
rook-ceph-osd-prepare-172.16.88.163-7mmpn                 0/1     Completed   0              5h6m
rook-ceph-osd-prepare-172.16.88.164-xxz85                 0/1     Completed   0              5h6m
rook-ceph-osd-prepare-172.16.88.165-6x2tl                 0/1     Completed   0              5h6m
rook-ceph-tools-74f48bf875-q95x2                          1/1     Running     1 (24d ago)    25d
root@easzlab-deploy:~#
三、创建ceph 存储类,为k8s集群提供动态存储
3.1、创建ceph存储类
vim hdd-sc.yaml
apiVersion: ceph.rook.io/v1
kind: CephBlockPool
metadata:
  name: hdd-rook-ceph-block
  namespace: rook-ceph
spec:
  failureDomain: host
  replicated:
    size: 2
  deviceClass: hdd
---
apiVersion: storage.k8s.io/v1
kind: StorageClass
metadata:
   name: hdd-rook-ceph-block
provisioner: rook-ceph.rbd.csi.ceph.com
parameters:
    clusterID: rook-ceph
    pool: hdd-rook-ceph-block
    imageFormat: "2"
    imageFeatures: layering
    csi.storage.k8s.io/provisioner-secret-name: rook-csi-rbd-provisioner
    csi.storage.k8s.io/provisioner-secret-namespace: rook-ceph
    csi.storage.k8s.io/node-stage-secret-name: rook-csi-rbd-node
    csi.storage.k8s.io/node-stage-secret-namespace: rook-ceph
    csi.storage.k8s.io/fstype: xfs
reclaimPolicy: Delete
kubectl apply -f hdd-sc.yaml
root@easzlab-deploy:~# kubectl get sc -A
NAME                  PROVISIONER                  RECLAIMPOLICY   VOLUMEBINDINGMODE   ALLOWVOLUMEEXPANSION   AGE
hdd-rook-ceph-block   rook-ceph.rbd.csi.ceph.com   Delete          Immediate           false                  20d
root@easzlab-deploy:~#
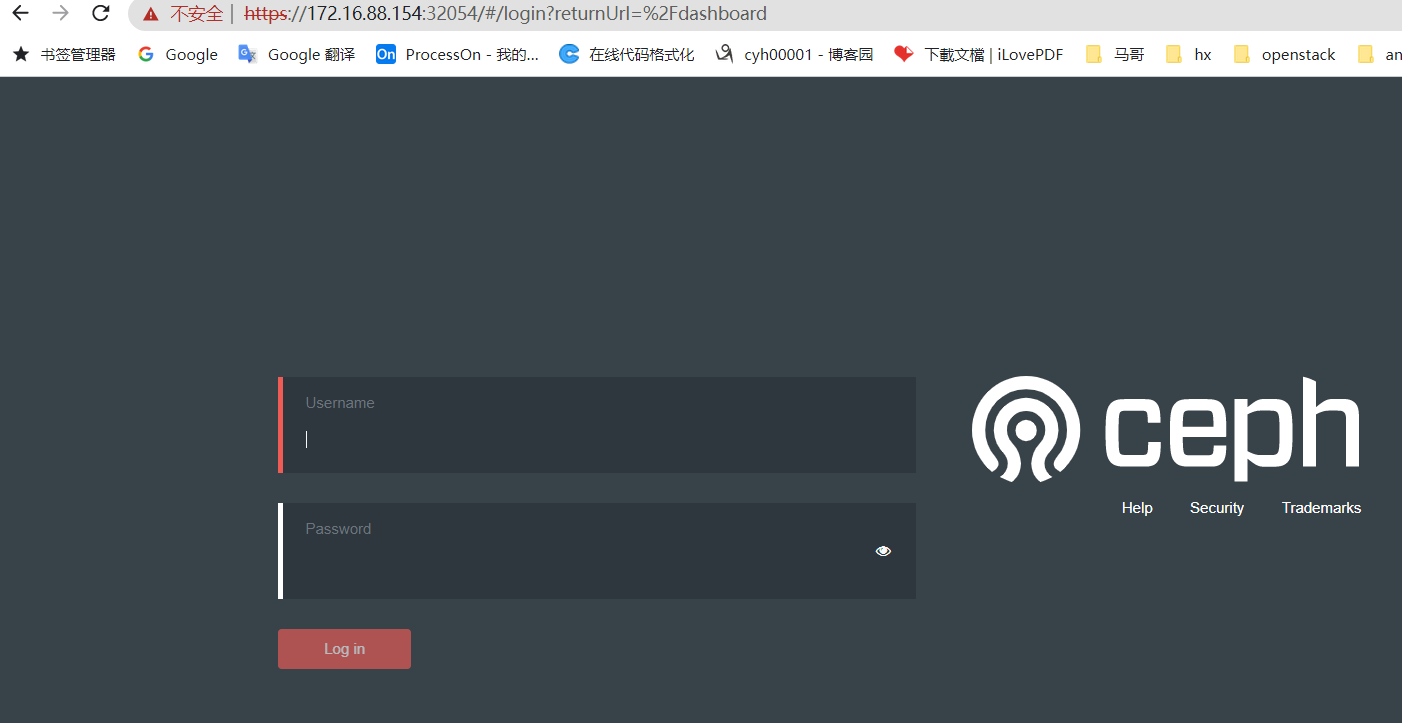
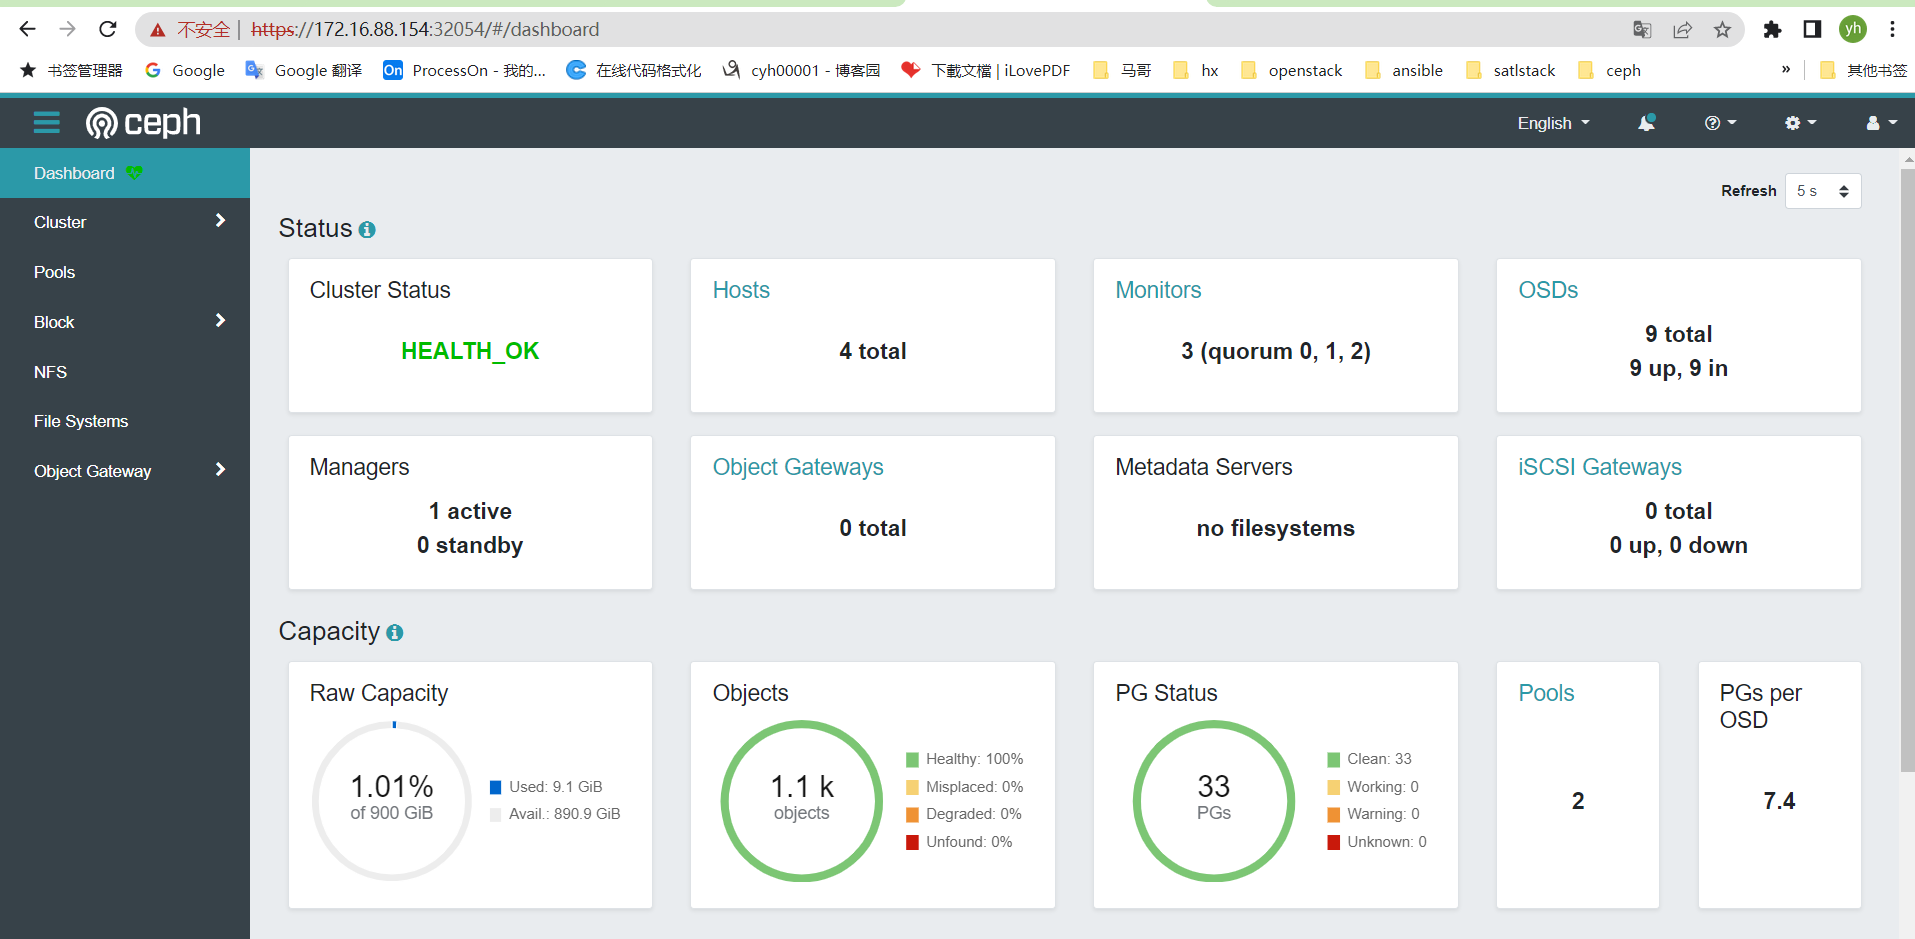
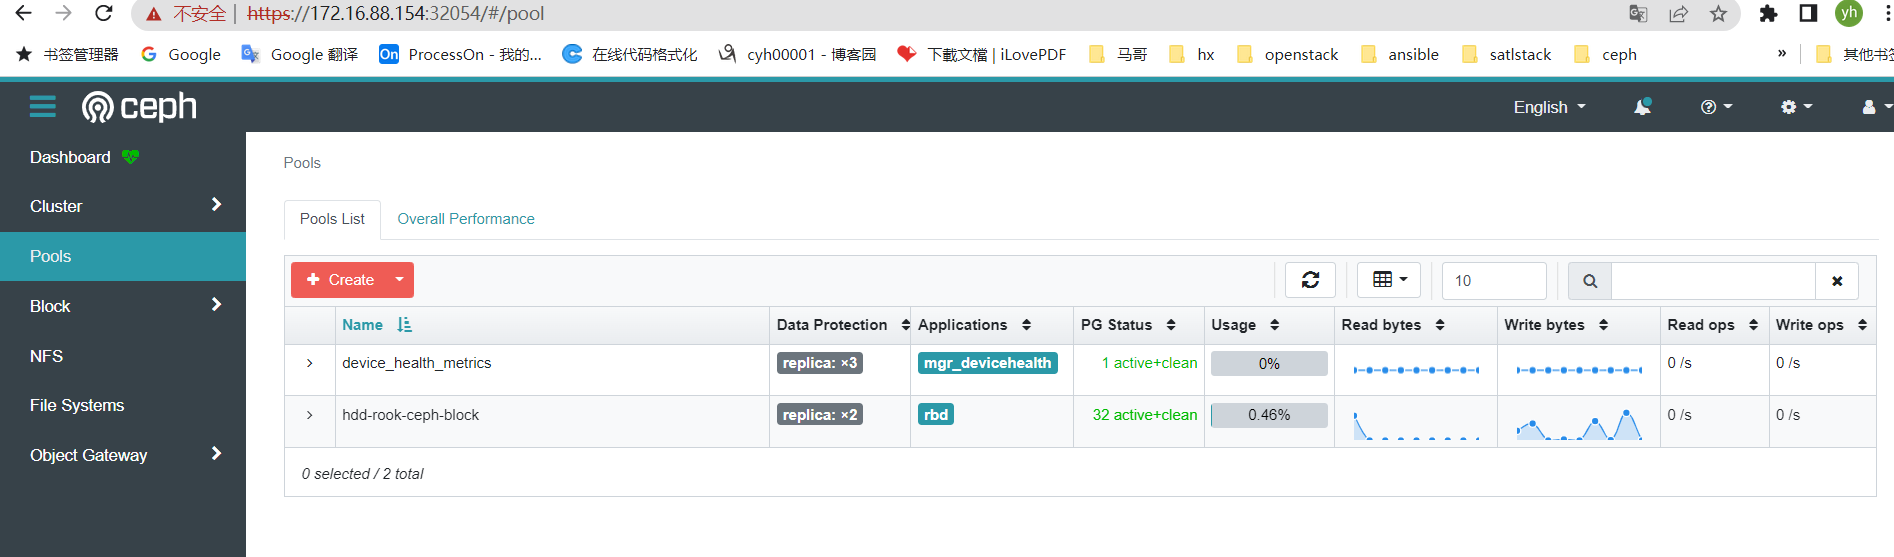
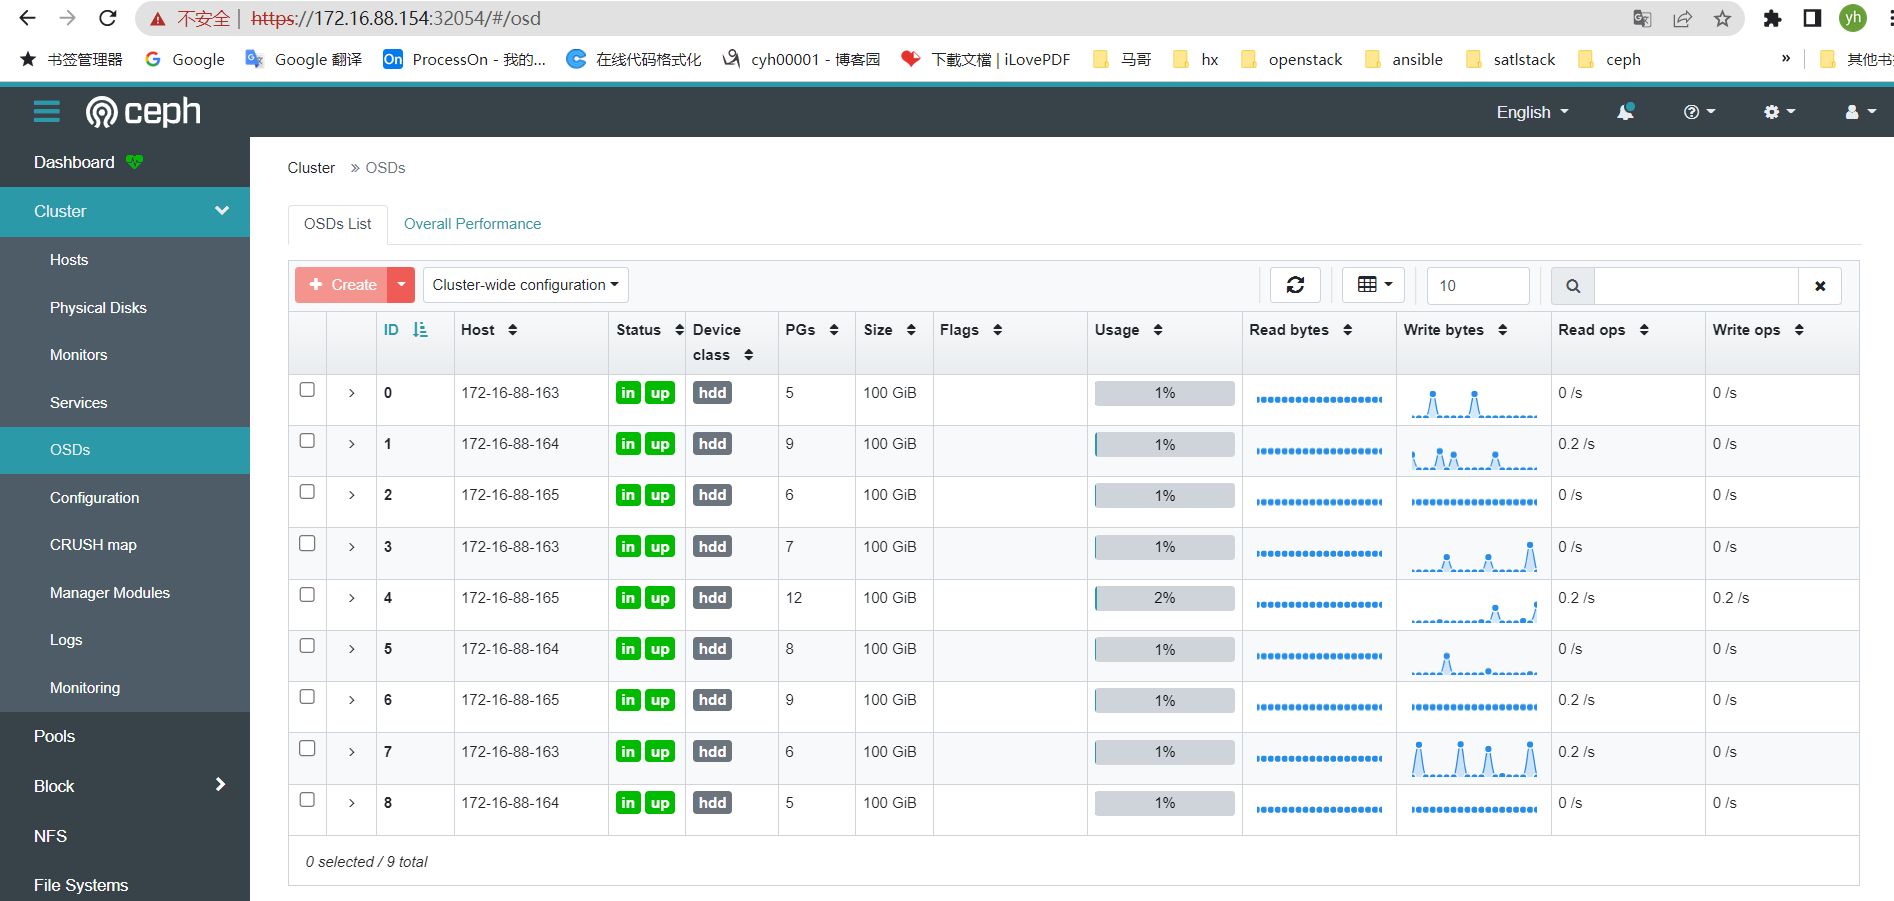
3.2、访问ceph dashboard
3.3、admin账号密码获取
root@easzlab-deploy:~# kubectl -n rook-ceph get secret rook-ceph-dashboard-password -o jsonpath="{['data']['password']}" | base64 --decode && echo
`-E9G!a&s]#jsLK~7Ni_
root@easzlab-deploy:~#
 四、安装kube-prometheus
4.1、下载项目包
注意版本要求
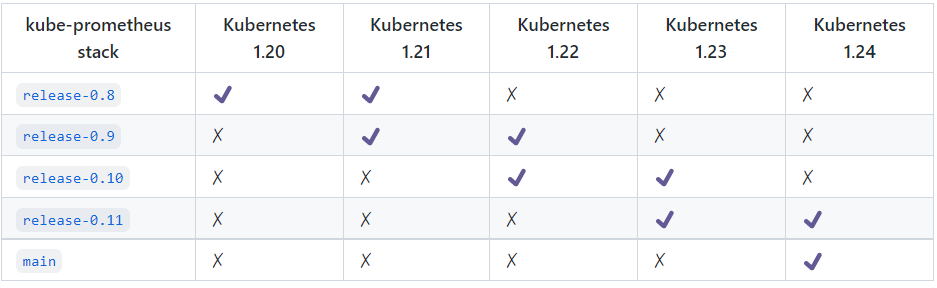
wget https://github.com/prometheus-operator/kube-prometheus/archive/refs/tags/v0.11.0.tar.gz
root@easzlab-deploy:~# tar -xf v0.11.0.tar.gz
root@easzlab-deploy:~# cd kube-prometheus-0.11.0/
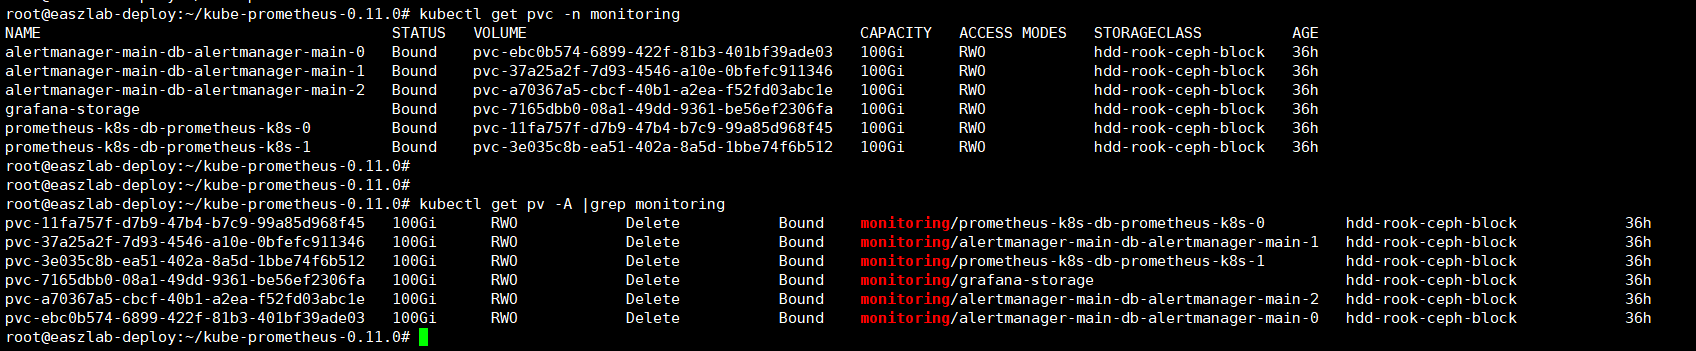
4.2、对grafana、prometheus、altermanger做持久化存储
创建grafana存储pvc
cat grafana-storage-pvc.yaml
apiVersion: v1
kind: Namespace
metadata:
  labels:
    kubernetes.io/metadata.name: monitoring
  name: monitoring

---
apiVersion: v1
kind: PersistentVolumeClaim
metadata:
  name: grafana-storage
  namespace: monitoring
spec:
  accessModes:
  - ReadWriteOnce
  resources:
    requests:
      storage: 100Gi
  storageClassName: hdd-rook-ceph-block
kubectl apply -f grafana-storage-pvc.yaml
4.3、在grafana-deployment.yaml增加存储类
vim manifests/grafana-deployment.yaml
。。。。。。。
   149          serviceAccountName: grafana
   150          volumes:
   151          - name: grafana-storage
   152            persistentVolumeClaim:
   153                claimName: grafana-storage
   154          - name: grafana-datasources
   155            secret:
   156              secretName: grafana-datasources
   157          - configMap:
   158              name: grafana-dashboards
   159            name: grafana-dashboards
   160          - emptyDir:
   161              medium: Memory
。。。。。。。。
vim manifests/prometheus-prometheus.yaml
     1    apiVersion: monitoring.coreos.com/v1
     2    kind: Prometheus
     3    metadata:
     4      labels:
     5        app.kubernetes.io/component: prometheus
     6        app.kubernetes.io/instance: k8s
     7        app.kubernetes.io/name: prometheus
     8        app.kubernetes.io/part-of: kube-prometheus
     9        app.kubernetes.io/version: 2.36.1
    10      name: k8s
    11      namespace: monitoring
    12    spec:
    13      alerting:
    14        alertmanagers:
    15        - apiVersion: v2
    16          name: alertmanager-main
    17          namespace: monitoring
    18          port: web
    19      enableFeatures: []
    20      externalLabels: {}
    21      image: quay.io/prometheus/prometheus:v2.36.1
    22      nodeSelector:
    23        kubernetes.io/os: linux
    24      podMetadata:
    25        labels:
    26          app.kubernetes.io/component: prometheus
    27          app.kubernetes.io/instance: k8s
    28          app.kubernetes.io/name: prometheus
    29          app.kubernetes.io/part-of: kube-prometheus
    30          app.kubernetes.io/version: 2.36.1
    31      podMonitorNamespaceSelector: {}
    32      podMonitorSelector: {}
    33      probeNamespaceSelector: {}
    34      probeSelector: {}
    35      replicas: 2
    36      resources:
    37        requests:
    38          memory: 400Mi
    39      ruleNamespaceSelector: {}
    40      ruleSelector: {}
    41      securityContext:
    42        fsGroup: 2000
    43        runAsNonRoot: true
    44        runAsUser: 1000
    45      serviceAccountName: prometheus-k8s
    46      serviceMonitorNamespaceSelector: {}
    47      serviceMonitorSelector: {}
    48      version: 2.36.1
    49      storage:
    50        volumeClaimTemplate:
    51          spec:
    52            storageClassName: hdd-rook-ceph-block
    53            accessModes: ["ReadWriteOnce"]
    54            resources:
    55              requests:
    56                storage: 100Gi
    57     # retention: 1y
vim manifests/alertmanager-alertmanager.yaml
    1    apiVersion: monitoring.coreos.com/v1
     2    kind: Alertmanager
     3    metadata:
     4      labels:
     5        app.kubernetes.io/component: alert-router
     6        app.kubernetes.io/instance: main
     7        app.kubernetes.io/name: alertmanager
     8        app.kubernetes.io/part-of: kube-prometheus
     9        app.kubernetes.io/version: 0.24.0
    10      name: main
    11      namespace: monitoring
    12    spec:
    13      image: quay.io/prometheus/alertmanager:v0.24.0
    14      nodeSelector:
    15        kubernetes.io/os: linux
    16      podMetadata:
    17        labels:
    18          app.kubernetes.io/component: alert-router
    19          app.kubernetes.io/instance: main
    20          app.kubernetes.io/name: alertmanager
    21          app.kubernetes.io/part-of: kube-prometheus
    22          app.kubernetes.io/version: 0.24.0
    23      replicas: 3
    24      resources:
    25        limits:
    26          cpu: 100m
    27          memory: 100Mi
    28        requests:
    29          cpu: 4m
    30          memory: 100Mi
    31      securityContext:
    32        fsGroup: 2000
    33        runAsNonRoot: true
    34        runAsUser: 1000
    35      serviceAccountName: alertmanager-main
    36      version: 0.24.0
    37      storage:
    38        volumeClaimTemplate:
    39          spec:
    40            storageClassName: hdd-rook-ceph-block
    41            accessModes: ["ReadWriteOnce"]
    42            resources:
    43              requests:
    44                storage: 100Gi
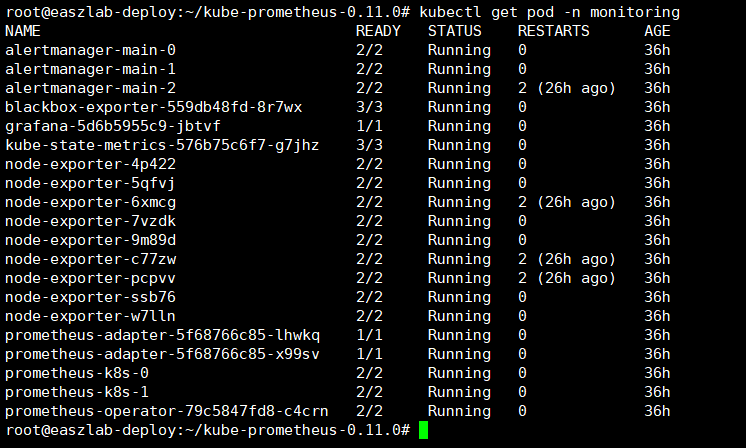
4.4、安装kube-prometheues
root@easzlab-deploy:~/kube-prometheus-0.11.0# kubectl create -f manifests/setup/
root@easzlab-deploy:~/kube-prometheus-0.11.0# kubectl create -f manifests/
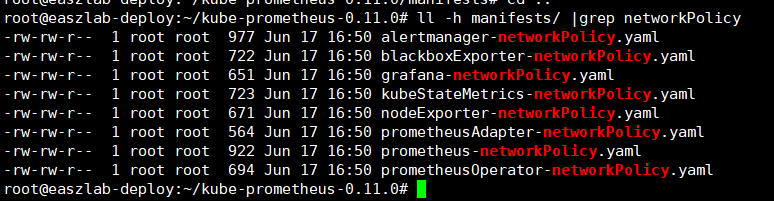
4.5、取消grafana-networkPolicy限制,否则无法通过NodePort本地方访问grafana dashboard界面,有必要也可以取消prometheus、alertmanager
root@easzlab-deploy:~/kube-prometheus-0.11.0# kubectl delete -f manifests/grafana-networkPolicy.yaml
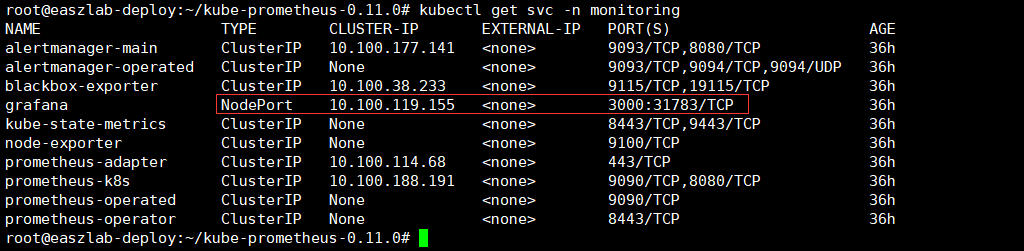
4.6、设置grafana svc NodePort
root@easzlab-deploy:~/kube-prometheus-0.11.0# kubectl edit svc -n monitoring grafana
# Please edit the object below. Lines beginning with a '#' will be ignored,
# and an empty file will abort the edit. If an error occurs while saving this file will be
# reopened with the relevant failures.
#
apiVersion: v1
kind: Service
metadata:
  creationTimestamp: "2022-09-11T03:38:54Z"
  labels:
    app.kubernetes.io/component: grafana
    app.kubernetes.io/name: grafana
    app.kubernetes.io/part-of: kube-prometheus
    app.kubernetes.io/version: 8.5.5
  name: grafana
  namespace: monitoring
  resourceVersion: "9243318"
  uid: 03d092f5-1714-421a-a179-130defc2c8d1
spec:
  clusterIP: 10.100.119.155
  clusterIPs:
  - 10.100.119.155
  externalTrafficPolicy: Cluster
  internalTrafficPolicy: Cluster
  ipFamilies:
  - IPv4
  ipFamilyPolicy: SingleStack
  ports:
  - name: http
    port: 3000
    protocol: TCP
    targetPort: http
  selector:
    app.kubernetes.io/component: grafana
    app.kubernetes.io/name: grafana
    app.kubernetes.io/part-of: kube-prometheus
  sessionAffinity: None
  type: NodePort
status:
  loadBalancer: {}
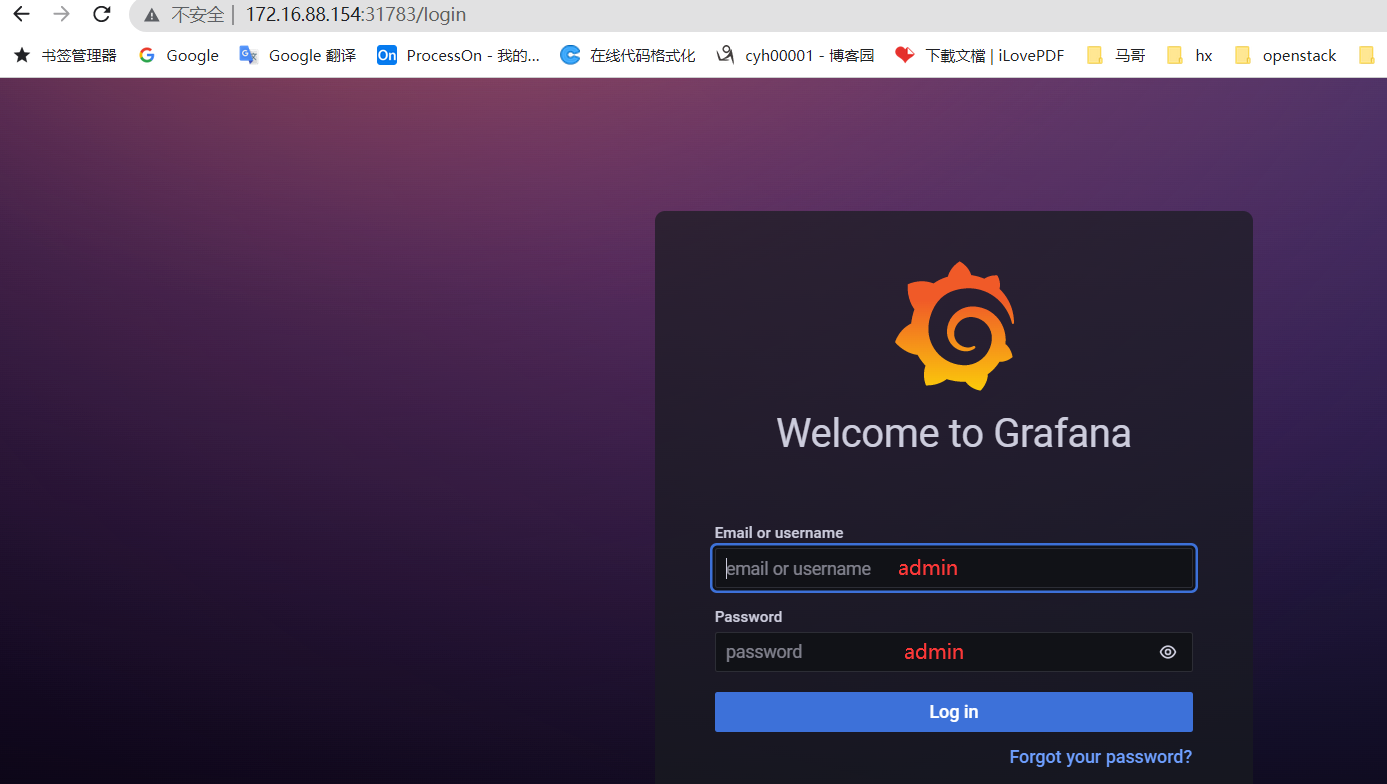
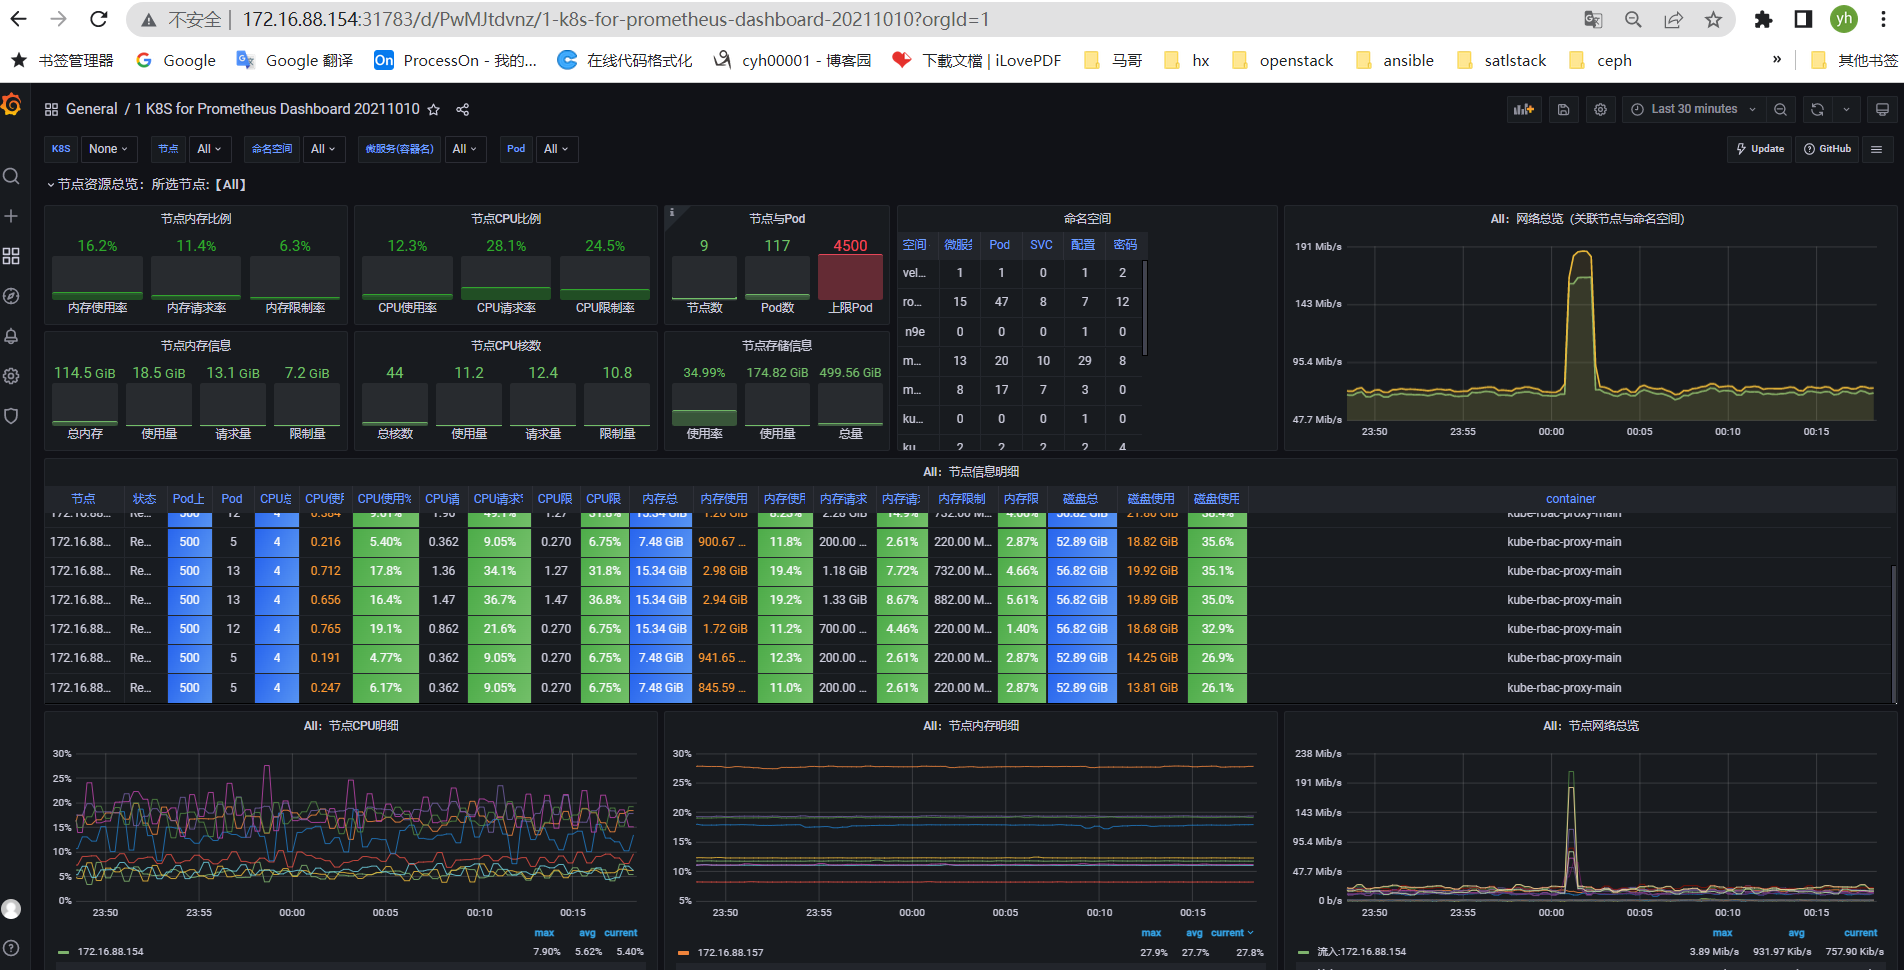
4.7、访问grafana dashboard页面
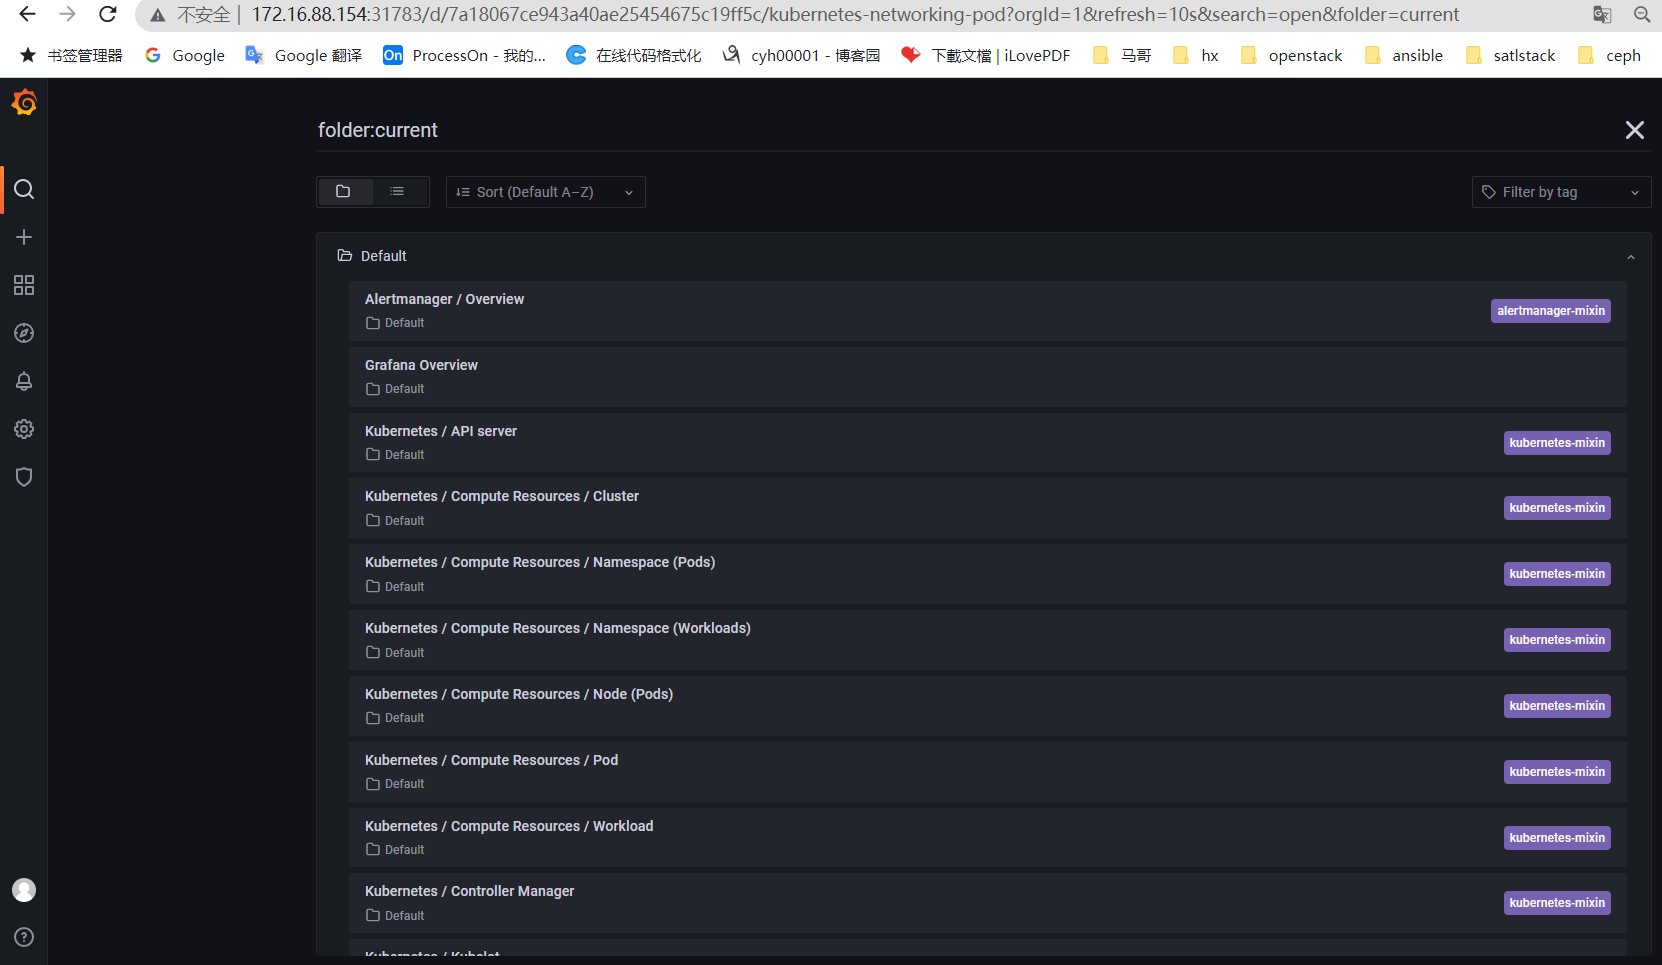
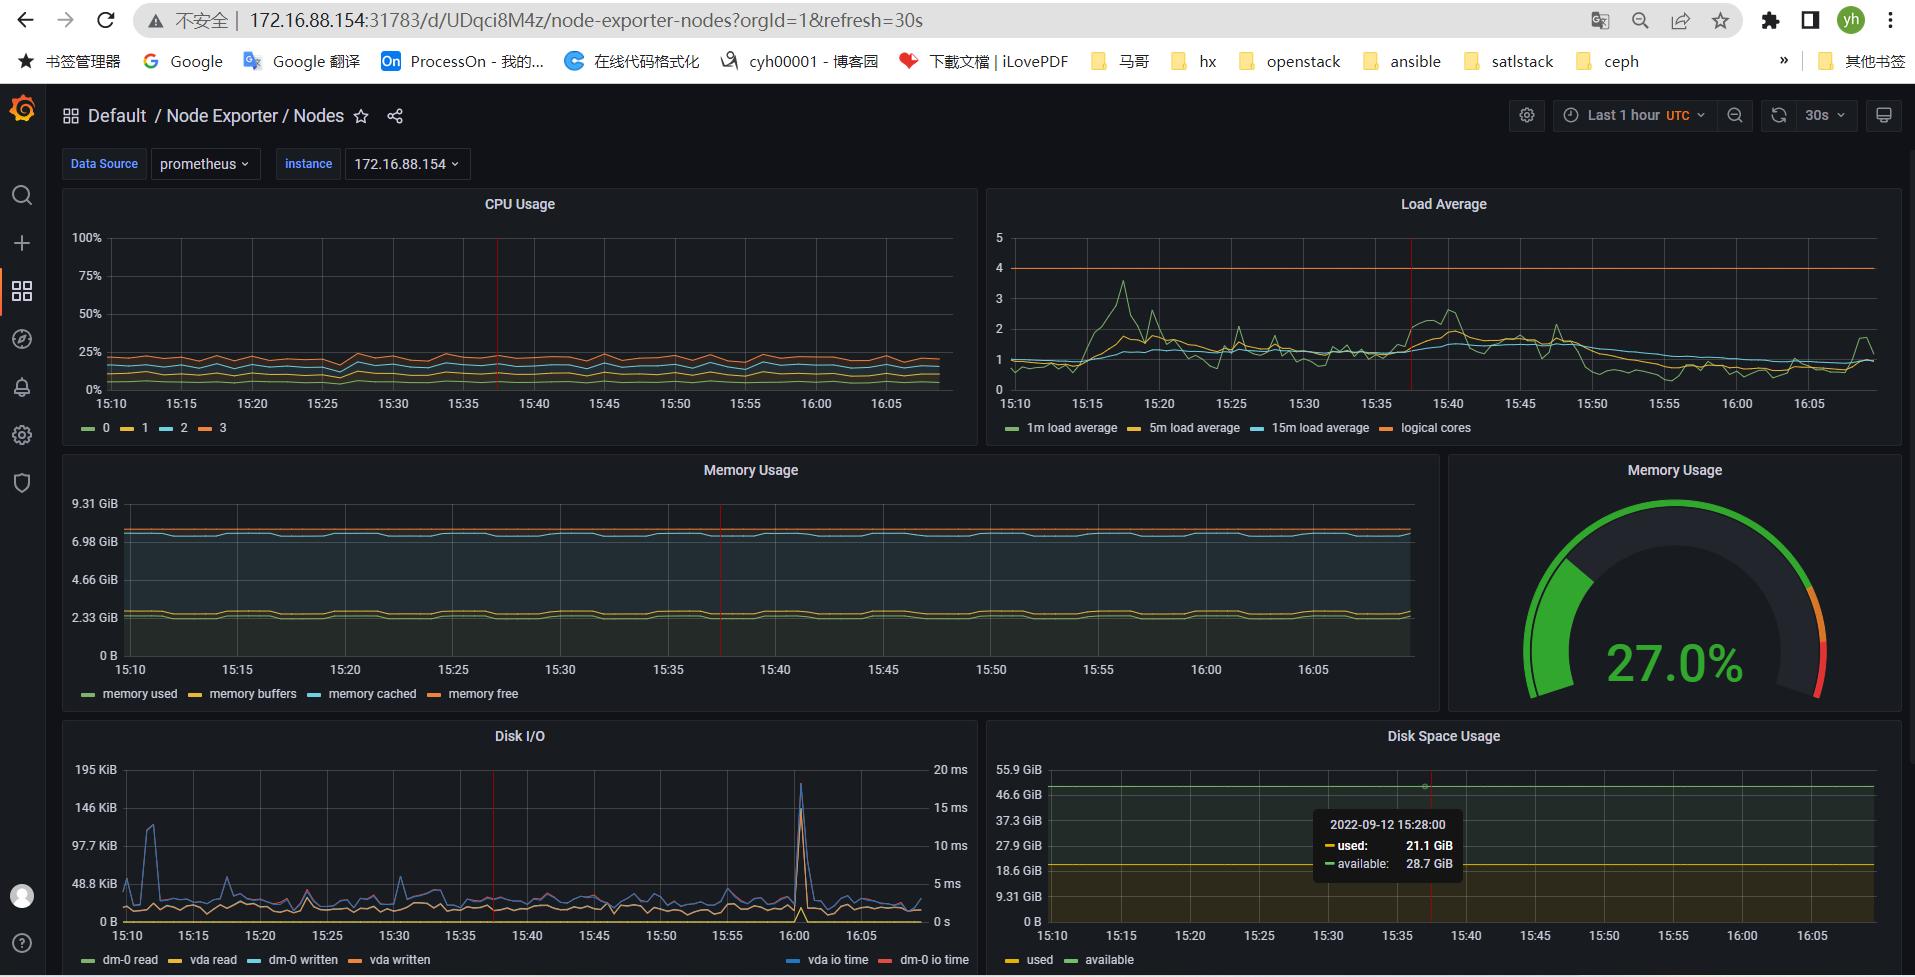
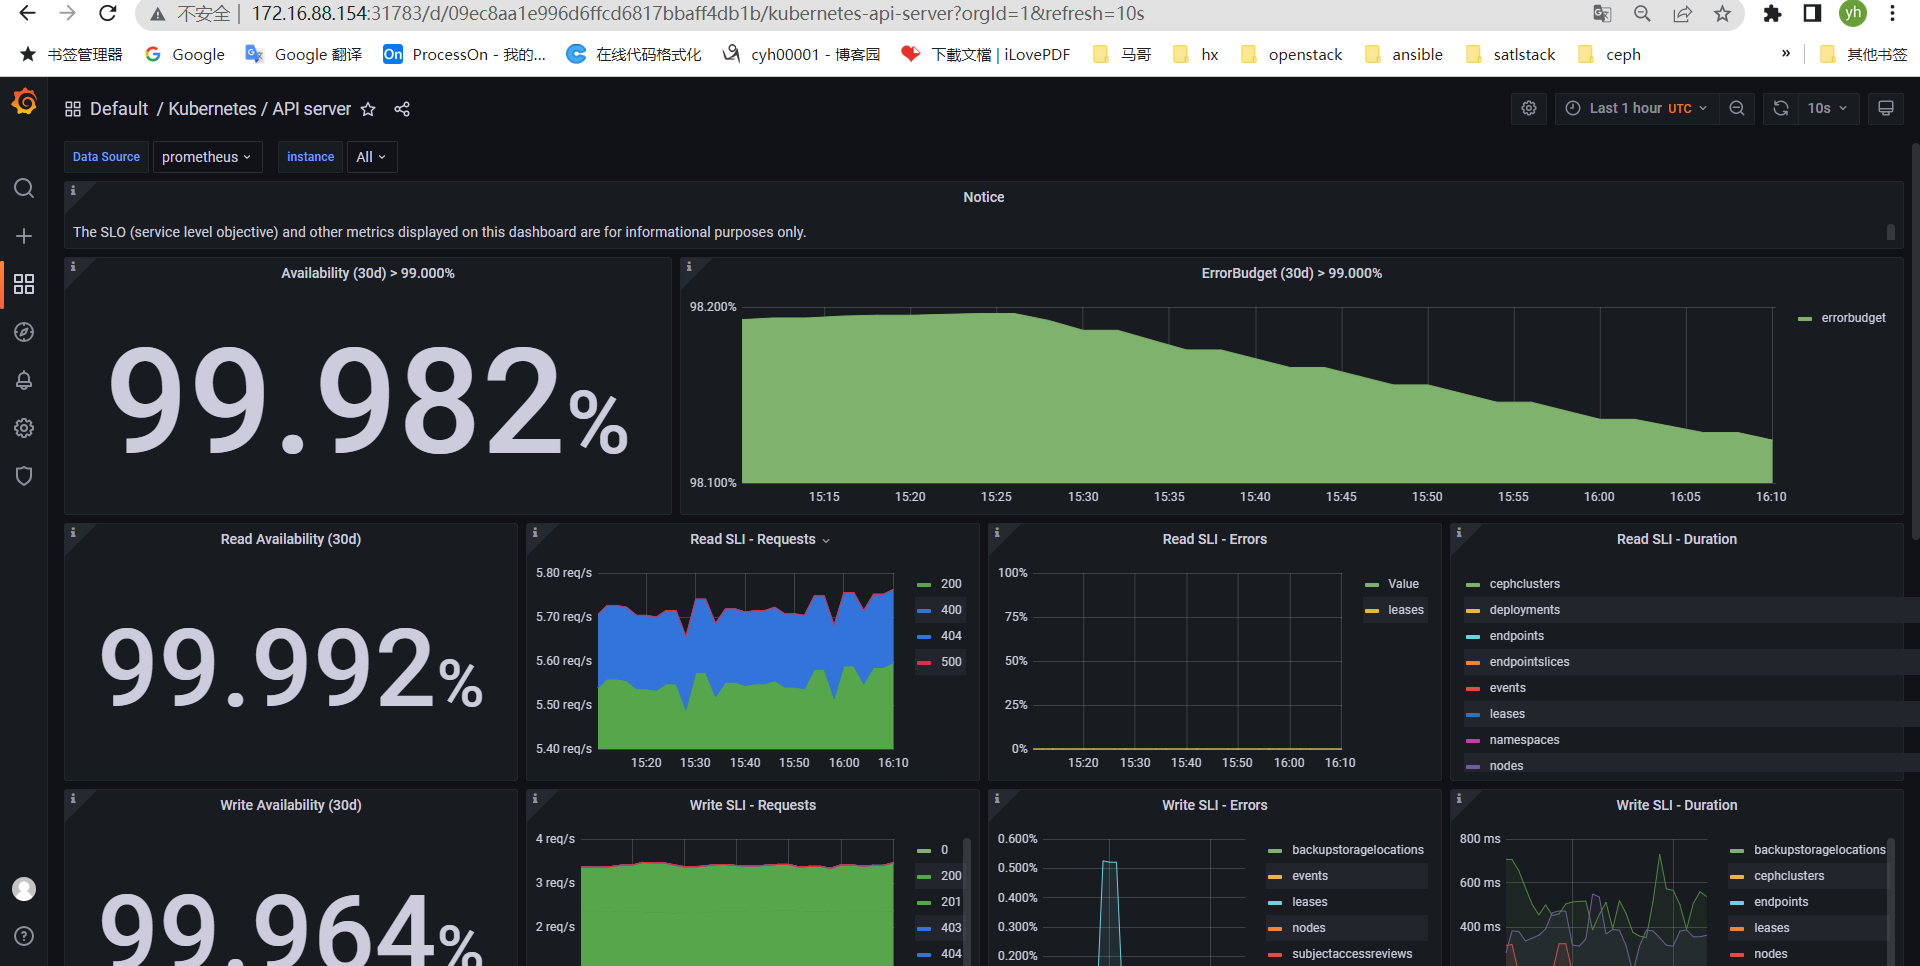
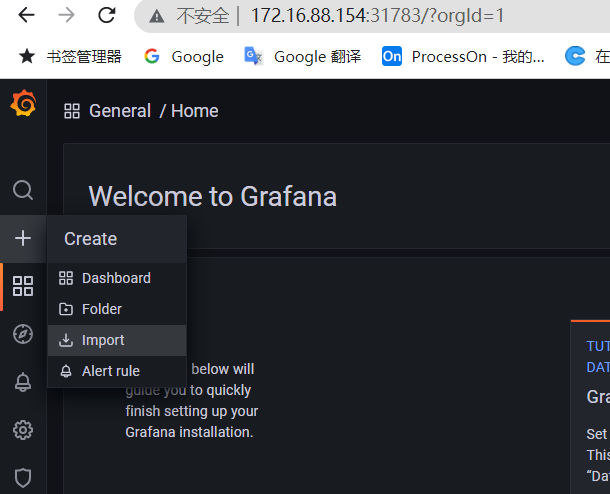
4.8、自定义或者导入监控模板
官方模板地址:https://grafana.com/grafana/dashboards/
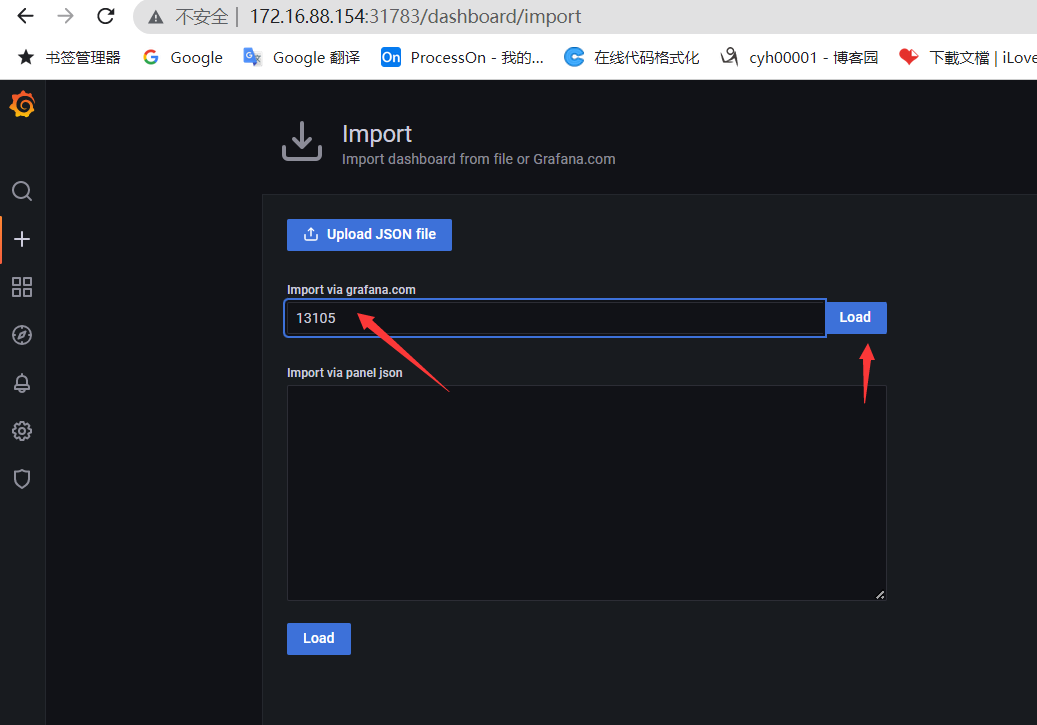
找到合适的监控模板,复制模板id
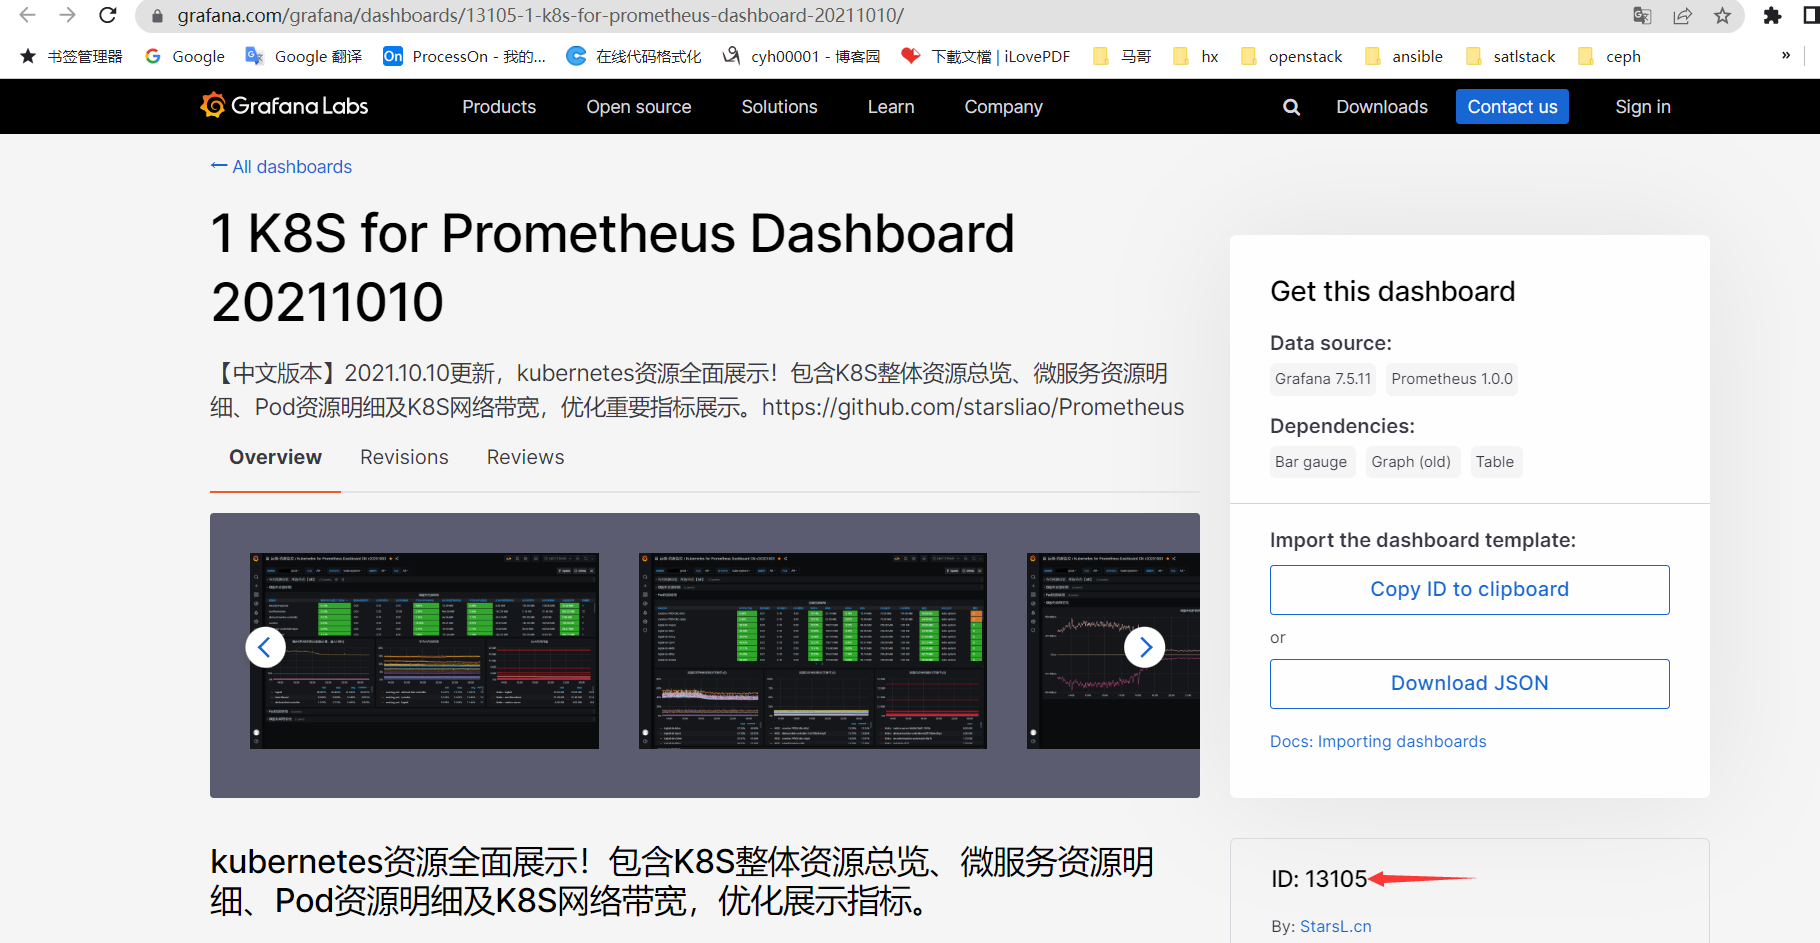
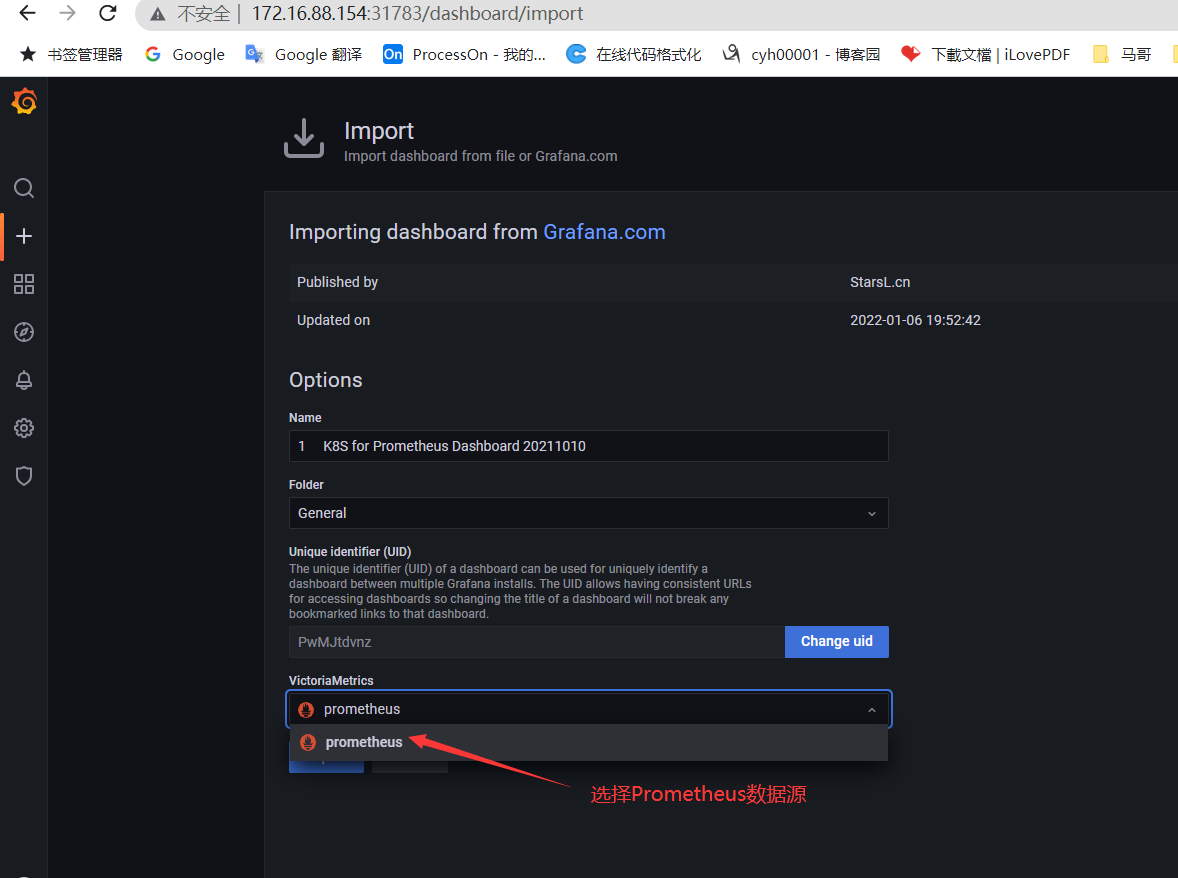
在grafana界面导入该模板
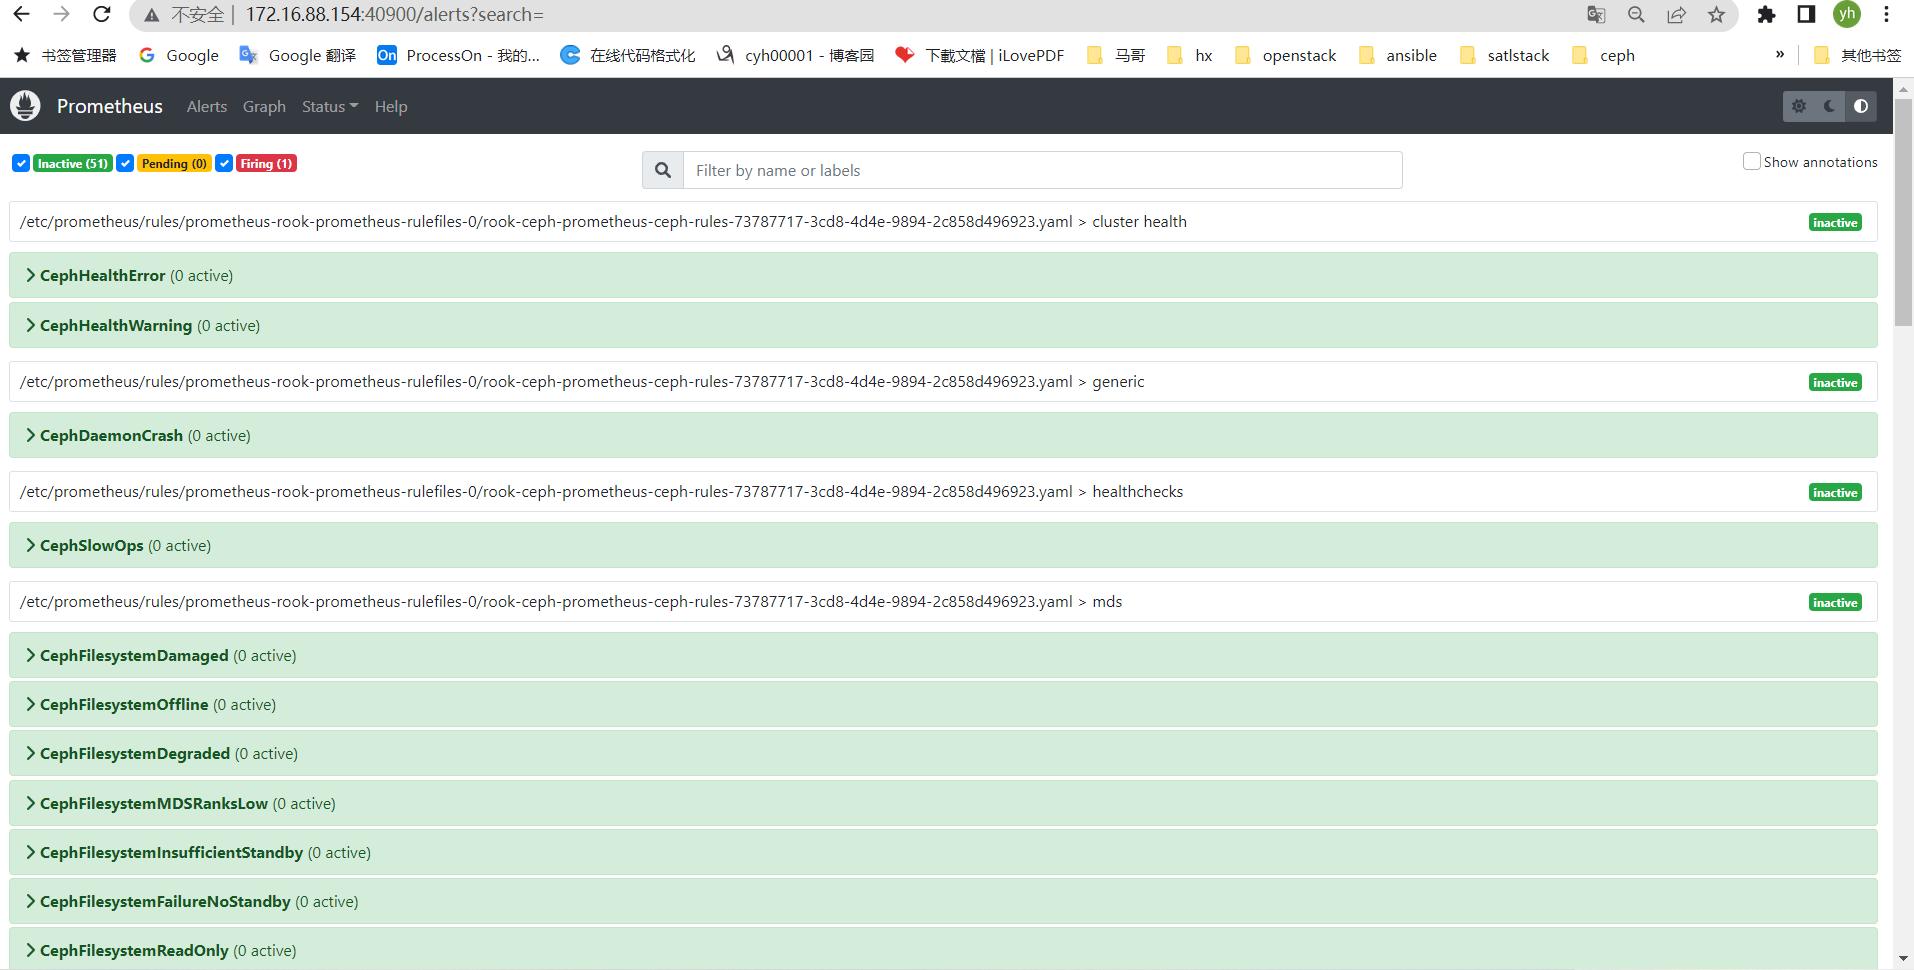
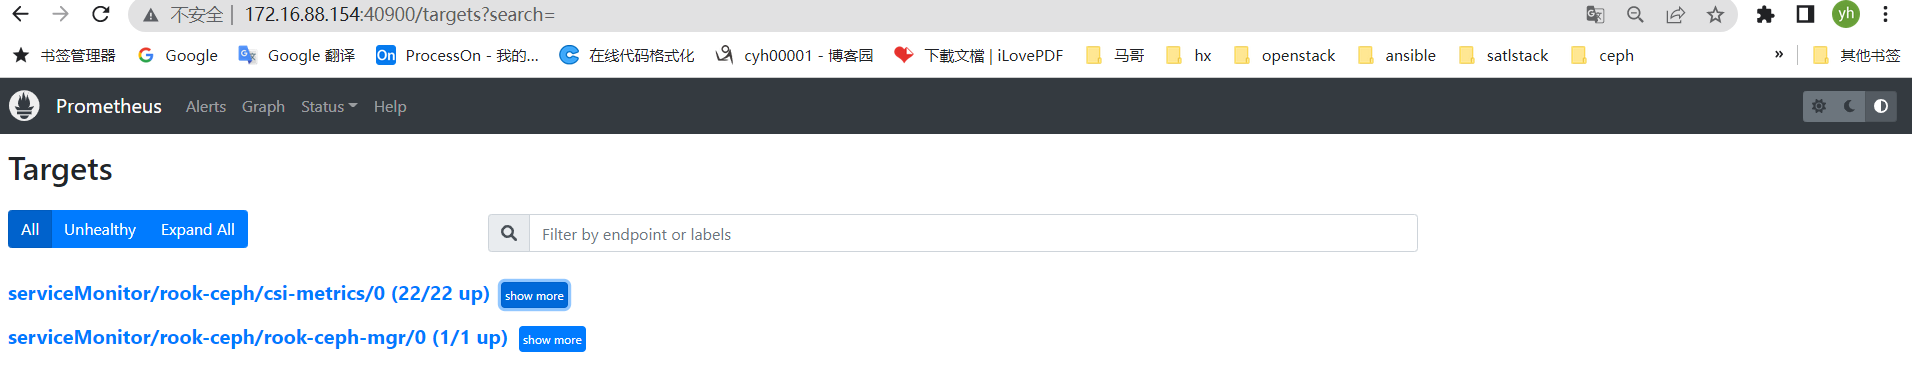
五、监控rook-ceph
安装部署rook-ceph监控
参考文档:https://www.rook.io/docs/rook/v1.9/Storage-Configuration/Monitoring/ceph-monitoring/#prometheus-alerts
root@easzlab-deploy:~/rook-1.9.8/deploy/examples/monitoring# pwd
/root/rook-1.9.8/deploy/examples/monitoring
root@easzlab-deploy:~/rook-1.9.8/deploy/examples/monitoring#
root@easzlab-deploy:~/rook-1.9.8/deploy/examples/monitoring#
root@easzlab-deploy:~/rook-1.9.8/deploy/examples/monitoring# kubectl create -f service-monitor.yaml
servicemonitor.monitoring.coreos.com/rook-ceph-mgr created
root@easzlab-deploy:~/rook-1.9.8/deploy/examples/monitoring#
root@easzlab-deploy:~/rook-1.9.8/deploy/examples/monitoring# kubectl create -f prometheus.yaml
serviceaccount/prometheus created
clusterrole.rbac.authorization.k8s.io/prometheus created
clusterrole.rbac.authorization.k8s.io/prometheus-rules created
clusterrolebinding.rbac.authorization.k8s.io/prometheus created
prometheus.monitoring.coreos.com/rook-prometheus created
root@easzlab-deploy:~/rook-1.9.8/deploy/examples/monitoring#
root@easzlab-deploy:~/rook-1.9.8/deploy/examples/monitoring# kubectl create -f prometheus-service.yaml
service/rook-prometheus created
root@easzlab-deploy:~/rook-1.9.8/deploy/examples/monitoring#
root@easzlab-deploy:~/rook-1.9.8/deploy/examples/monitoring# kubectl create -f rbac.yaml
role.rbac.authorization.k8s.io/rook-ceph-monitor created
rolebinding.rbac.authorization.k8s.io/rook-ceph-monitor created
role.rbac.authorization.k8s.io/rook-ceph-metrics created
rolebinding.rbac.authorization.k8s.io/rook-ceph-metrics created
role.rbac.authorization.k8s.io/rook-ceph-monitor-mgr created
rolebinding.rbac.authorization.k8s.io/rook-ceph-monitor-mgr created
root@easzlab-deploy:~/rook-1.9.8/deploy/examples/monitoring#
root@easzlab-deploy:~/rook-1.9.8/deploy/examples/monitoring# kubectl create -f localrules.yaml
prometheusrule.monitoring.coreos.com/prometheus-ceph-rules created
root@easzlab-deploy:~/rook-1.9.8/deploy/examples/monitoring#
修改/root/rook-1.9.8/deploy/examples/cluster.yaml
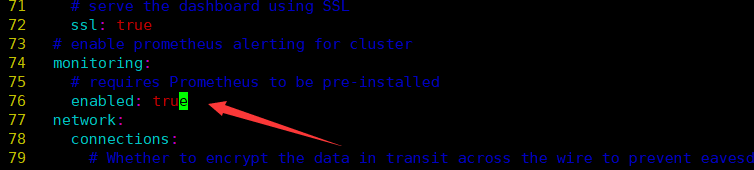
root@easzlab-deploy:~/rook-1.9.8/deploy/examples# kubectl apply -f cluster.yaml
root@easzlab-deploy:~/rook-1.9.8/deploy/examples# kubectl get pod -n rook-ceph
NAME                                                      READY   STATUS      RESTARTS         AGE
csi-cephfsplugin-d2vrl                                    3/3     Running     6 (8d ago)       33d
csi-cephfsplugin-f5pww                                    3/3     Running     3 (31d ago)      33d
csi-cephfsplugin-fnhzm                                    3/3     Running     6 (8d ago)       33d
csi-cephfsplugin-h6hx5                                    3/3     Running     3 (31d ago)      33d
csi-cephfsplugin-kps24                                    3/3     Running     3 (31d ago)      33d
csi-cephfsplugin-lp27f                                    3/3     Running     6 (8d ago)       33d
csi-cephfsplugin-lqnrd                                    3/3     Running     3 (31d ago)      33d
csi-cephfsplugin-provisioner-7b867fbd5f-66zqc             6/6     Running     6 (31d ago)      33d
csi-cephfsplugin-provisioner-7b867fbd5f-6qp92             6/6     Running     6 (31d ago)      33d
csi-cephfsplugin-xvvsc                                    3/3     Running     3 (31d ago)      33d
csi-cephfsplugin-zhlhv                                    3/3     Running     3 (31d ago)      33d
csi-rbdplugin-2lfch                                       3/3     Running     3 (31d ago)      33d
csi-rbdplugin-47264                                       3/3     Running     3 (31d ago)      33d
csi-rbdplugin-5bxrl                                       3/3     Running     6 (8d ago)       33d
csi-rbdplugin-h7vz9                                       3/3     Running     3 (31d ago)      33d
csi-rbdplugin-pnpdr                                       3/3     Running     3 (31d ago)      33d
csi-rbdplugin-provisioner-59fc59c8ff-b8knh                6/6     Running     12 (8d ago)      33d
csi-rbdplugin-provisioner-59fc59c8ff-v8cb8                6/6     Running     6 (31d ago)      33d
csi-rbdplugin-rcbmb                                       3/3     Running     6 (8d ago)       33d
csi-rbdplugin-rntvf                                       3/3     Running     3 (31d ago)      33d
csi-rbdplugin-vvbqz                                       3/3     Running     6 (8d ago)       33d
csi-rbdplugin-z9vs2                                       3/3     Running     3 (31d ago)      33d
prometheus-rook-prometheus-0                              2/2     Running     0                20m
rook-ceph-crashcollector-172.16.88.157-67d49d4c7f-t5xvh   1/1     Running     0                31d
rook-ceph-crashcollector-172.16.88.163-6d5c77d66-fc6ln    1/1     Running     2 (8d ago)       33d
rook-ceph-crashcollector-172.16.88.164-b5685db67-dk9rb    1/1     Running     2 (8d ago)       33d
rook-ceph-crashcollector-172.16.88.165-64d758974d-9w4gj   1/1     Running     2 (8d ago)       33d
rook-ceph-mgr-a-799d564c7f-pf87c                          1/1     Running     0                31d
rook-ceph-mon-b-7448c6ff79-mhtq7                          1/1     Running     4 (41h ago)      33d
rook-ceph-mon-c-659cb46b87-z5k9h                          1/1     Running     1 (31d ago)      33d
rook-ceph-mon-d-7bd477c95b-9k2tv                          1/1     Running     1 (40h ago)      40h
rook-ceph-operator-7f4cc48c84-b68kn                       1/1     Running     3 (8d ago)       33d
rook-ceph-osd-0-8699855f87-g9cvb                          1/1     Running     6 (40h ago)      33d
rook-ceph-osd-1-7df7bdb9dc-cgkbs                          1/1     Running     4 (40h ago)      33d
rook-ceph-osd-2-56897b8df-6hnp7                           1/1     Running     310 (98m ago)    33d
rook-ceph-osd-3-85f7b4c965-wrf5b                          1/1     Running     2 (8d ago)       33d
rook-ceph-osd-4-66d6ff6bc8-2wsfs                          1/1     Running     159 (108m ago)   33d
rook-ceph-osd-5-684f4bdcbd-wd922                          1/1     Running     15 (40h ago)     33d
rook-ceph-osd-6-db4b5699-bnf68                            1/1     Running     212 (106m ago)   33d
rook-ceph-osd-7-d6ccbb9c4-lj7hd                           1/1     Running     6 (40h ago)      33d
rook-ceph-osd-8-5dddc545c6-hblb8                          1/1     Running     6 (40h ago)      33d
rook-ceph-osd-prepare-172.16.88.157-9sxh9                 0/1     Completed   0                13m
rook-ceph-osd-prepare-172.16.88.158-snrqh                 0/1     Completed   0                13m
rook-ceph-osd-prepare-172.16.88.159-p4n2d                 0/1     Completed   0                13m
rook-ceph-osd-prepare-172.16.88.163-q4gvf                 0/1     Completed   0                12m
rook-ceph-osd-prepare-172.16.88.164-5dtnz                 0/1     Completed   0                12m
rook-ceph-osd-prepare-172.16.88.165-sd4zg                 0/1     Completed   0                12m
rook-ceph-tools-74f48bf875-q95x2                          1/1     Running     1 (31d ago)      33d
root@easzlab-deploy:~/rook-1.9.8/deploy/examples#
root@easzlab-deploy:~/rook-1.9.8/deploy/examples#
root@easzlab-deploy:~/rook-1.9.8/deploy/examples# kubectl get svc -n rook-ceph
NAME                                     TYPE        CLUSTER-IP       EXTERNAL-IP   PORT(S)             AGE
csi-cephfsplugin-metrics                 ClusterIP   10.100.191.206   <none>        8080/TCP,8081/TCP   33d
csi-rbdplugin-metrics                    ClusterIP   10.100.99.174    <none>        8080/TCP,8081/TCP   33d
prometheus-operated                      ClusterIP   None             <none>        9090/TCP            20m
rook-ceph-mgr                            ClusterIP   10.100.119.113   <none>        9283/TCP            33d
rook-ceph-mgr-dashboard                  ClusterIP   10.100.36.173    <none>        8443/TCP            33d
rook-ceph-mgr-dashboard-external-https   NodePort    10.100.30.237    <none>        8443:32054/TCP      33d
rook-ceph-mon-b                          ClusterIP   10.100.169.155   <none>        6789/TCP,3300/TCP   33d
rook-ceph-mon-c                          ClusterIP   10.100.192.111   <none>        6789/TCP,3300/TCP   33d
rook-ceph-mon-d                          ClusterIP   10.100.30.129    <none>        6789/TCP,3300/TCP   40h
rook-prometheus                          NodePort    10.100.90.76     <none>        9090:40900/TCP      19m
root@easzlab-deploy:~/rook-1.9.8/deploy/examples#
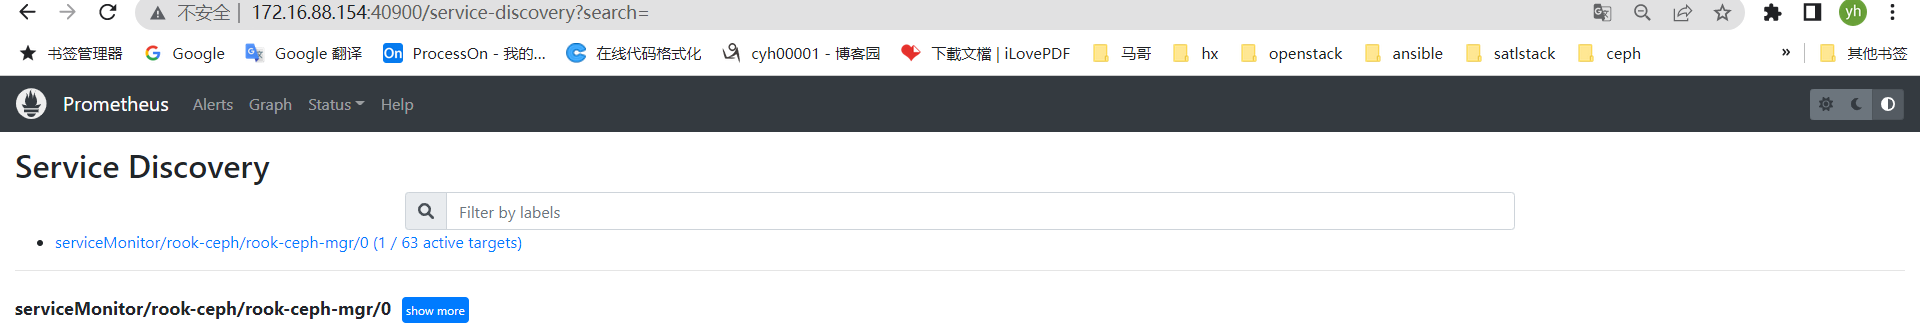
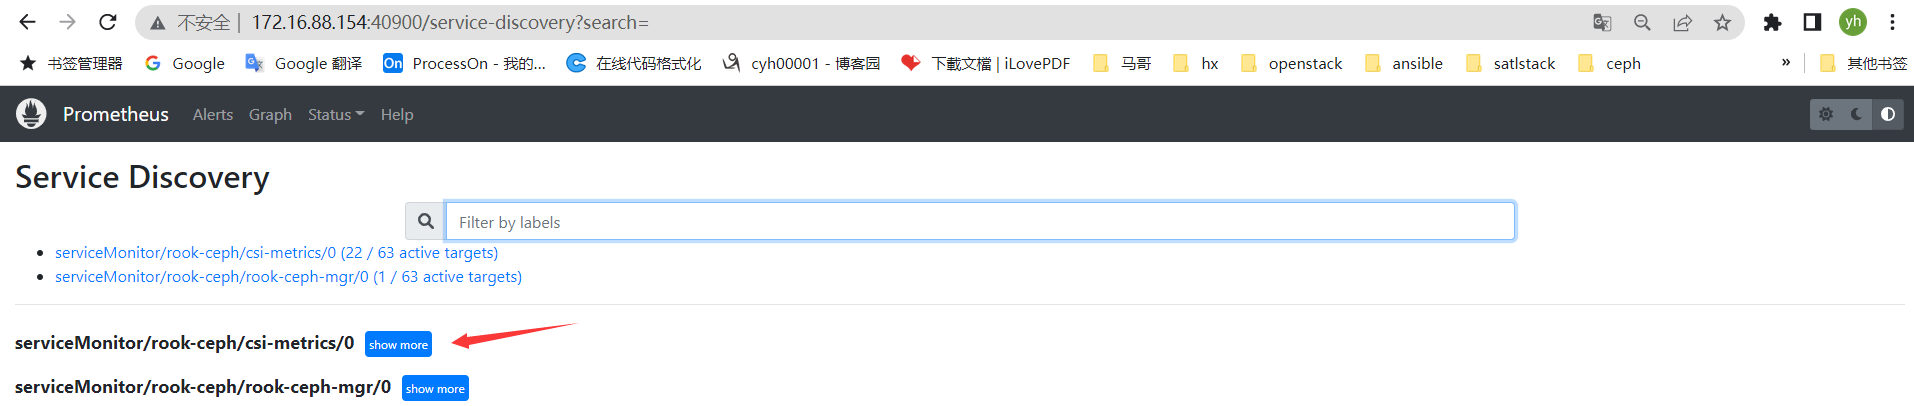
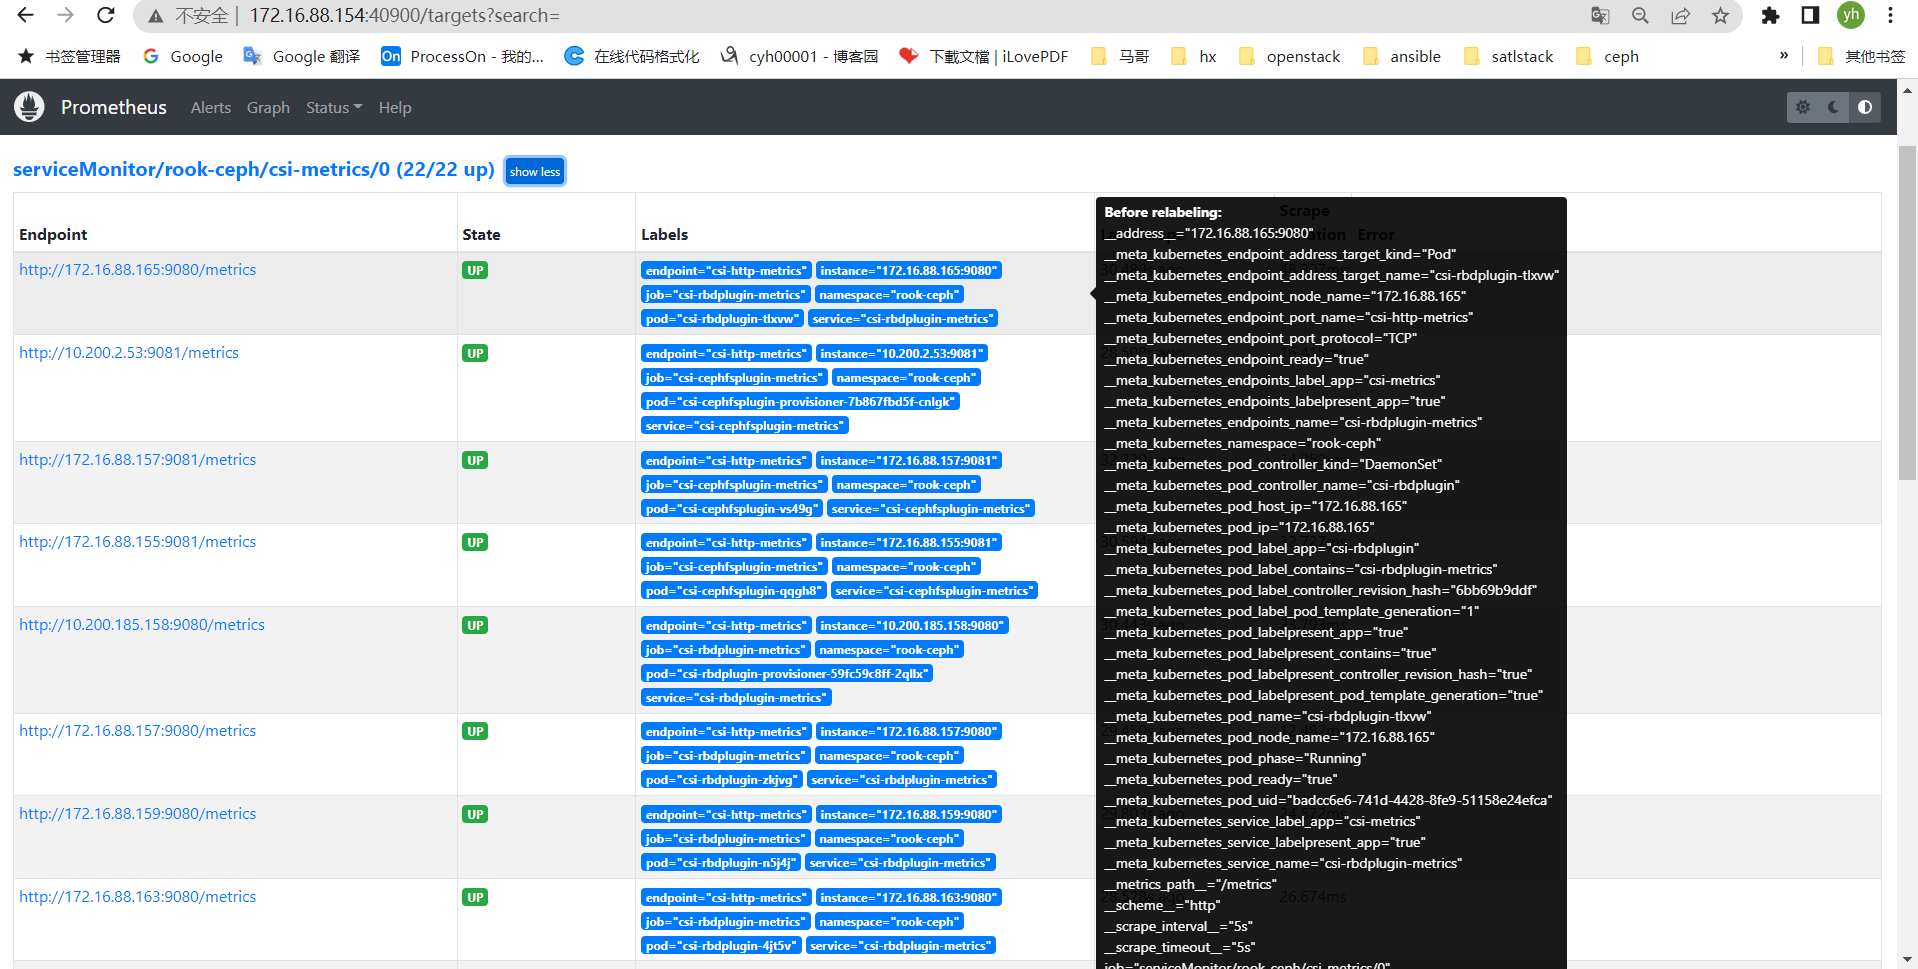
开启csi-http-metrics监控
cat csi-metrics-service-monitor.yaml
---
apiVersion: monitoring.coreos.com/v1
kind: ServiceMonitor
metadata:
  name: csi-metrics
  namespace: rook-ceph
  labels:
    team: rook
spec:
  namespaceSelector:
    matchNames:
      - rook-ceph
  selector:
    matchLabels:
      app: csi-metrics
  endpoints:
    - port: csi-http-metrics
      path: /metrics
      interval: 5s
    # comment csi-grpc-metrics related information if csi grpc metrics is not enabled
    #    - port: csi-grpc-metrics
    #  path: /metrics
    #  interval: 5s
kubectl apply -f csi-metrics-service-monitor.yaml
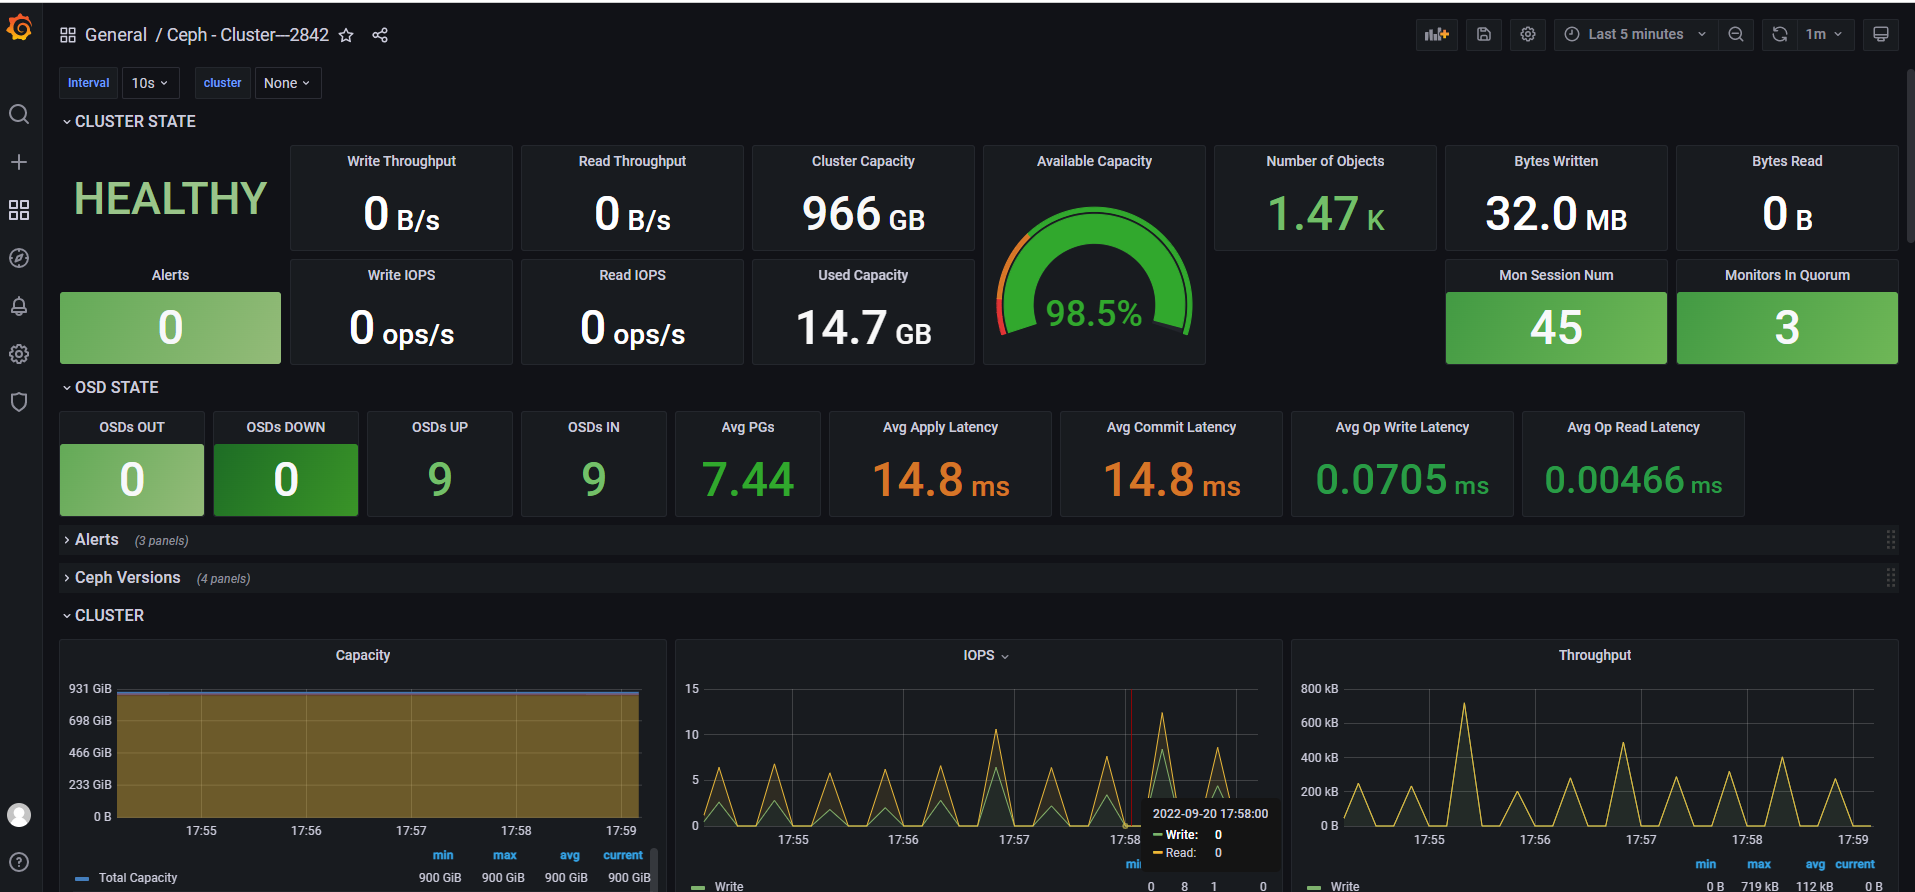
导入grafana监控模板
Ceph - 集群 ----2842 https://grafana.com/grafana/dashboards/2842-ceph-cluster/
Ceph - OSD(单)--- 5336 https://grafana.com/grafana/dashboards/5336-ceph-osd-single/
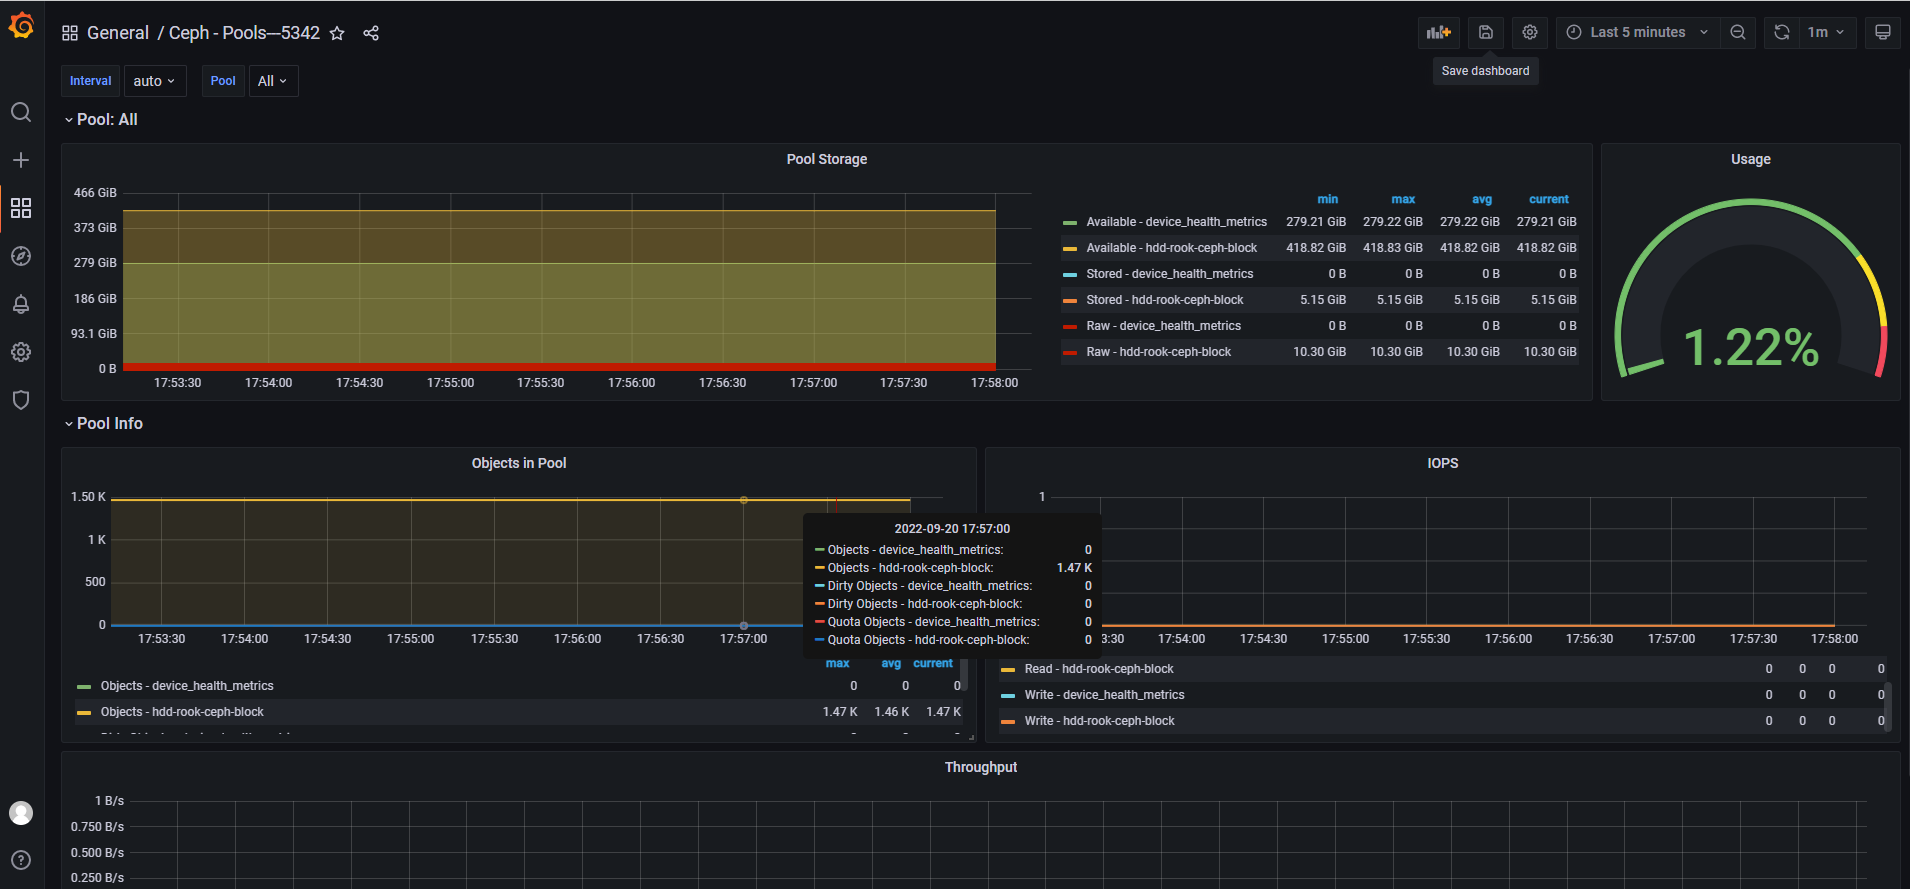
Ceph - 池---5342 https://grafana.com/grafana/dashboards/5342-ceph-pools/
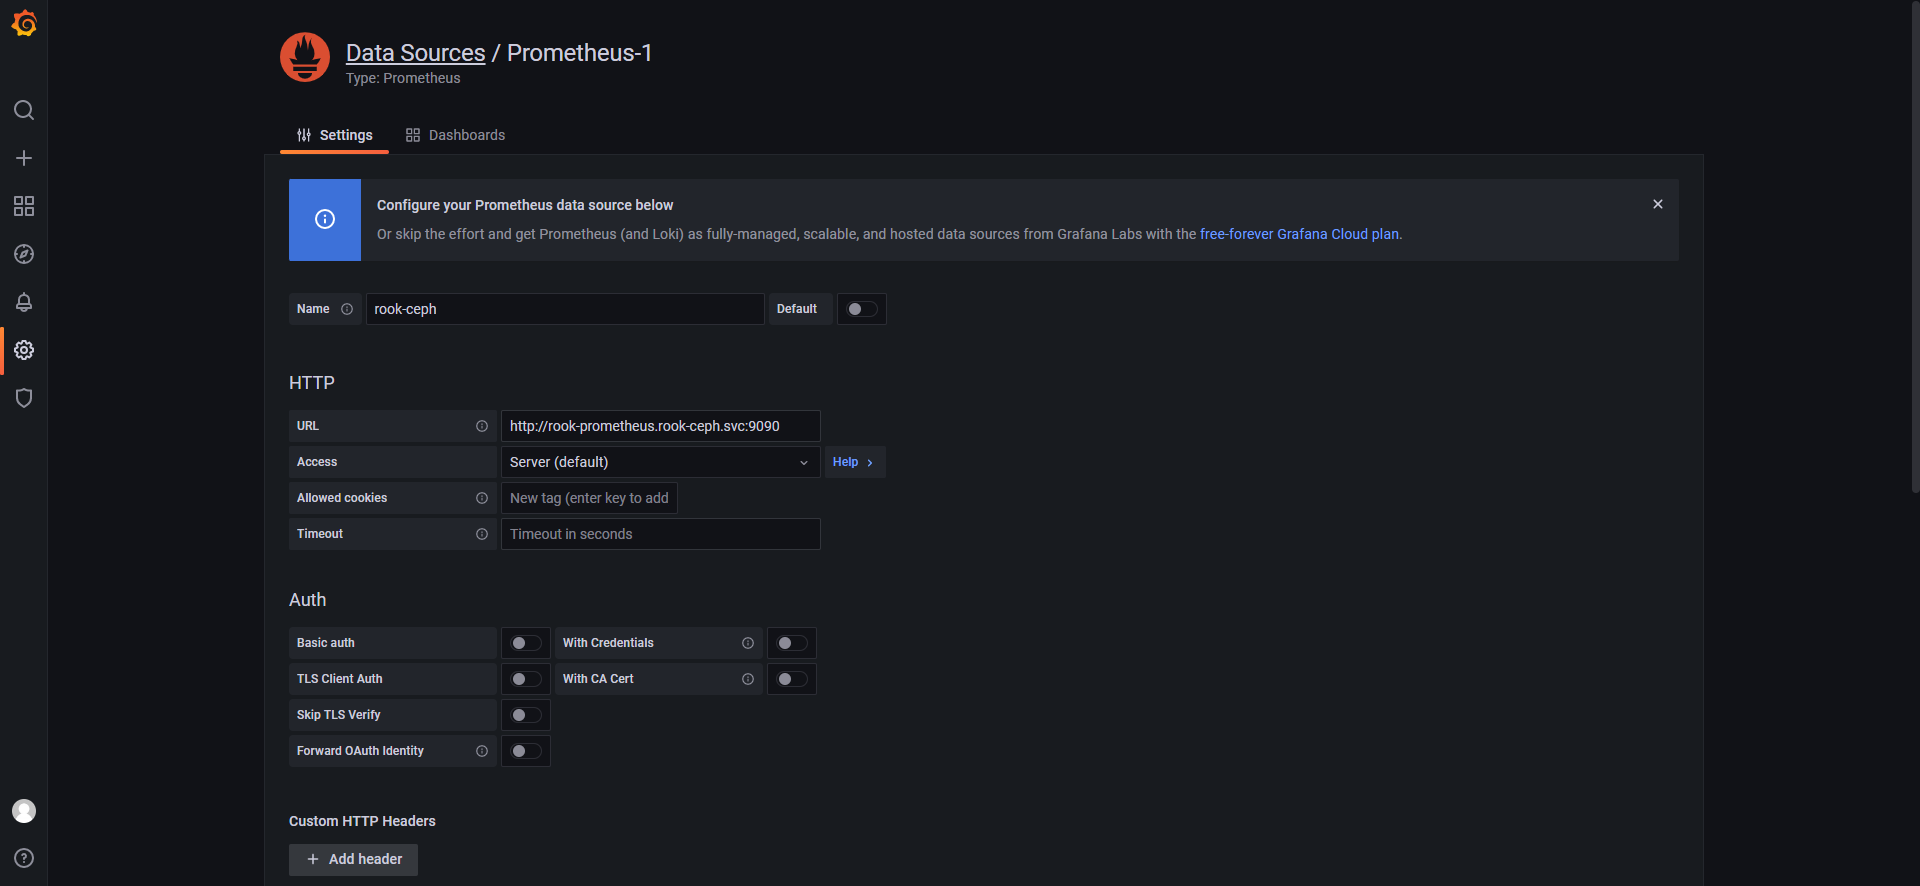
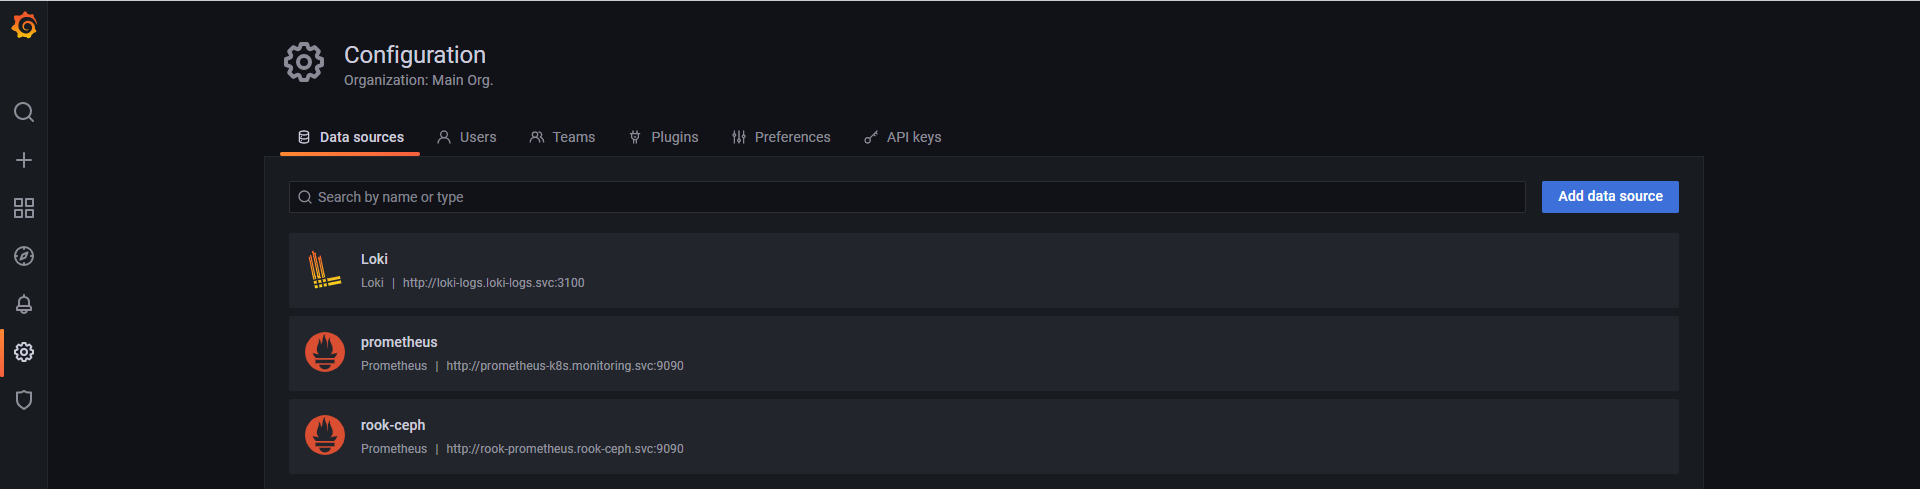
添加数据源


【推荐】国内首个AI IDE,深度理解中文开发场景,立即下载体验Trae
【推荐】编程新体验,更懂你的AI,立即体验豆包MarsCode编程助手
【推荐】抖音旗下AI助手豆包,你的智能百科全书,全免费不限次数
【推荐】轻量又高性能的 SSH 工具 IShell:AI 加持,快人一步
· TypeScript + Deepseek 打造卜卦网站:技术与玄学的结合
· 阿里巴巴 QwQ-32B真的超越了 DeepSeek R-1吗?
· 如何调用 DeepSeek 的自然语言处理 API 接口并集成到在线客服系统
· 【译】Visual Studio 中新的强大生产力特性
· 2025年我用 Compose 写了一个 Todo App