
sealos方式部署kubernetes+kube-prometheus+rook-ceph高可用集群
一、环境准备
1.1、推荐配置
master节点:4vcpu 8G 50G
node节点:8vcpu 16G 50G
ceph节点:4vcpu 8G 50GB+3*100GB
1.2、准备一台ansible节点作为部署机器,方便拷贝文件
cat name.yml --- - hosts: vm1 remote_user: root tasks: - name: change name raw: "echo {{hostname|quote}} > /etc/hostname" - name: shell: hostname {{hostname|quote}}
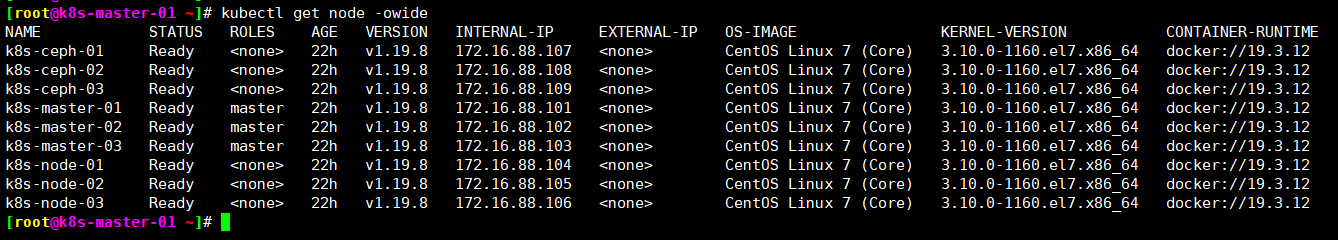
配置ansible hosts 虚机组别信息 [root@ansible ~]# cat /etc/ansible/hosts [vm1] #10.202.10.180 hostname=dc-kvm-dba-mongodb-pro-28 ansible_ssh_port=22 ansible_ssh_pass=gzymkj 172.16.88.101 hostname=k8s-master-01 ansible_ssh_port=22 ansible_ssh_pass=redhat 172.16.88.102 hostname=k8s-master-02 ansible_ssh_port=22 ansible_ssh_pass=redhat 172.16.88.103 hostname=k8s-master-03 ansible_ssh_port=22 ansible_ssh_pass=redhat 172.16.88.104 hostname=k8s-node-01 ansible_ssh_port=22 ansible_ssh_pass=redhat 172.16.88.105 hostname=k8s-node-02 ansible_ssh_port=22 ansible_ssh_pass=redhat 172.16.88.106 hostname=k8s-node-03 ansible_ssh_port=22 ansible_ssh_pass=redhat 172.16.88.107 hostname=k8s-ceph-01 ansible_ssh_port=22 ansible_ssh_pass=redhat 172.16.88.108 hostname=k8s-ceph-02 ansible_ssh_port=22 ansible_ssh_pass=redhat 172.16.88.109 hostname=k8s-ceph-03 ansible_ssh_port=22 ansible_ssh_pass=redhat [vm] 172.16.88.[101:109] #172.16.88.[111:116] [root@ansible ~]#
批量修改主机名 [root@ansible ~]# ansible-playbook ./name.yml
批量修改虚机hosts [root@ansible ~]# cat base.sh iptables -F && iptables -X && iptables -Z systemctl stop firewalld && systemctl disable firewalld getenforce 0 sed -i "s/SELINUX=enforcing/SELINUX=disabled/g" /etc/selinux/config cat > /etc/hosts <<EOF 127.0.0.1 localhost localhost.localdomain localhost4 localhost4.localdomain4 ::1 localhost localhost.localdomain localhost6 localhost6.localdomain6 172.16.88.101 k8s-master-01 172.16.88.102 k8s-master-02 172.16.88.103 k8s-master-03 172.16.88.104 k8s-node-01 172.16.88.105 k8s-node-02 172.16.88.106 k8s-node-03 172.16.88.107 k8s-ceph-01 172.16.88.108 k8s-ceph-02 172.16.88.109 k8s-ceph-03 EOF cat > /etc/chrony.conf <<EOF server ntp.aliyun.com iburst stratumweight 0 driftfile /var/lib/chrony/drift rtcsync makestep 10 3 bindcmdaddress 127.0.0.1 bindcmdaddress ::1 keyfile /etc/chrony.keys commandkey 1 generatecommandkey logchange 0.5 logdir /var/log/chrony EOF systemctl restart chronyd && systemctl enable chronyd [root@ansible ~]# [root@ansible ~]# ansible 'vm' -m script -a "./base.sh"
二、通过sealos工具安装k8s集群
2.1、下载sealos 3.3.9工具
sealos github地址:https://github.com/labring/sealos/tree/release-v3.3.9#readme
# 下载并安装sealos
# wget -c https://sealyun-home.oss-cn-beijing.aliyuncs.com/sealos/latest/sealos && \
chmod +x sealos && mv sealos /usr/bin

离线安装包下载
https://pan.baidu.com/share/init?surl=fu_l8yL_K6BLpSIugKhvAg&pwd=47f5 #本环境选择kube1.19.8.tar.gz

通过sealos安装k8s集群
sealos init --passwd 'redhat'  \
--master 172.16.88.101 \
--master 172.16.88.102 \
--master 172.16.88.103 \
--node 172.16.88.104 \
--node 172.16.88.105 \
--node 172.16.88.106 \
--node 172.16.88.107 \
--node 172.16.88.108 \
--node 172.16.88.109 \
--user root --version v1.19.8 \
--pkg-url=/root/kube1.19.8.tar.gz
[root@k8s-master-01 ~]# kubectl get pod -n kube-system
NAME                                       READY   STATUS    RESTARTS   AGE
calico-kube-controllers-69b47f4dfb-42scb   1/1     Running   0          3d19h
calico-node-29lbv                          1/1     Running   0          3d19h
calico-node-45t8k                          1/1     Running   0          3d19h
calico-node-74sl5                          1/1     Running   0          3d19h
calico-node-fl2m8                          1/1     Running   0          3d19h
calico-node-lczd6                          1/1     Running   0          3d19h
calico-node-nrcz9                          1/1     Running   0          3d19h
calico-node-p25bb                          1/1     Running   0          3d19h
calico-node-q6f85                          1/1     Running   0          3d19h
calico-node-xp2xx                          1/1     Running   0          3d19h
coredns-f9fd979d6-5f4ds                    1/1     Running   0          3d19h
coredns-f9fd979d6-nhcz9                    1/1     Running   0          3d19h
etcd-k8s-master-01                         1/1     Running   0          3d19h
etcd-k8s-master-02                         1/1     Running   0          3d19h
etcd-k8s-master-03                         1/1     Running   0          3d19h
kube-apiserver-k8s-master-01               1/1     Running   0          3d19h
kube-apiserver-k8s-master-02               1/1     Running   0          3d19h
kube-apiserver-k8s-master-03               1/1     Running   0          3d19h
kube-controller-manager-k8s-master-01      1/1     Running   2          3d19h
kube-controller-manager-k8s-master-02      1/1     Running   2          3d19h
kube-controller-manager-k8s-master-03      1/1     Running   2          3d19h
kube-proxy-6smtq                           1/1     Running   0          3d19h
kube-proxy-grwxk                           1/1     Running   0          3d19h
kube-proxy-j6d7k                           1/1     Running   0          3d19h
kube-proxy-ksnhd                           1/1     Running   0          3d19h
kube-proxy-p2k59                           1/1     Running   0          3d19h
kube-proxy-pgxnh                           1/1     Running   0          3d19h
kube-proxy-s2kd6                           1/1     Running   0          3d19h
kube-proxy-xmvch                           1/1     Running   0          3d19h
kube-proxy-z54qk                           1/1     Running   0          3d19h
kube-scheduler-k8s-master-01               1/1     Running   1          3d19h
kube-scheduler-k8s-master-02               1/1     Running   0          3d19h
kube-scheduler-k8s-master-03               1/1     Running   2          3d19h
kube-sealyun-lvscare-k8s-ceph-01           1/1     Running   0          3d19h
kube-sealyun-lvscare-k8s-ceph-02           1/1     Running   0          3d19h
kube-sealyun-lvscare-k8s-ceph-03           1/1     Running   0          3d19h
kube-sealyun-lvscare-k8s-node-01           1/1     Running   0          3d19h
kube-sealyun-lvscare-k8s-node-02           1/1     Running   0          3d19h
kube-sealyun-lvscare-k8s-node-03           1/1     Running   0          3d19h
[root@k8s-master-01 ~]#
2.2、安装rook-ceph
下载安装包
wget https://github.com/rook/rook/archive/refs/tags/v1.8.10.tar.gz
tar -xvzf v1.8.10.tar.gz
cd rook-1.8.10/deploy/examples/

安装
# kubectl create -f crds.yaml -f common.yaml -f operator.yaml
# kubectl create -f cluster.yaml
[root@k8s-master-01 ~]# kubectl get pod -n rook-ceph
NAME                                                    READY   STATUS      RESTARTS   AGE
csi-cephfsplugin-7grct                                  3/3     Running     0          3d19h
csi-cephfsplugin-7trv4                                  3/3     Running     0          3d19h
csi-cephfsplugin-lb5zg                                  3/3     Running     0          3d19h
csi-cephfsplugin-n569t                                  3/3     Running     0          3d19h
csi-cephfsplugin-provisioner-6d4bd9b669-4j4b9           6/6     Running     4          3d19h
csi-cephfsplugin-provisioner-6d4bd9b669-9pbpt           6/6     Running     9          3d19h
csi-cephfsplugin-vmrxm                                  3/3     Running     0          3d19h
csi-cephfsplugin-w94tz                                  3/3     Running     0          3d19h
csi-rbdplugin-cgkqw                                     3/3     Running     0          3d19h
csi-rbdplugin-drdrf                                     3/3     Running     0          3d19h
csi-rbdplugin-g6pj8                                     3/3     Running     0          3d19h
csi-rbdplugin-gd6q4                                     3/3     Running     0          3d19h
csi-rbdplugin-provisioner-6bcd78bb89-7mch4              6/6     Running     8          3d19h
csi-rbdplugin-provisioner-6bcd78bb89-fr6gc              6/6     Running     2          3d19h
csi-rbdplugin-s6q2b                                     3/3     Running     0          3d19h
csi-rbdplugin-sj85z                                     3/3     Running     0          3d19h
rook-ceph-crashcollector-k8s-ceph-01-764696896d-gv9b4   1/1     Running     0          3d19h
rook-ceph-crashcollector-k8s-ceph-02-66cdd4766f-rjmw6   1/1     Running     0          3d19h
rook-ceph-crashcollector-k8s-ceph-03-7bfc9f7886-xzttd   1/1     Running     0          3d19h
rook-ceph-crashcollector-k8s-node-02-84cb7dc68f-s2cfb   1/1     Running     0          3d19h
rook-ceph-crashcollector-k8s-node-03-79fbc7f784-5lrnt   1/1     Running     0          3d19h
rook-ceph-mgr-a-f694765d4-6bkjl                         1/1     Running     0          3d19h
rook-ceph-mon-a-7597d6fc57-8wx2j                        1/1     Running     0          3d19h
rook-ceph-mon-b-5fbd44fd56-z9z5q                        1/1     Running     0          3d19h
rook-ceph-mon-c-56cbd5d54b-blxcg                        1/1     Running     0          3d19h
rook-ceph-operator-57c548c785-ps6zh                     1/1     Running     0          3d19h
rook-ceph-osd-0-6987c7cd9b-fg9bs                        1/1     Running     0          3d19h
rook-ceph-osd-1-5bcf547b58-p74sw                        1/1     Running     0          3d19h
rook-ceph-osd-2-6978b8fb7f-6d7vw                        1/1     Running     0          3d19h
rook-ceph-osd-3-76f59c8f59-lm6f6                        1/1     Running     0          3d19h
rook-ceph-osd-4-54cbd6cf75-9k5lg                        1/1     Running     0          3d19h
rook-ceph-osd-5-7d4d6467c7-w95sf                        1/1     Running     0          3d19h
rook-ceph-osd-6-5758ff6748-9tgpn                        1/1     Running     0          3d19h
rook-ceph-osd-7-97f99c76b-ccfc5                         1/1     Running     0          3d19h
rook-ceph-osd-8-7bc6c4bccd-22n8j                        1/1     Running     0          3d19h
rook-ceph-osd-prepare-k8s-ceph-01-gzknt                 0/1     Completed   0          9h
rook-ceph-osd-prepare-k8s-ceph-02-9kmnf                 0/1     Completed   0          9h
rook-ceph-osd-prepare-k8s-ceph-03-xszht                 0/1     Completed   0          9h
rook-ceph-osd-prepare-k8s-node-01-98458                 0/1     Completed   0          9h
rook-ceph-osd-prepare-k8s-node-02-wjb87                 0/1     Completed   0          9h
rook-ceph-osd-prepare-k8s-node-03-8mdgs                 0/1     Completed   0          9h
rook-ceph-tools-7cd79f6fbf-q97bf                        1/1     Running     0          3d12h
[root@k8s-master-01 ~]#
2.3、安装ceph登录工具与dashboard
kubectl create -f toolbox.yaml -f dashboard-external-https.yaml
2.4、登录ceph
kubectl -n rook-ceph exec -it $(kubectl -n rook-ceph get pod -l "app=rook-ceph-tools" -o jsonpath='{.items[0].metadata.name}') bash
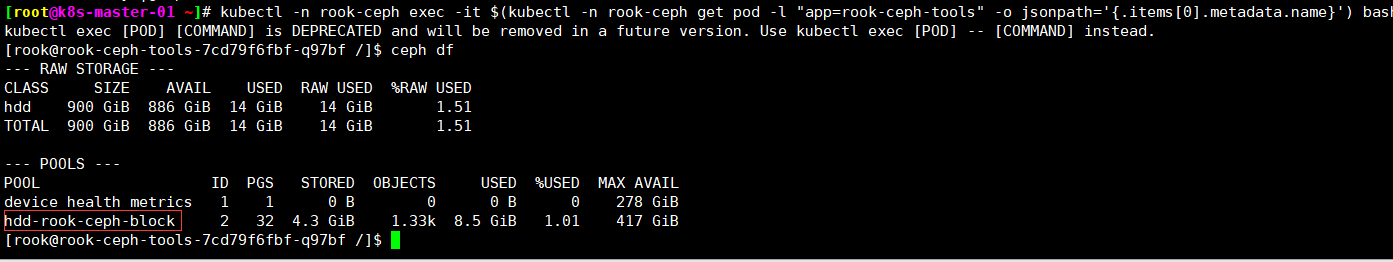
[root@k8s-master-01 ~]# kubectl -n rook-ceph exec -it $(kubectl -n rook-ceph get pod -l "app=rook-ceph-tools" -o jsonpath='{.items[0].metadata.name}') bash
kubectl exec [POD] [COMMAND] is DEPRECATED and will be removed in a future version. Use kubectl exec [POD] -- [COMMAND] instead.
[rook@rook-ceph-tools-7cd79f6fbf-q97bf /]$ ceph -s
  cluster:
    id:     778cf0a7-429f-43b4-af9b-f911025042ce
    health: HEALTH_OK

  services:
    mon: 3 daemons, quorum a,b,c (age 3d)
    mgr: a(active, since 3d)
    osd: 9 osds: 9 up (since 3d), 9 in (since 3d)

  data:
    pools:   2 pools, 33 pgs
    objects: 1.34k objects, 4.3 GiB
    usage:   14 GiB used, 886 GiB / 900 GiB avail
    pgs:     33 active+clean

  io:
    client:   76 KiB/s wr, 0 op/s rd, 1 op/s wr

[rook@rook-ceph-tools-7cd79f6fbf-q97bf /]$
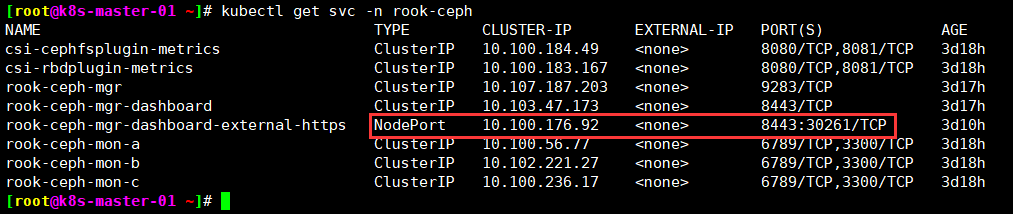
2.5、修改svc使rook-ceph通过NodePort映射端口访问
# kubectl edit -n rook-ceph svc rook-ceph-mgr-dashboard-external-https
# Please edit the object below. Lines beginning with a '#' will be ignored,
# and an empty file will abort the edit. If an error occurs while saving this file will be
# reopened with the relevant failures.
#
apiVersion: v1
kind: Service
metadata:
creationTimestamp: "2022-07-17T01:47:32Z"
labels:
app: rook-ceph-mgr
rook_cluster: rook-ceph
name: rook-ceph-mgr-dashboard-external-https
namespace: rook-ceph
resourceVersion: "486860"
selfLink: /api/v1/namespaces/rook-ceph/services/rook-ceph-mgr-dashboard-external-https
uid: 9d349c66-a71b-4f95-8b88-8dc1f71c37e6
spec:
clusterIP: 10.100.176.92
externalTrafficPolicy: Cluster
ports:
- name: dashboard
nodePort: 30261
port: 8443
protocol: TCP
targetPort: 8443
selector:
app: rook-ceph-mgr
ceph_daemon_id: a
rook_cluster: rook-ceph
sessionAffinity: None
type: NodePort
status:
loadBalancer: {}
2.5、通过网页访问ceph
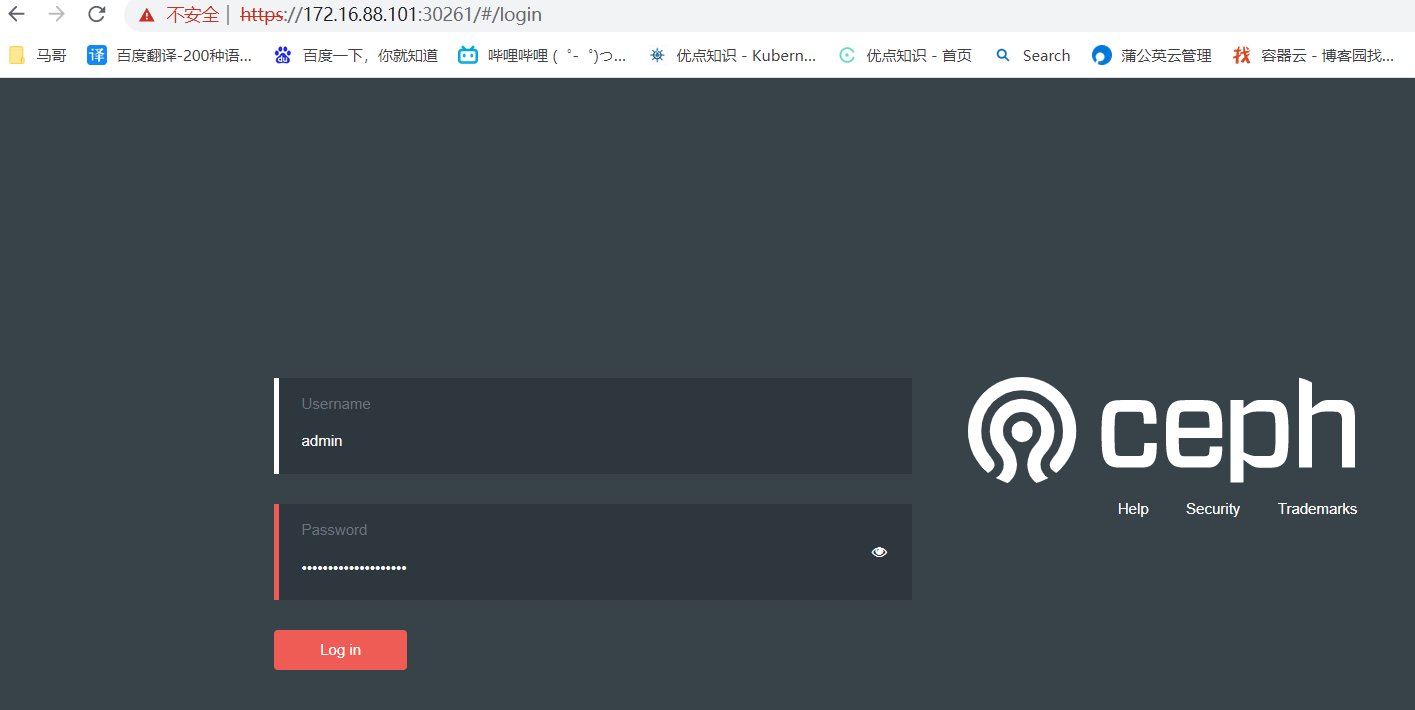
密码获取:
[root@k8s-master-01 ~]# kubectl -n rook-ceph get secret rook-ceph-dashboard-password -o jsonpath="{['data']['password']}" | base64 --decode && echo
+YFD*Q&+.@CecjuT^[<Z
[root@k8s-master-01 ~]#
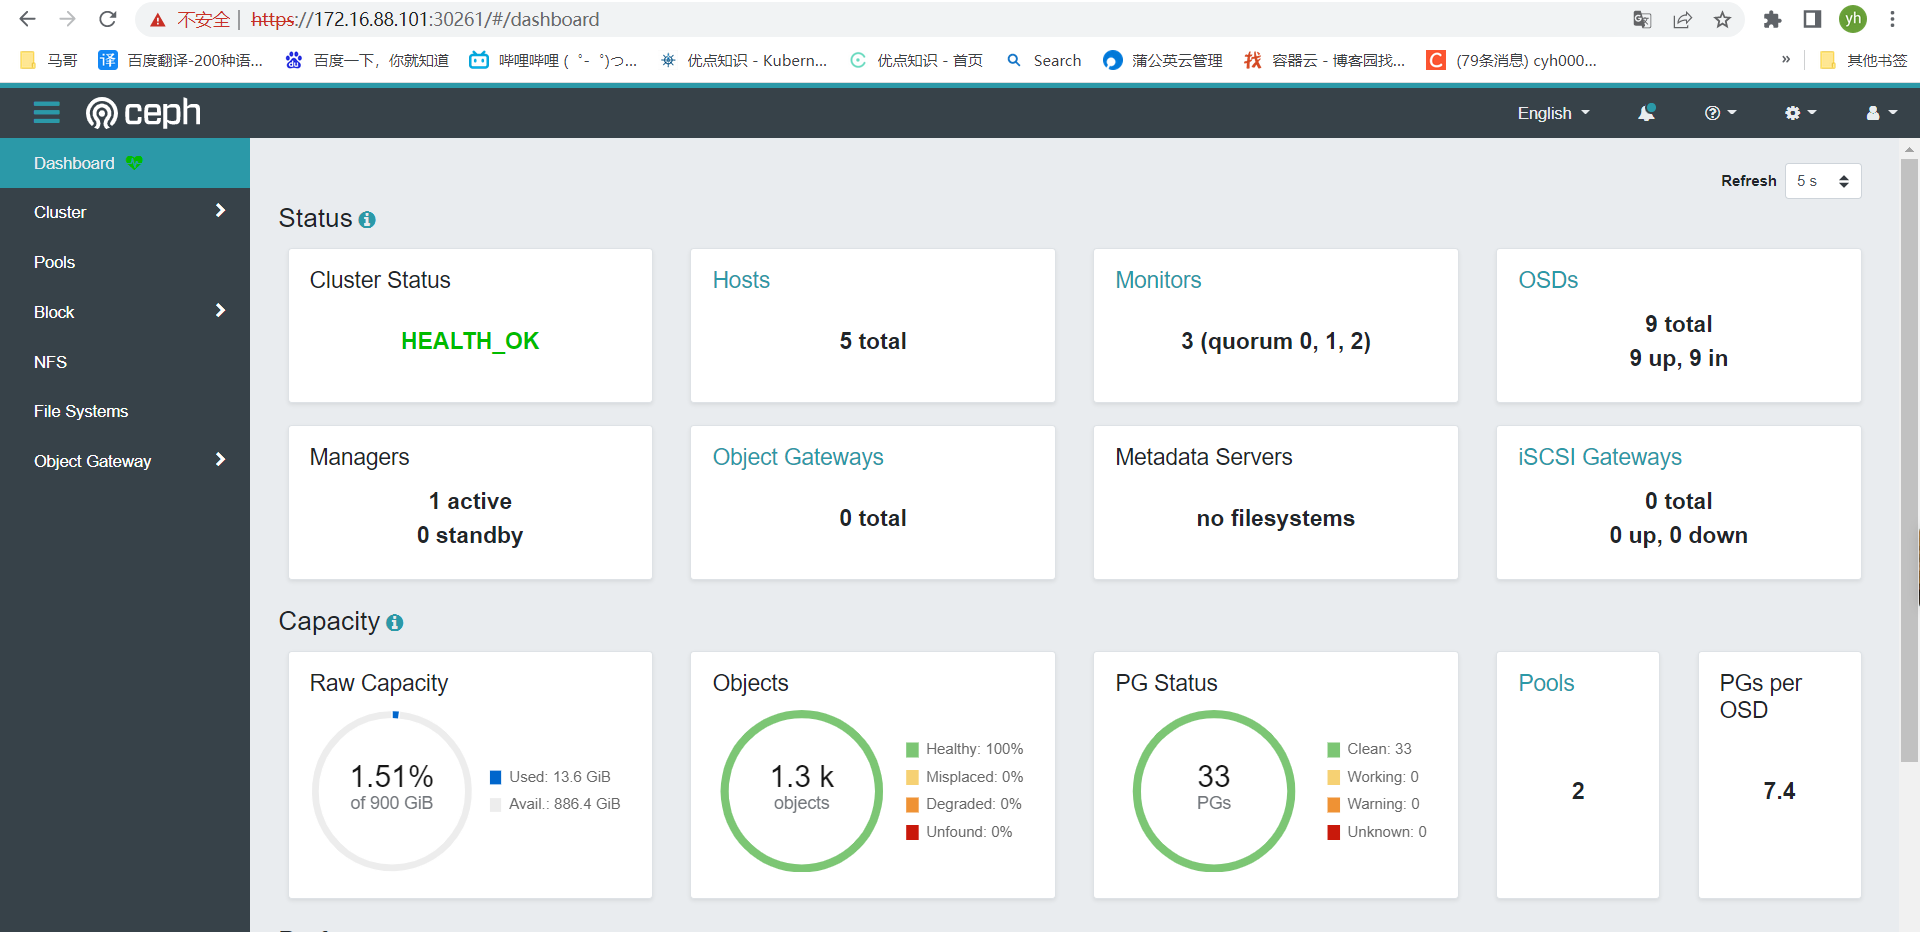
此时rook-ceph搭建完毕!!!
2.6、创建rook-ceph storageclass
[root@k8s-master-01 ~]# cat hdd-sc.yaml
apiVersion: ceph.rook.io/v1
kind: CephBlockPool
metadata:
  name: hdd-rook-ceph-block
  namespace: rook-ceph
spec:
  failureDomain: host
  replicated:
    size: 2
  deviceClass: hdd
---
apiVersion: storage.k8s.io/v1
kind: StorageClass
metadata:
   name: hdd-rook-ceph-block
provisioner: rook-ceph.rbd.csi.ceph.com
parameters:
    clusterID: rook-ceph
    pool: hdd-rook-ceph-block
    imageFormat: "2"
    imageFeatures: layering
    csi.storage.k8s.io/provisioner-secret-name: rook-csi-rbd-provisioner
    csi.storage.k8s.io/provisioner-secret-namespace: rook-ceph
    csi.storage.k8s.io/node-stage-secret-name: rook-csi-rbd-node
    csi.storage.k8s.io/node-stage-secret-namespace: rook-ceph
    csi.storage.k8s.io/fstype: xfs
reclaimPolicy: Delete
[root@k8s-master-01 ~]# kubectl create -f hdd-sc.yaml
[root@k8s-master-01 ~]# kubectl get sc -n rook-ceph
NAME                  PROVISIONER                  RECLAIMPOLICY   VOLUMEBINDINGMODE   ALLOWVOLUMEEXPANSION   AGE
hdd-rook-ceph-block   rook-ceph.rbd.csi.ceph.com   Delete          Immediate           false                  3d7h
[root@k8s-master-01 ~]#
2.7、查看ceph是否创建hdd-rook-ceph-block,如果没有创建手动创建
ceph osd pool create hdd-rook-ceph-block
ceph osd pool rm test-pool test-pool --yes-i-really-really-mean-it #删除test-pool
三、安装kube-prometheus监控
3.1、现在安装包
wget https://github.com/prometheus-operator/kube-prometheus/archive/refs/tags/v0.8.0.tar.gz
tar -xvzf v0.8.0.tar.gz
cd kube-prometheus-0.8.0/
3.2、创建monitoring
kubectl create ns monitoring
3.3、创建pvc
[root@k8s-master-01 kube-prometheus-0.8.0]# cat granfan-storage-pvc.yaml
apiVersion: v1
kind: PersistentVolumeClaim
metadata:
  name: grafana-storage
  namespace: monitoring
spec:
  accessModes:
  - ReadWriteOnce
  resources:
    requests:
      storage: 100Gi
  storageClassName: hdd-rook-ceph-block
[root@k8s-master-01 kube-prometheus-0.8.0]#
3.4、指定grafana使用pv
cat -n manifests/grafana-deployment.yaml
............
131 serviceAccountName: grafana
132 volumes:
133 - name: grafana-storage
134 persistentVolumeClaim:
135 claimName: grafana-storage
136 - name: grafana-datasources
137 secret:
138 secretName: grafana-datasources
139 - configMap:
140 name: grafana-dashboards
141 name: grafana-dashboards
142 - configMap:
............
[root@k8s-master-01 kube-prometheus-0.8.0]# cat -n manifests/prometheus-prometheus.yaml
     1    apiVersion: monitoring.coreos.com/v1
     2    kind: Prometheus
     3    metadata:
     4      labels:
     5        app.kubernetes.io/component: prometheus
     6        app.kubernetes.io/name: prometheus
     7        app.kubernetes.io/part-of: kube-prometheus
     8        app.kubernetes.io/version: 2.26.0
     9        prometheus: k8s
    10      name: k8s
    11      namespace: monitoring
    12    spec:
    13      alerting:
    14        alertmanagers:
    15        - apiVersion: v2
    16          name: alertmanager-main
    17          namespace: monitoring
    18          port: web
    19      externalLabels: {}
    20      image: quay.io/prometheus/prometheus:v2.26.0
    21      nodeSelector:
    22        kubernetes.io/os: linux
    23      podMetadata:
    24        labels:
    25          app.kubernetes.io/component: prometheus
    26          app.kubernetes.io/name: prometheus
    27          app.kubernetes.io/part-of: kube-prometheus
    28          app.kubernetes.io/version: 2.26.0
    29      podMonitorNamespaceSelector: {}
    30      podMonitorSelector: {}
    31      probeNamespaceSelector: {}
    32      probeSelector: {}
    33      replicas: 2
    34      resources:
    35        requests:
    36          memory: 400Mi
    37      ruleSelector:
    38        matchLabels:
    39          prometheus: k8s
    40          role: alert-rules
    41      securityContext:
    42        fsGroup: 2000
    43        runAsNonRoot: true
    44        runAsUser: 1000
    45      serviceAccountName: prometheus-k8s
    46      serviceMonitorNamespaceSelector: {}
    47      serviceMonitorSelector: {}
    48      version: 2.26.0
    49      storage:
    50        volumeClaimTemplate:
    51          spec:
    52            storageClassName: hdd-rook-ceph-block
    53            accessModes: ["ReadWriteOnce"]
    54            resources:
    55              requests:
    56                storage: 100Gi
    57     # retention: 1y
[root@k8s-master-01 kube-prometheus-0.8.0]#
[root@k8s-master-01 kube-prometheus-0.8.0]# cat -n manifests/alertmanager-alertmanager.yaml
     1    apiVersion: monitoring.coreos.com/v1
     2    kind: Alertmanager
     3    metadata:
     4      labels:
     5        alertmanager: main
     6        app.kubernetes.io/component: alert-router
     7        app.kubernetes.io/name: alertmanager
     8        app.kubernetes.io/part-of: kube-prometheus
     9        app.kubernetes.io/version: 0.21.0
    10      name: main
    11      namespace: monitoring
    12    spec:
    13      image: quay.io/prometheus/alertmanager:v0.21.0
    14      nodeSelector:
    15        kubernetes.io/os: linux
    16      podMetadata:
    17        labels:
    18          app.kubernetes.io/component: alert-router
    19          app.kubernetes.io/name: alertmanager
    20          app.kubernetes.io/part-of: kube-prometheus
    21          app.kubernetes.io/version: 0.21.0
    22      replicas: 3
    23      resources:
    24        limits:
    25          cpu: 100m
    26          memory: 100Mi
    27        requests:
    28          cpu: 4m
    29          memory: 100Mi
    30      securityContext:
    31        fsGroup: 2000
    32        runAsNonRoot: true
    33        runAsUser: 1000
    34      serviceAccountName: alertmanager-main
    35      version: 0.21.0
    36      storage:
    37        volumeClaimTemplate:
    38          spec:
    39            storageClassName: hdd-rook-ceph-block
    40            accessModes: ["ReadWriteOnce"]
    41            resources:
    42              requests:
    43                storage: 100Gi
[root@k8s-master-01 kube-prometheus-0.8.0]#
3.5、安装kube-prometheues
# kubectl create -f manifests/setup/
# kubectl create -f manifests/
[root@k8s-master-01 kube-prometheus-0.8.0]#  kubectl get pod -n monitoring
NAME                                   READY   STATUS    RESTARTS   AGE
alertmanager-main-0                    2/2     Running   0          3d7h
alertmanager-main-1                    2/2     Running   0          3d7h
alertmanager-main-2                    2/2     Running   0          3d7h
blackbox-exporter-55c457d5fb-5hfmn     3/3     Running   0          3d7h
grafana-79d866bddf-f5j99               1/1     Running   0          3d7h
kube-state-metrics-76f6cb7996-8xbrj    3/3     Running   0          3d7h
node-exporter-7rzqp                    2/2     Running   0          3d7h
node-exporter-dxpcq                    2/2     Running   0          3d7h
node-exporter-ftms2                    2/2     Running   0          3d7h
node-exporter-h87x4                    2/2     Running   0          3d7h
node-exporter-j27j2                    2/2     Running   0          3d7h
node-exporter-lwxsd                    2/2     Running   0          3d7h
node-exporter-qk59q                    2/2     Running   0          3d7h
node-exporter-t5zhs                    2/2     Running   0          3d7h
node-exporter-tg9fp                    2/2     Running   0          3d7h
prometheus-adapter-59df95d9f5-5mz9v    1/1     Running   0          3d7h
prometheus-adapter-59df95d9f5-8gg4j    1/1     Running   0          3d7h
prometheus-k8s-0                       2/2     Running   1          3d7h
prometheus-k8s-1                       2/2     Running   1          3d7h
prometheus-operator-7775c66ccf-j249k   2/2     Running   0          3d7h
[root@k8s-master-01 kube-prometheus-0.8.0]# kubectl get pvc -n monitoring
NAME                                       STATUS   VOLUME                                     CAPACITY   ACCESS MODES   STORAGECLASS          AGE
alertmanager-main-db-alertmanager-main-0   Bound    pvc-7c4e0bbd-5fa5-478a-9d61-2688d55455fb   100Gi      RWO            hdd-rook-ceph-block   3d7h
alertmanager-main-db-alertmanager-main-1   Bound    pvc-d9be4330-e682-4fea-b475-f2f129d52426   100Gi      RWO            hdd-rook-ceph-block   3d7h
alertmanager-main-db-alertmanager-main-2   Bound    pvc-b98ab349-ecfd-4943-a94b-9ac483903596   100Gi      RWO            hdd-rook-ceph-block   3d7h
grafana-storage                            Bound    pvc-b97e7042-d638-47f3-91a2-c15870079381   100Gi      RWO            hdd-rook-ceph-block   3d7h
prometheus-k8s-db-prometheus-k8s-0         Bound    pvc-a5cde349-8558-44b0-a9af-e55d36b96fe6   100Gi      RWO            hdd-rook-ceph-block   3d7h
prometheus-k8s-db-prometheus-k8s-1         Bound    pvc-586ce4e3-4abf-4d14-b33f-890d78201734   100Gi      RWO            hdd-rook-ceph-block   3d7h
[root@k8s-master-01 kube-prometheus-0.8.0]# kubectl get pv -n monitoring
NAME                                       CAPACITY   ACCESS MODES   RECLAIM POLICY   STATUS   CLAIM                                                 STORAGECLASS          REASON   AGE
pvc-586ce4e3-4abf-4d14-b33f-890d78201734   100Gi      RWO            Delete           Bound    monitoring/prometheus-k8s-db-prometheus-k8s-1         hdd-rook-ceph-block            3d7h
pvc-59ed12ad-03a7-47be-8030-1f85f3ce184c   200Gi      RWO            Delete           Bound    loki-logs/loki                                        hdd-rook-ceph-block            3d7h
pvc-7c4e0bbd-5fa5-478a-9d61-2688d55455fb   100Gi      RWO            Delete           Bound    monitoring/alertmanager-main-db-alertmanager-main-0   hdd-rook-ceph-block            3d7h
pvc-a5cde349-8558-44b0-a9af-e55d36b96fe6   100Gi      RWO            Delete           Bound    monitoring/prometheus-k8s-db-prometheus-k8s-0         hdd-rook-ceph-block            3d7h
pvc-b97e7042-d638-47f3-91a2-c15870079381   100Gi      RWO            Delete           Bound    monitoring/grafana-storage                            hdd-rook-ceph-block            3d7h
pvc-b98ab349-ecfd-4943-a94b-9ac483903596   100Gi      RWO            Delete           Bound    monitoring/alertmanager-main-db-alertmanager-main-2   hdd-rook-ceph-block            3d7h
pvc-d9be4330-e682-4fea-b475-f2f129d52426   100Gi      RWO            Delete           Bound    monitoring/alertmanager-main-db-alertmanager-main-1   hdd-rook-ceph-block            3d7h
[root@k8s-master-01 kube-prometheus-0.8.0]#
3.6、配置svc
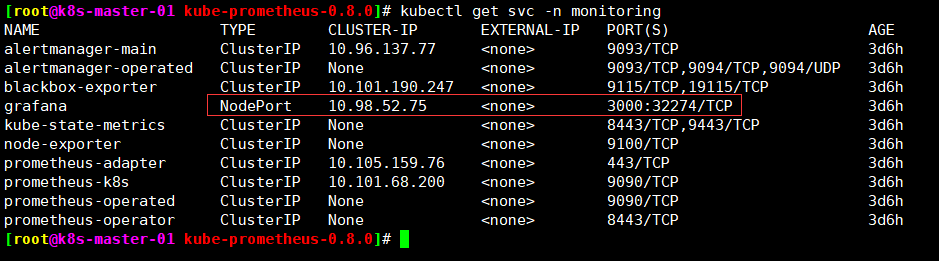
# kubectl edit svc -n monitoring grafana
# Please edit the object below. Lines beginning with a '#' will be ignored,
# and an empty file will abort the edit. If an error occurs while saving this file will be
# reopened with the relevant failures.
#
apiVersion: v1
kind: Service
metadata:
  creationTimestamp: "2022-07-17T06:15:14Z"
  labels:
    app.kubernetes.io/component: grafana
    app.kubernetes.io/name: grafana
    app.kubernetes.io/part-of: kube-prometheus
    app.kubernetes.io/version: 7.5.4
  name: grafana
  namespace: monitoring
  resourceVersion: "220059"
  selfLink: /api/v1/namespaces/monitoring/services/grafana
  uid: 55ae8827-2c07-4cbd-afec-b4c664f37259
spec:
  clusterIP: 10.98.52.75
  externalTrafficPolicy: Cluster
  ports:
  - name: http
    nodePort: 32274
    port: 3000
    protocol: TCP
    targetPort: http
  selector:
    app.kubernetes.io/component: grafana
    app.kubernetes.io/name: grafana
    app.kubernetes.io/part-of: kube-prometheus
  sessionAffinity: None
  type: NodePort
status:
  loadBalancer: {}
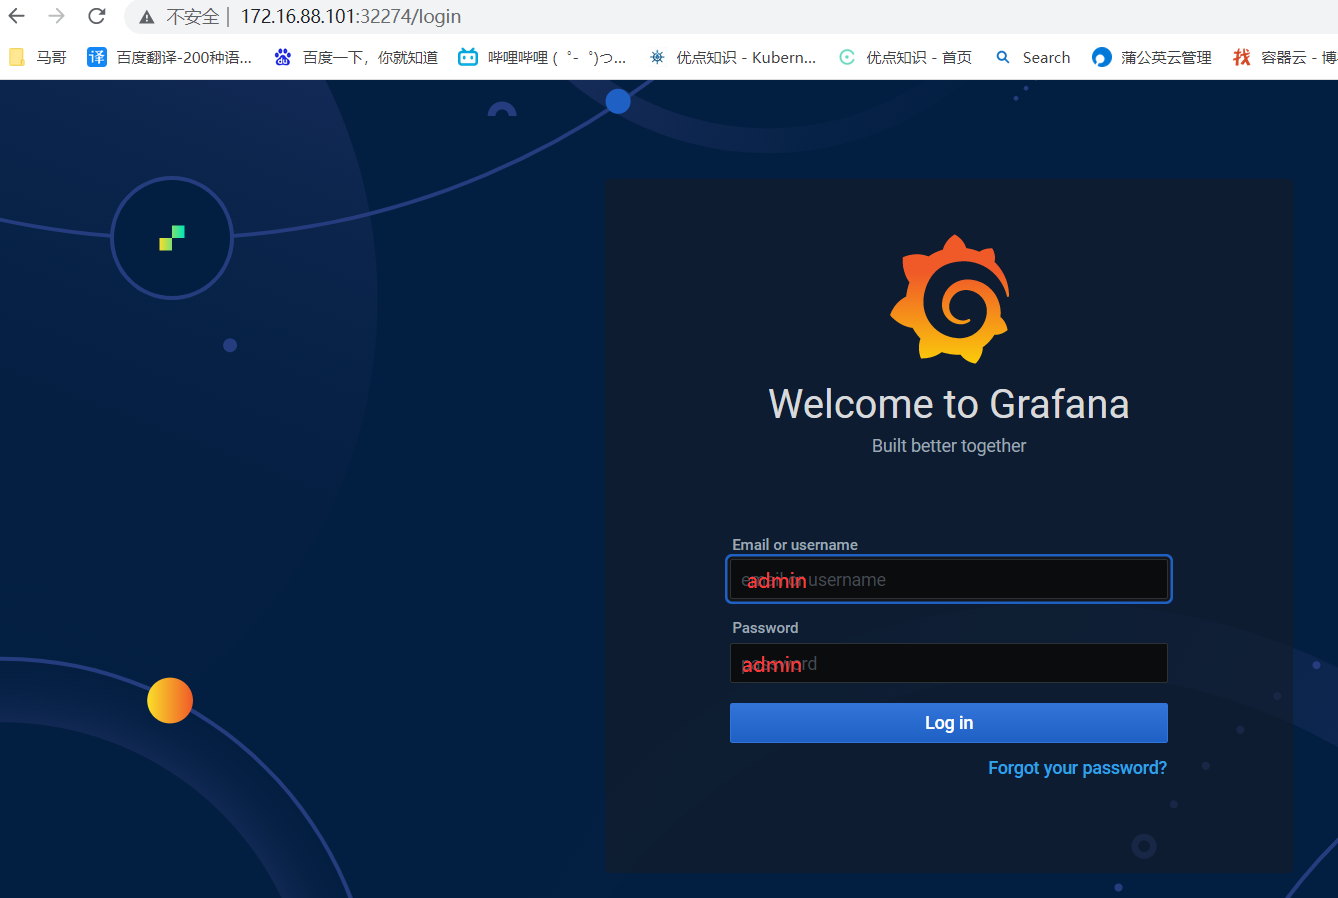
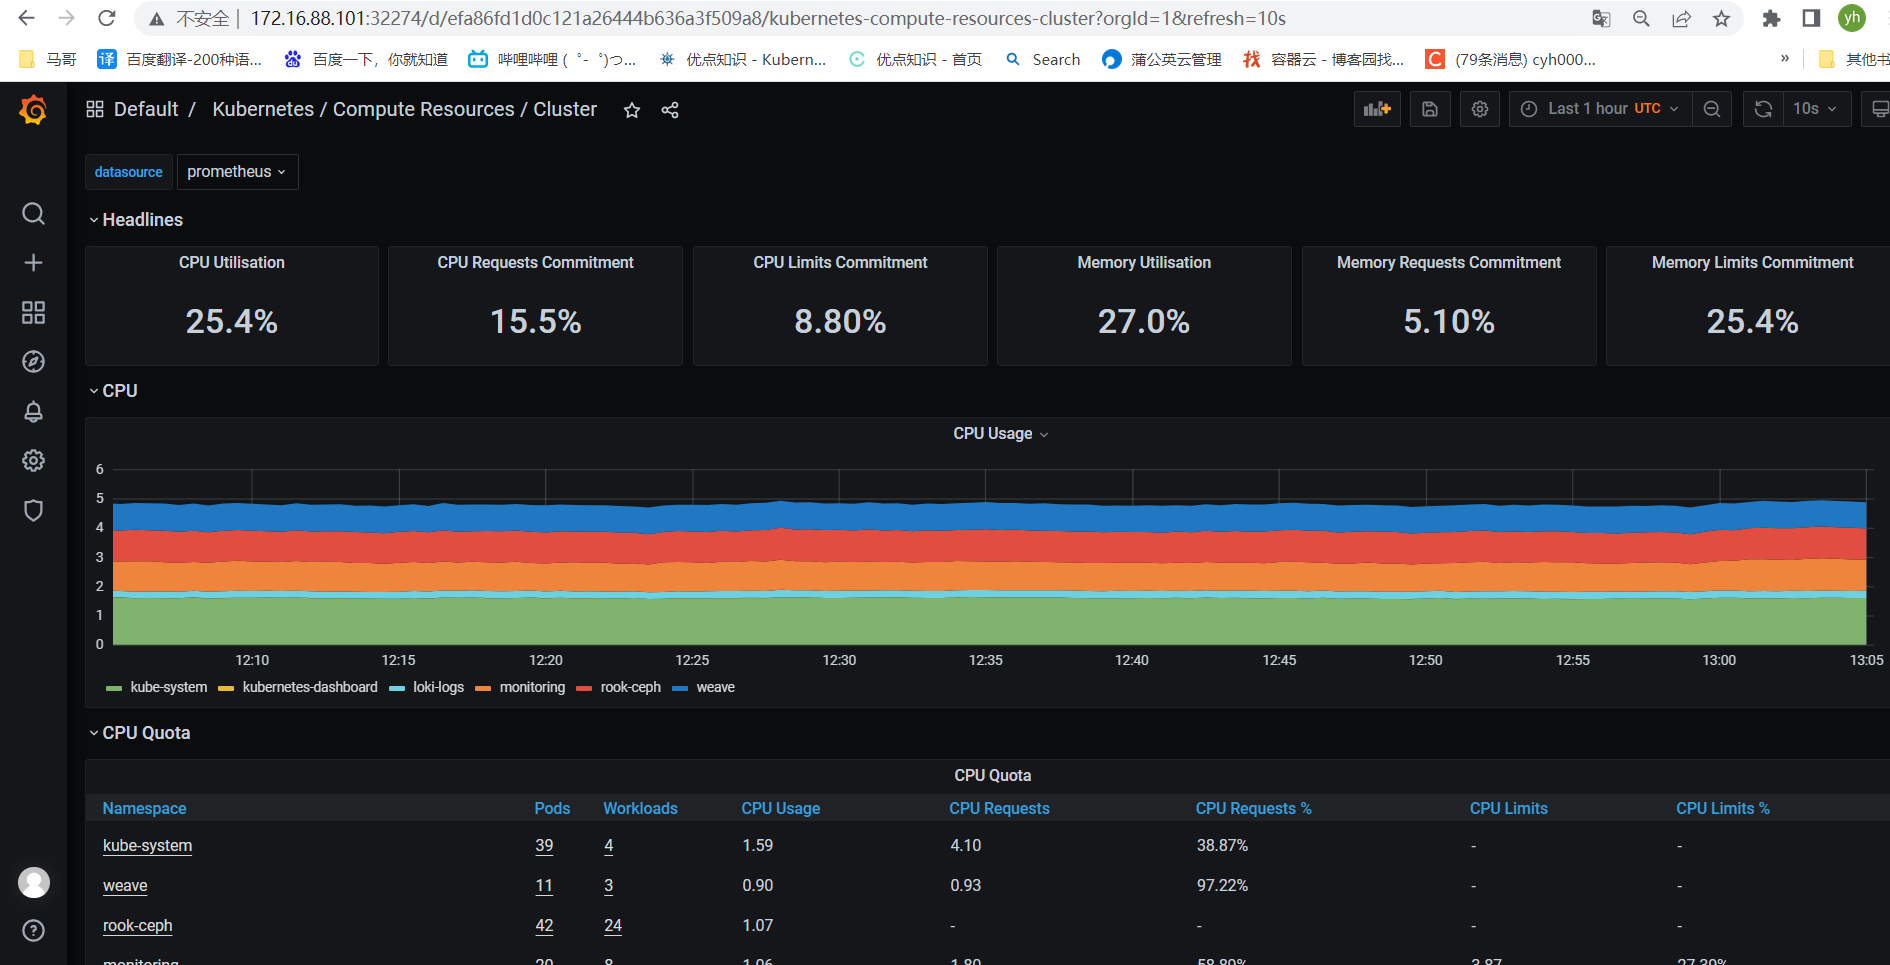
3.7、验证http访问
软件自带大概有20来个模板,都可以使用
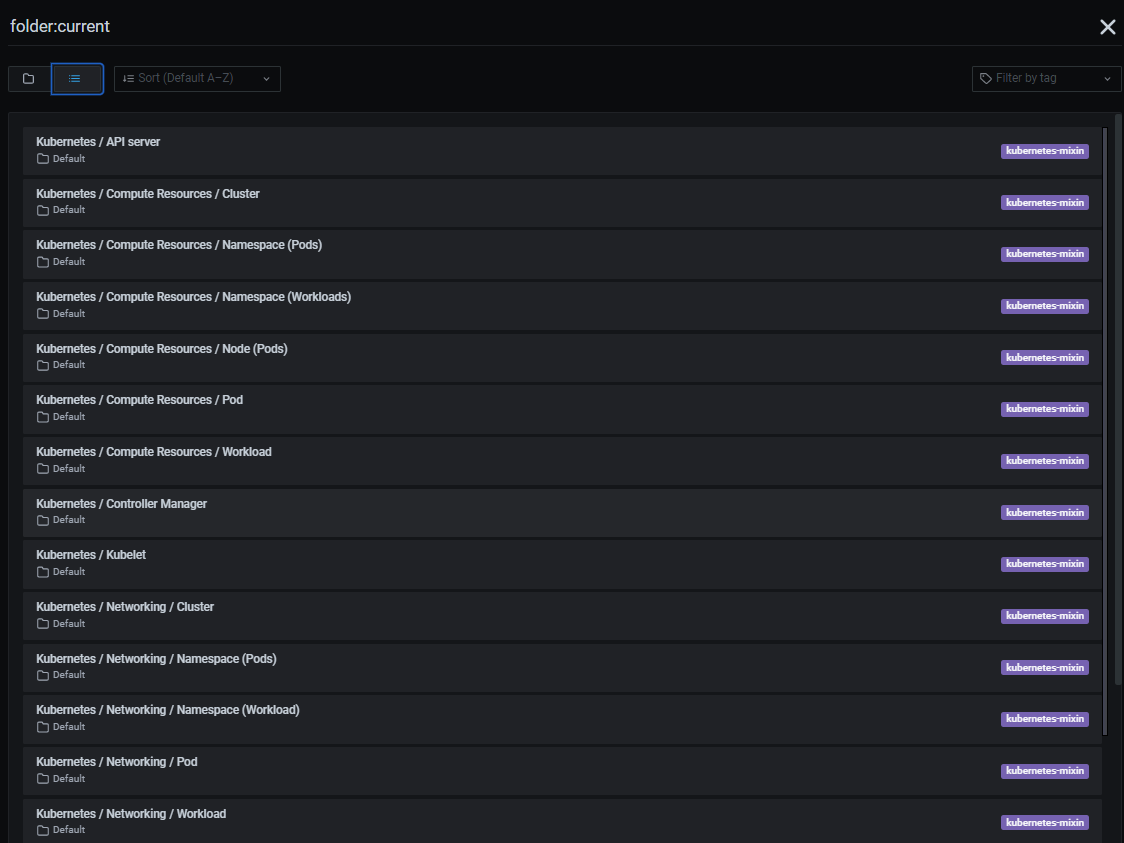
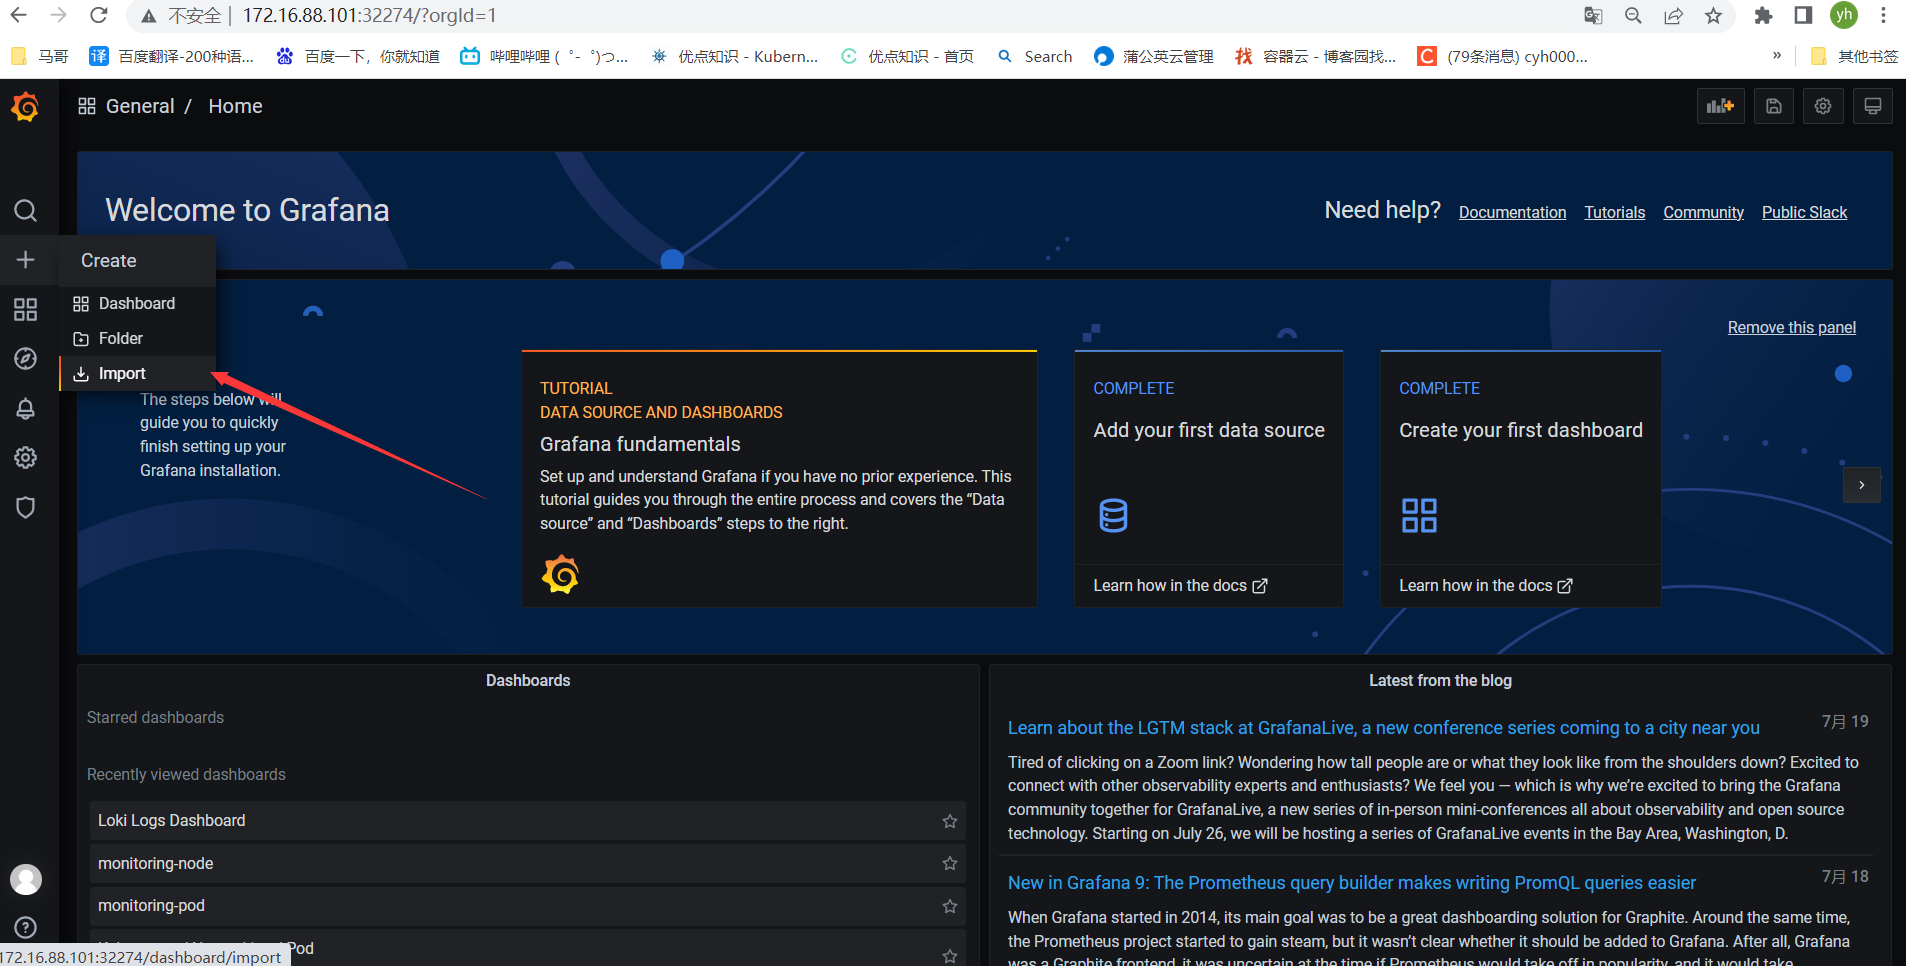
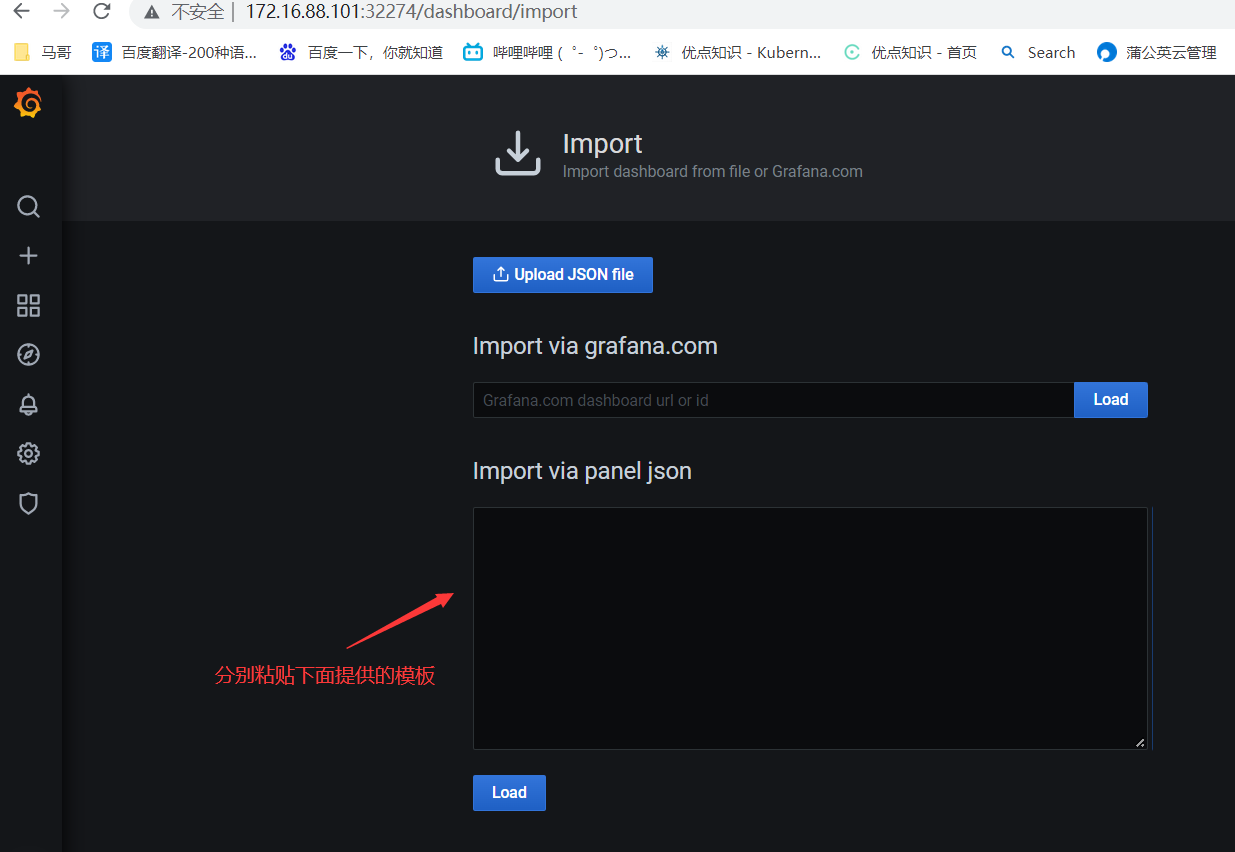
另外可以新增如下两个自定义模板
导入方式
监控node节点


{ "annotations": { "list": [ { "builtIn": 1, "datasource": "prometheus", "enable": true, "hide": true, "iconColor": "rgba(0, 211, 255, 1)", "name": "Annotations & Alerts", "type": "dashboard" } ] }, "description": "【English version】Update 2020.10.10, add the overall resource overview! Support Grafana6&7,Support Node Exporter v0.16 and above.Optimize the main metrics display. Includes: CPU, memory, disk IO, network, temperature and other monitoring metrics。https://github.com/starsliao/Prometheus", "editable": true, "gnetId": 11074, "graphTooltip": 0, "id": 27, "iteration": 1658322474386, "links": [ { "icon": "bolt", "tags": [], "targetBlank": true, "title": "Update", "tooltip": "Update dashboard", "type": "link", "url": "https://grafana.com/grafana/dashboards/11074" }, { "icon": "question", "tags": [], "targetBlank": true, "title": "GitHub", "tooltip": "more dashboard", "type": "link", "url": "https://github.com/starsliao" }, { "asDropdown": true, "icon": "external link", "tags": [], "targetBlank": true, "title": "", "type": "dashboards" } ], "panels": [ { "collapsed": false, "datasource": "prometheus", "gridPos": { "h": 1, "w": 24, "x": 0, "y": 0 }, "id": 187, "panels": [], "title": "Resource Overview (associated JOB),Host:$show_hostname,Instance:$node", "type": "row" }, { "columns": [], "datasource": "prometheus", "description": "Partition utilization, disk read, disk write, download bandwidth, upload bandwidth, if there are multiple network cards or multiple partitions, it is the value of the network card or partition with the highest utilization rate collected.\n\nCurrEstab: The number of TCP connections whose current status is ESTABLISHED or CLOSE-WAIT.", "fieldConfig": { "defaults": {}, "overrides": [] }, "fontSize": "80%", "gridPos": { "h": 7, "w": 24, "x": 0, "y": 1 }, "id": 185, "pageSize": null, "showHeader": true, "sort": { "col": 31, "desc": false }, "styles": [ { "alias": "Hostname", "align": "auto", "colorMode": null, "colors": [ "rgba(245, 54, 54, 0.9)", "rgba(237, 129, 40, 0.89)", "rgba(50, 172, 45, 0.97)" ], "dateFormat": "YYYY-MM-DD HH:mm:ss", "decimals": 1, "link": false, "linkTooltip": "", "linkUrl": "", "mappingType": 1, "pattern": "nodename", "thresholds": [], "type": "string", "unit": "bytes" }, { "alias": "IP(Link to details)", "align": "auto", "colorMode": null, "colors": [ "rgba(245, 54, 54, 0.9)", "rgba(237, 129, 40, 0.89)", "rgba(50, 172, 45, 0.97)" ], "dateFormat": "YYYY-MM-DD HH:mm:ss", "decimals": 2, "link": true, "linkTargetBlank": false, "linkTooltip": "Browse host details", "linkUrl": "d/xfpJB9FGz/node-exporter?orgId=1&var-job=${job}&var-hostname=All&var-node=${__cell}&var-device=All&var-origin_prometheus=$origin_prometheus", "mappingType": 1, "pattern": "instance", "thresholds": [], "type": "number", "unit": "short" }, { "alias": "Memory", "align": "auto", "colorMode": null, "colors": [ "rgba(245, 54, 54, 0.9)", "rgba(237, 129, 40, 0.89)", "rgba(50, 172, 45, 0.97)" ], "dateFormat": "YYYY-MM-DD HH:mm:ss", "decimals": 2, "link": false, "mappingType": 1, "pattern": "Value #B", "thresholds": [], "type": "number", "unit": "bytes" }, { "alias": "CPU Cores", "align": "auto", "colorMode": null, "colors": [ "rgba(245, 54, 54, 0.9)", "rgba(237, 129, 40, 0.89)", "rgba(50, 172, 45, 0.97)" ], "dateFormat": "YYYY-MM-DD HH:mm:ss", "decimals": null, "mappingType": 1, "pattern": "Value #C", "thresholds": [], "type": "number", "unit": "short" }, { "alias": " Uptime", "align": "auto", "colorMode": null, "colors": [ "rgba(245, 54, 54, 0.9)", "rgba(237, 129, 40, 0.89)", "rgba(50, 172, 45, 0.97)" ], "dateFormat": "YYYY-MM-DD HH:mm:ss", "decimals": 2, "mappingType": 1, "pattern": "Value #D", "thresholds": [], "type": "number", "unit": "s" }, { "alias": "Partition used%*", "align": "auto", "colorMode": "cell", "colors": [ "rgba(50, 172, 45, 0.97)", "rgba(237, 129, 40, 0.89)", "rgba(245, 54, 54, 0.9)" ], "dateFormat": "YYYY-MM-DD HH:mm:ss", "decimals": 2, "mappingType": 1, "pattern": "Value #E", "thresholds": [ "70", "85" ], "type": "number", "unit": "percent" }, { "alias": "CPU used%", "align": "auto", "colorMode": "cell", "colors": [ "rgba(50, 172, 45, 0.97)", "rgba(237, 129, 40, 0.89)", "rgba(245, 54, 54, 0.9)" ], "dateFormat": "YYYY-MM-DD HH:mm:ss", "decimals": 2, "mappingType": 1, "pattern": "Value #F", "thresholds": [ "70", "85" ], "type": "number", "unit": "percent" }, { "alias": "Memory used%", "align": "auto", "colorMode": "cell", "colors": [ "rgba(50, 172, 45, 0.97)", "rgba(237, 129, 40, 0.89)", "rgba(245, 54, 54, 0.9)" ], "dateFormat": "YYYY-MM-DD HH:mm:ss", "decimals": 2, "mappingType": 1, "pattern": "Value #G", "thresholds": [ "70", "85" ], "type": "number", "unit": "percent" }, { "alias": "Disk read*", "align": "auto", "colorMode": "cell", "colors": [ "rgba(50, 172, 45, 0.97)", "rgba(237, 129, 40, 0.89)", "rgba(245, 54, 54, 0.9)" ], "dateFormat": "YYYY-MM-DD HH:mm:ss", "decimals": 2, "mappingType": 1, "pattern": "Value #H", "thresholds": [ "10485760", "20485760" ], "type": "number", "unit": "Bps" }, { "alias": "Disk write*", "align": "auto", "colorMode": "cell", "colors": [ "rgba(50, 172, 45, 0.97)", "rgba(237, 129, 40, 0.89)", "rgba(245, 54, 54, 0.9)" ], "dateFormat": "YYYY-MM-DD HH:mm:ss", "decimals": 2, "mappingType": 1, "pattern": "Value #I", "thresholds": [ "10485760", "20485760" ], "type": "number", "unit": "Bps" }, { "alias": "Download*", "align": "auto", "colorMode": "cell", "colors": [ "rgba(50, 172, 45, 0.97)", "rgba(237, 129, 40, 0.89)", "rgba(245, 54, 54, 0.9)" ], "dateFormat": "YYYY-MM-DD HH:mm:ss", "decimals": 2, "mappingType": 1, "pattern": "Value #J", "thresholds": [ "30485760", "104857600" ], "type": "number", "unit": "bps" }, { "alias": "Upload*", "align": "auto", "colorMode": "cell", "colors": [ "rgba(50, 172, 45, 0.97)", "rgba(237, 129, 40, 0.89)", "rgba(245, 54, 54, 0.9)" ], "dateFormat": "YYYY-MM-DD HH:mm:ss", "decimals": 2, "mappingType": 1, "pattern": "Value #K", "thresholds": [ "30485760", "104857600" ], "type": "number", "unit": "bps" }, { "alias": "5m load", "align": "auto", "colorMode": null, "colors": [ "rgba(245, 54, 54, 0.9)", "rgba(237, 129, 40, 0.89)", "rgba(50, 172, 45, 0.97)" ], "dateFormat": "YYYY-MM-DD HH:mm:ss", "decimals": 2, "mappingType": 1, "pattern": "Value #L", "thresholds": [], "type": "number", "unit": "short" }, { "alias": "CurrEstab", "align": "auto", "colorMode": "cell", "colors": [ "rgba(50, 172, 45, 0.97)", "rgba(237, 129, 40, 0.89)", "rgba(245, 54, 54, 0.9)" ], "dateFormat": "YYYY-MM-DD HH:mm:ss", "decimals": 2, "mappingType": 1, "pattern": "Value #M", "thresholds": [ "1000", "1500" ], "type": "string", "unit": "short" }, { "alias": "TCP_tw", "align": "center", "colorMode": "cell", "colors": [ "rgba(50, 172, 45, 0.97)", "rgba(237, 129, 40, 0.89)", "rgba(245, 54, 54, 0.9)" ], "dateFormat": "YYYY-MM-DD HH:mm:ss", "decimals": null, "mappingType": 1, "pattern": "Value #N", "thresholds": [ "5000", "20000" ], "type": "number", "unit": "short" }, { "alias": "", "align": "right", "colorMode": null, "colors": [ "rgba(245, 54, 54, 0.9)", "rgba(237, 129, 40, 0.89)", "rgba(50, 172, 45, 0.97)" ], "decimals": 2, "pattern": "/.*/", "thresholds": [], "type": "hidden", "unit": "short" } ], "targets": [ { "expr": "node_uname_info{origin_prometheus=~\"$origin_prometheus\",job=~\"$job\"} - 0", "format": "table", "instant": true, "interval": "", "legendFormat": "主机名", "refId": "A" }, { "expr": "sum(time() - node_boot_time_seconds{origin_prometheus=~\"$origin_prometheus\",job=~\"$job\"})by(instance)", "format": "table", "hide": false, "instant": true, "interval": "", "legendFormat": "运行时间", "refId": "D" }, { "expr": "node_memory_MemTotal_bytes{origin_prometheus=~\"$origin_prometheus\",job=~\"$job\"} - 0", "format": "table", "hide": false, "instant": true, "interval": "", "legendFormat": "总内存", "refId": "B" }, { "expr": "count(node_cpu_seconds_total{origin_prometheus=~\"$origin_prometheus\",job=~\"$job\",mode='system'}) by (instance)", "format": "table", "hide": false, "instant": true, "interval": "", "legendFormat": "总核数", "refId": "C" }, { "expr": "node_load5{origin_prometheus=~\"$origin_prometheus\",job=~\"$job\"}", "format": "table", "instant": true, "interval": "", "legendFormat": "5分钟负载", "refId": "L" }, { "expr": "(1 - avg(rate(node_cpu_seconds_total{origin_prometheus=~\"$origin_prometheus\",job=~\"$job\",mode=\"idle\"}[$interval])) by (instance)) * 100", "format": "table", "hide": false, "instant": true, "interval": "", "legendFormat": "CPU使用率", "refId": "F" }, { "expr": "(1 - (node_memory_MemAvailable_bytes{origin_prometheus=~\"$origin_prometheus\",job=~\"$job\"} / (node_memory_MemTotal_bytes{origin_prometheus=~\"$origin_prometheus\",job=~\"$job\"})))* 100", "format": "table", "hide": false, "instant": true, "interval": "", "legendFormat": "内存使用率", "refId": "G" }, { "expr": "max((node_filesystem_size_bytes{origin_prometheus=~\"$origin_prometheus\",job=~\"$job\",fstype=~\"ext.?|xfs\"}-node_filesystem_free_bytes{origin_prometheus=~\"$origin_prometheus\",job=~\"$job\",fstype=~\"ext.?|xfs\"}) *100/(node_filesystem_avail_bytes {origin_prometheus=~\"$origin_prometheus\",job=~\"$job\",fstype=~\"ext.?|xfs\"}+(node_filesystem_size_bytes{origin_prometheus=~\"$origin_prometheus\",job=~\"$job\",fstype=~\"ext.?|xfs\"}-node_filesystem_free_bytes{origin_prometheus=~\"$origin_prometheus\",job=~\"$job\",fstype=~\"ext.?|xfs\"})))by(instance)", "format": "table", "hide": false, "instant": true, "interval": "", "legendFormat": "分区使用率", "refId": "E" }, { "expr": "max(rate(node_disk_read_bytes_total{origin_prometheus=~\"$origin_prometheus\",job=~\"$job\"}[$interval])) by (instance)", "format": "table", "hide": false, "instant": true, "interval": "", "legendFormat": "最大读取", "refId": "H" }, { "expr": "max(rate(node_disk_written_bytes_total{origin_prometheus=~\"$origin_prometheus\",job=~\"$job\"}[$interval])) by (instance)", "format": "table", "hide": false, "instant": true, "interval": "", "legendFormat": "最大写入", "refId": "I" }, { "expr": "node_netstat_Tcp_CurrEstab{origin_prometheus=~\"$origin_prometheus\",job=~\"$job\"} - 0", "format": "table", "hide": false, "instant": true, "interval": "", "legendFormat": "连接数", "refId": "M" }, { "expr": "node_sockstat_TCP_tw{origin_prometheus=~\"$origin_prometheus\",job=~\"$job\"} - 0", "format": "table", "hide": false, "instant": true, "interval": "", "legendFormat": "TIME_WAIT", "refId": "N" }, { "expr": "max(rate(node_network_receive_bytes_total{origin_prometheus=~\"$origin_prometheus\",job=~\"$job\"}[$interval])*8) by (instance)", "format": "table", "hide": false, "instant": true, "interval": "", "legendFormat": "下载带宽", "refId": "J" }, { "expr": "max(rate(node_network_transmit_bytes_total{origin_prometheus=~\"$origin_prometheus\",job=~\"$job\"}[$interval])*8) by (instance)", "format": "table", "hide": false, "instant": true, "interval": "", "legendFormat": "上传带宽", "refId": "K" } ], "timeFrom": null, "timeShift": null, "title": "Server Resource Overview【JOB:$job,Total:$total】", "transform": "table", "type": "table-old" }, { "aliasColors": { "192.168.200.241:9100_Total": "dark-red", "Idle - Waiting for something to happen": "#052B51", "guest": "#9AC48A", "idle": "#052B51", "iowait": "#EAB839", "irq": "#BF1B00", "nice": "#C15C17", "sdb_每秒I/O操作%": "#d683ce", "softirq": "#E24D42", "steal": "#FCE2DE", "system": "#508642", "user": "#5195CE", "磁盘花费在I/O操作占比": "#ba43a9" }, "bars": false, "dashLength": 10, "dashes": false, "datasource": "prometheus", "decimals": null, "description": "", "fieldConfig": { "defaults": { "links": [] }, "overrides": [] }, "fill": 0, "fillGradient": 0, "gridPos": { "h": 7, "w": 8, "x": 0, "y": 8 }, "hiddenSeries": false, "id": 191, "legend": { "alignAsTable": false, "avg": false, "current": true, "hideEmpty": true, "hideZero": true, "max": false, "min": false, "rightSide": false, "show": true, "sideWidth": null, "sort": "current", "sortDesc": true, "total": false, "values": true }, "lines": true, "linewidth": 2, "links": [], "maxPerRow": 6, "nullPointMode": "null", "options": { "alertThreshold": true }, "percentage": false, "pluginVersion": "7.5.4", "pointradius": 5, "points": false, "renderer": "flot", "repeat": null, "seriesOverrides": [ { "alias": "Overall average used%", "lines": false, "pointradius": 1, "points": true, "yaxis": 2 }, { "alias": "CPU Cores", "color": "#C4162A" } ], "spaceLength": 10, "stack": false, "steppedLine": false, "targets": [ { "expr": "count(node_cpu_seconds_total{origin_prometheus=~\"$origin_prometheus\",job=~\"$job\", mode='system'})", "format": "time_series", "hide": false, "instant": false, "interval": "30m", "intervalFactor": 1, "legendFormat": "CPU Cores", "refId": "B", "step": 240 }, { "expr": "sum(node_load5{origin_prometheus=~\"$origin_prometheus\",job=~\"$job\"})", "format": "time_series", "hide": false, "interval": "30m", "intervalFactor": 1, "legendFormat": "Total 5m load", "refId": "A", "step": 240 }, { "expr": "avg(1 - avg(rate(node_cpu_seconds_total{origin_prometheus=~\"$origin_prometheus\",job=~\"$job\",mode=\"idle\"}[$interval])) by (instance)) * 100", "format": "time_series", "hide": false, "interval": "30m", "intervalFactor": 1, "legendFormat": "Overall average used%", "refId": "F", "step": 240 } ], "thresholds": [], "timeFrom": null, "timeRegions": [], "timeShift": null, "title": "$job:Overall total 5m load & average CPU used%", "tooltip": { "shared": true, "sort": 2, "value_type": "individual" }, "type": "graph", "xaxis": { "buckets": null, "mode": "time", "name": null, "show": true, "values": [] }, "yaxes": [ { "decimals": null, "format": "short", "label": "Total 5m load", "logBase": 1, "max": null, "min": null, "show": true }, { "decimals": 0, "format": "percent", "label": "Overall average used%", "logBase": 1, "max": null, "min": null, "show": true } ], "yaxis": { "align": false, "alignLevel": null } }, { "aliasColors": { "192.168.200.241:9100_总内存": "dark-red", "内存_Avaliable": "#6ED0E0", "内存_Cached": "#EF843C", "内存_Free": "#629E51", "内存_Total": "#6d1f62", "内存_Used": "#eab839", "可用": "#9ac48a", "总内存": "#bf1b00" }, "bars": false, "dashLength": 10, "dashes": false, "datasource": "prometheus", "decimals": 1, "fieldConfig": { "defaults": { "links": [] }, "overrides": [] }, "fill": 0, "fillGradient": 0, "gridPos": { "h": 7, "w": 8, "x": 8, "y": 8 }, "height": "300", "hiddenSeries": false, "id": 195, "legend": { "alignAsTable": false, "avg": false, "current": true, "max": false, "min": false, "rightSide": false, "show": true, "sort": "current", "sortDesc": false, "total": false, "values": true }, "lines": true, "linewidth": 2, "links": [], "nullPointMode": "null", "options": { "alertThreshold": true }, "percentage": false, "pluginVersion": "7.5.4", "pointradius": 5, "points": false, "renderer": "flot", "seriesOverrides": [ { "alias": "Total", "color": "#C4162A", "fill": 0 }, { "alias": "Overall Average Used%", "lines": false, "pointradius": 1, "points": true, "yaxis": 2 } ], "spaceLength": 10, "stack": false, "steppedLine": false, "targets": [ { "expr": "sum(node_memory_MemTotal_bytes{origin_prometheus=~\"$origin_prometheus\",job=~\"$job\"})", "format": "time_series", "hide": false, "instant": false, "interval": "30m", "intervalFactor": 1, "legendFormat": "Total", "refId": "A", "step": 4 }, { "expr": "sum(node_memory_MemTotal_bytes{origin_prometheus=~\"$origin_prometheus\",job=~\"$job\"} - node_memory_MemAvailable_bytes{origin_prometheus=~\"$origin_prometheus\",job=~\"$job\"})", "format": "time_series", "hide": false, "interval": "30m", "intervalFactor": 1, "legendFormat": "Total Used", "refId": "B", "step": 4 }, { "expr": "(sum(node_memory_MemTotal_bytes{origin_prometheus=~\"$origin_prometheus\",job=~\"$job\"} - node_memory_MemAvailable_bytes{origin_prometheus=~\"$origin_prometheus\",job=~\"$job\"}) / sum(node_memory_MemTotal_bytes{origin_prometheus=~\"$origin_prometheus\",job=~\"$job\"}))*100", "format": "time_series", "hide": false, "interval": "30m", "intervalFactor": 1, "legendFormat": "Overall Average Used%", "refId": "H" } ], "thresholds": [], "timeFrom": null, "timeRegions": [], "timeShift": null, "title": "$job:Overall total memory & average memory used%", "tooltip": { "shared": true, "sort": 2, "value_type": "individual" }, "type": "graph", "xaxis": { "buckets": null, "mode": "time", "name": null, "show": true, "values": [] }, "yaxes": [ { "decimals": null, "format": "bytes", "label": "Total", "logBase": 1, "max": null, "min": "0", "show": true }, { "decimals": null, "format": "percent", "label": "Overall Average Used%", "logBase": 1, "max": null, "min": null, "show": true } ], "yaxis": { "align": false, "alignLevel": null } }, { "aliasColors": {}, "bars": false, "dashLength": 10, "dashes": false, "datasource": "prometheus", "decimals": 1, "description": "", "fieldConfig": { "defaults": { "links": [] }, "overrides": [] }, "fill": 0, "fillGradient": 0, "gridPos": { "h": 7, "w": 8, "x": 16, "y": 8 }, "hiddenSeries": false, "id": 197, "legend": { "alignAsTable": false, "avg": false, "current": true, "hideEmpty": false, "hideZero": false, "max": false, "min": false, "rightSide": false, "show": true, "sideWidth": null, "sort": "current", "sortDesc": true, "total": false, "values": true }, "lines": true, "linewidth": 2, "links": [], "nullPointMode": "null", "options": { "alertThreshold": true }, "percentage": false, "pluginVersion": "7.5.4", "pointradius": 5, "points": false, "renderer": "flot", "seriesOverrides": [ { "alias": "Overall Average Used%", "lines": false, "pointradius": 1, "points": true, "yaxis": 2 }, { "alias": "Total", "color": "#C4162A" } ], "spaceLength": 10, "stack": false, "steppedLine": false, "targets": [ { "expr": "sum(avg(node_filesystem_size_bytes{origin_prometheus=~\"$origin_prometheus\",job=~\"$job\",fstype=~\"xfs|ext.*\"})by(device,instance))", "format": "time_series", "instant": false, "interval": "30m", "intervalFactor": 1, "legendFormat": "Total", "refId": "E" }, { "expr": "sum(avg(node_filesystem_size_bytes{origin_prometheus=~\"$origin_prometheus\",job=~\"$job\",fstype=~\"xfs|ext.*\"})by(device,instance)) - sum(avg(node_filesystem_free_bytes{origin_prometheus=~\"$origin_prometheus\",job=~\"$job\",fstype=~\"xfs|ext.*\"})by(device,instance))", "format": "time_series", "instant": false, "interval": "30m", "intervalFactor": 1, "legendFormat": "Total Used", "refId": "C" }, { "expr": "(sum(avg(node_filesystem_size_bytes{origin_prometheus=~\"$origin_prometheus\",job=~\"$job\",fstype=~\"xfs|ext.*\"})by(device,instance)) - sum(avg(node_filesystem_free_bytes{origin_prometheus=~\"$origin_prometheus\",job=~\"$job\",fstype=~\"xfs|ext.*\"})by(device,instance))) *100/(sum(avg(node_filesystem_avail_bytes{origin_prometheus=~\"$origin_prometheus\",job=~\"$job\",fstype=~\"xfs|ext.*\"})by(device,instance))+(sum(avg(node_filesystem_size_bytes{origin_prometheus=~\"$origin_prometheus\",job=~\"$job\",fstype=~\"xfs|ext.*\"})by(device,instance)) - sum(avg(node_filesystem_free_bytes{origin_prometheus=~\"$origin_prometheus\",job=~\"$job\",fstype=~\"xfs|ext.*\"})by(device,instance))))", "format": "time_series", "instant": false, "interval": "30m", "intervalFactor": 1, "legendFormat": "Overall Average Used%", "refId": "A" } ], "thresholds": [], "timeFrom": null, "timeRegions": [], "timeShift": null, "title": "$job:Overall total disk & average disk used%", "tooltip": { "shared": true, "sort": 2, "value_type": "individual" }, "type": "graph", "xaxis": { "buckets": null, "mode": "time", "name": null, "show": true, "values": [] }, "yaxes": [ { "decimals": 1, "format": "bytes", "label": "Total", "logBase": 1, "max": null, "min": "0", "show": true }, { "decimals": null, "format": "percent", "label": "Overall Average Used%", "logBase": 1, "max": null, "min": null, "show": true } ], "yaxis": { "align": false, "alignLevel": null } }, { "collapsed": false, "datasource": "prometheus", "gridPos": { "h": 1, "w": 24, "x": 0, "y": 15 }, "id": 189, "panels": [], "title": "Resource Details:【$show_hostname】", "type": "row" }, { "cacheTimeout": null, "datasource": "prometheus", "description": "", "fieldConfig": { "defaults": { "decimals": 0, "mappings": [ { "id": 0, "op": "=", "text": "N/A", "type": 1, "value": "null" } ], "thresholds": { "mode": "absolute", "steps": [ { "color": "rgba(245, 54, 54, 0.9)", "value": null }, { "color": "rgba(237, 129, 40, 0.89)", "value": 1 }, { "color": "rgba(50, 172, 45, 0.97)", "value": 3 } ] }, "unit": "s" }, "overrides": [] }, "gridPos": { "h": 2, "w": 2, "x": 0, "y": 16 }, "hideTimeOverride": true, "id": 15, "interval": null, "links": [], "maxDataPoints": 100, "options": { "colorMode": "value", "graphMode": "none", "justifyMode": "auto", "orientation": "horizontal", "reduceOptions": { "calcs": [ "lastNotNull" ], "fields": "", "values": false }, "text": {}, "textMode": "auto" }, "pluginVersion": "7.5.4", "targets": [ { "expr": "avg(time() - node_boot_time_seconds{instance=~\"$node\"})", "format": "time_series", "hide": false, "instant": true, "interval": "", "intervalFactor": 1, "legendFormat": "", "refId": "A", "step": 40 } ], "title": "Uptime", "type": "stat" }, { "datasource": "prometheus", "fieldConfig": { "defaults": { "color": { "mode": "thresholds" }, "decimals": 1, "mappings": [ { "from": "", "id": 1, "operator": "", "text": "N/A", "to": "", "type": 1, "value": "0" } ], "max": 100, "min": 0.1, "thresholds": { "mode": "absolute", "steps": [ { "color": "green", "value": null }, { "color": "#EAB839", "value": 70 }, { "color": "red", "value": 90 } ] }, "unit": "percent" }, "overrides": [] }, "gridPos": { "h": 6, "w": 3, "x": 2, "y": 16 }, "id": 177, "options": { "displayMode": "lcd", "orientation": "horizontal", "reduceOptions": { "calcs": [ "last" ], "fields": "", "values": false }, "showUnfilled": true, "text": {} }, "pluginVersion": "7.5.4", "targets": [ { "expr": "100 - (avg(rate(node_cpu_seconds_total{instance=~\"$node\",mode=\"idle\"}[$interval])) * 100)", "instant": true, "interval": "", "legendFormat": "CPU Busy", "refId": "A" }, { "expr": "avg(rate(node_cpu_seconds_total{instance=~\"$node\",mode=\"iowait\"}[$interval])) * 100", "hide": true, "instant": true, "interval": "", "legendFormat": "IOwait使用率", "refId": "C" }, { "expr": "(1 - (node_memory_MemAvailable_bytes{instance=~\"$node\"} / (node_memory_MemTotal_bytes{instance=~\"$node\"})))* 100", "instant": true, "interval": "", "legendFormat": "Used RAM Memory", "refId": "B" }, { "expr": "(node_filesystem_size_bytes{instance=~'$node',fstype=~\"ext.*|xfs\",mountpoint=\"$maxmount\"}-node_filesystem_free_bytes{instance=~'$node',fstype=~\"ext.*|xfs\",mountpoint=\"$maxmount\"})*100 /(node_filesystem_avail_bytes {instance=~'$node',fstype=~\"ext.*|xfs\",mountpoint=\"$maxmount\"}+(node_filesystem_size_bytes{instance=~'$node',fstype=~\"ext.*|xfs\",mountpoint=\"$maxmount\"}-node_filesystem_free_bytes{instance=~'$node',fstype=~\"ext.*|xfs\",mountpoint=\"$maxmount\"}))", "hide": false, "instant": true, "interval": "", "legendFormat": "Used Max Mount($maxmount)", "refId": "D" }, { "expr": "(1 - ((node_memory_SwapFree_bytes{instance=~\"$node\"} + 1)/ (node_memory_SwapTotal_bytes{instance=~\"$node\"} + 1))) * 100", "instant": true, "interval": "", "legendFormat": "Used SWAP", "refId": "F" } ], "timeFrom": null, "timeShift": null, "transformations": [], "type": "bargauge" }, { "columns": [], "datasource": "prometheus", "description": "In this kanban: the total disk, usage, available, and usage rate are consistent with the values of the Size, Used, Avail, and Use% columns of the df command, and the value of Use% will be rounded to one decimal place, which will be more accurate .\n\nNote: The Use% algorithm in df is: (size-free) * 100 / (avail + (size-free)), the result is divisible by this value, non-divisible by this value is +1, and the unit of the result is %.\nRefer to the df command source code:", "fieldConfig": { "defaults": {}, "overrides": [] }, "fontSize": "80%", "gridPos": { "h": 6, "w": 10, "x": 5, "y": 16 }, "id": 181, "links": [ { "targetBlank": true, "title": "https://github.com/coreutils/coreutils/blob/master/src/df.c", "url": "https://github.com/coreutils/coreutils/blob/master/src/df.c" } ], "pageSize": null, "scroll": true, "showHeader": true, "sort": { "col": 6, "desc": false }, "styles": [ { "alias": "Mounted on", "align": "auto", "colorMode": null, "colors": [ "rgba(50, 172, 45, 0.97)", "rgba(237, 129, 40, 0.89)", "rgba(245, 54, 54, 0.9)" ], "dateFormat": "YYYY-MM-DD HH:mm:ss", "decimals": 2, "mappingType": 1, "pattern": "mountpoint", "thresholds": [ "" ], "type": "string", "unit": "bytes" }, { "alias": "Avail", "align": "auto", "colorMode": "value", "colors": [ "rgba(245, 54, 54, 0.9)", "rgba(237, 129, 40, 0.89)", "rgba(50, 172, 45, 0.97)" ], "dateFormat": "YYYY-MM-DD HH:mm:ss", "decimals": 1, "mappingType": 1, "pattern": "Value #A", "thresholds": [ "10000000000", "20000000000" ], "type": "number", "unit": "bytes" }, { "alias": "Used", "align": "auto", "colorMode": "cell", "colors": [ "rgba(50, 172, 45, 0.97)", "rgba(237, 129, 40, 0.89)", "rgba(245, 54, 54, 0.9)" ], "dateFormat": "YYYY-MM-DD HH:mm:ss", "decimals": 1, "mappingType": 1, "pattern": "Value #B", "thresholds": [ "70", "85" ], "type": "number", "unit": "percent" }, { "alias": "Size", "align": "auto", "colorMode": null, "colors": [ "rgba(245, 54, 54, 0.9)", "rgba(237, 129, 40, 0.89)", "rgba(50, 172, 45, 0.97)" ], "dateFormat": "YYYY-MM-DD HH:mm:ss", "decimals": 0, "link": false, "mappingType": 1, "pattern": "Value #C", "thresholds": [], "type": "number", "unit": "bytes" }, { "alias": "Filesystem", "align": "auto", "colorMode": null, "colors": [ "rgba(245, 54, 54, 0.9)", "rgba(237, 129, 40, 0.89)", "rgba(50, 172, 45, 0.97)" ], "dateFormat": "YYYY-MM-DD HH:mm:ss", "decimals": 2, "link": false, "mappingType": 1, "pattern": "fstype", "thresholds": [], "type": "string", "unit": "short" }, { "alias": "Device", "align": "auto", "colorMode": null, "colors": [ "rgba(245, 54, 54, 0.9)", "rgba(237, 129, 40, 0.89)", "rgba(50, 172, 45, 0.97)" ], "dateFormat": "YYYY-MM-DD HH:mm:ss", "decimals": 2, "link": false, "mappingType": 1, "pattern": "device", "preserveFormat": false, "sanitize": false, "thresholds": [], "type": "string", "unit": "short" }, { "alias": "", "align": "auto", "colorMode": null, "colors": [ "rgba(245, 54, 54, 0.9)", "rgba(237, 129, 40, 0.89)", "rgba(50, 172, 45, 0.97)" ], "decimals": 2, "pattern": "/.*/", "preserveFormat": true, "sanitize": false, "thresholds": [], "type": "hidden", "unit": "short" } ], "targets": [ { "expr": "node_filesystem_size_bytes{instance=~'$node',fstype=~\"ext.*|xfs\",mountpoint !~\".*pod.*\"}-0", "format": "table", "hide": false, "instant": true, "interval": "", "intervalFactor": 1, "legendFormat": "总量", "refId": "C" }, { "expr": "node_filesystem_avail_bytes {instance=~'$node',fstype=~\"ext.*|xfs\",mountpoint !~\".*pod.*\"}-0", "format": "table", "hide": false, "instant": true, "interval": "10s", "intervalFactor": 1, "legendFormat": "", "refId": "A" }, { "expr": "(node_filesystem_size_bytes{instance=~'$node',fstype=~\"ext.*|xfs\",mountpoint !~\".*pod.*\"}-node_filesystem_free_bytes{instance=~'$node',fstype=~\"ext.*|xfs\",mountpoint !~\".*pod.*\"}) *100/(node_filesystem_avail_bytes {instance=~'$node',fstype=~\"ext.*|xfs\",mountpoint !~\".*pod.*\"}+(node_filesystem_size_bytes{instance=~'$node',fstype=~\"ext.*|xfs\",mountpoint !~\".*pod.*\"}-node_filesystem_free_bytes{instance=~'$node',fstype=~\"ext.*|xfs\",mountpoint !~\".*pod.*\"}))", "format": "table", "hide": false, "instant": true, "interval": "", "intervalFactor": 1, "legendFormat": "", "refId": "B" } ], "title": "【$show_hostname】:Disk Space Used Basic(EXT?/XFS)", "transform": "table", "type": "table-old" }, { "cacheTimeout": null, "datasource": "prometheus", "description": "", "fieldConfig": { "defaults": { "decimals": 2, "mappings": [ { "id": 0, "op": "=", "text": "N/A", "type": 1, "value": "null" } ], "thresholds": { "mode": "absolute", "steps": [ { "color": "rgba(50, 172, 45, 0.97)", "value": null }, { "color": "rgba(237, 129, 40, 0.89)", "value": 20 }, { "color": "#d44a3a", "value": 50 } ] }, "unit": "percent" }, "overrides": [] }, "gridPos": { "h": 2, "w": 2, "x": 15, "y": 16 }, "id": 20, "interval": null, "links": [], "maxDataPoints": 100, "options": { "colorMode": "value", "graphMode": "area", "justifyMode": "auto", "orientation": "horizontal", "reduceOptions": { "calcs": [ "last" ], "fields": "", "values": false }, "text": {}, "textMode": "auto" }, "pluginVersion": "7.5.4", "targets": [ { "expr": "avg(rate(node_cpu_seconds_total{instance=~\"$node\",mode=\"iowait\"}[$interval])) * 100", "format": "time_series", "hide": false, "instant": false, "interval": "", "intervalFactor": 1, "legendFormat": "", "refId": "A", "step": 20 } ], "timeFrom": null, "timeShift": null, "title": "CPU iowait", "type": "stat" }, { "aliasColors": { "cn-shenzhen.i-wz9cq1dcb6zwc39ehw59_cni0_in": "light-red", "cn-shenzhen.i-wz9cq1dcb6zwc39ehw59_cni0_in下载": "green", "cn-shenzhen.i-wz9cq1dcb6zwc39ehw59_cni0_out上传": "yellow", "cn-shenzhen.i-wz9cq1dcb6zwc39ehw59_eth0_in下载": "purple", "cn-shenzhen.i-wz9cq1dcb6zwc39ehw59_eth0_out": "purple", "cn-shenzhen.i-wz9cq1dcb6zwc39ehw59_eth0_out上传": "blue" }, "bars": true, "dashLength": 10, "dashes": false, "datasource": "prometheus", "editable": true, "error": false, "fieldConfig": { "defaults": { "links": [] }, "overrides": [] }, "fill": 1, "fillGradient": 0, "grid": {}, "gridPos": { "h": 6, "w": 7, "x": 17, "y": 16 }, "hiddenSeries": false, "id": 183, "legend": { "alignAsTable": true, "avg": true, "current": true, "hideEmpty": true, "hideZero": true, "max": true, "min": false, "show": false, "sort": "current", "sortDesc": true, "total": true, "values": true }, "lines": false, "linewidth": 2, "links": [], "nullPointMode": "null as zero", "options": { "alertThreshold": true }, "percentage": false, "pluginVersion": "7.5.4", "pointradius": 1, "points": false, "renderer": "flot", "repeat": null, "seriesOverrides": [ { "alias": "/.*_transmit$/", "transform": "negative-Y" } ], "spaceLength": 10, "stack": false, "steppedLine": false, "targets": [ { "expr": "increase(node_network_receive_bytes_total{instance=~\"$node\",device=~\"$device\"}[60m])", "interval": "60m", "intervalFactor": 1, "legendFormat": "{{device}}_receive", "metric": "", "refId": "A", "step": 600, "target": "" }, { "expr": "increase(node_network_transmit_bytes_total{instance=~\"$node\",device=~\"$device\"}[60m])", "hide": false, "interval": "60m", "intervalFactor": 1, "legendFormat": "{{device}}_transmit", "refId": "B", "step": 600 } ], "thresholds": [], "timeFrom": null, "timeRegions": [], "timeShift": null, "title": "Internet traffic per hour $device", "tooltip": { "msResolution": false, "shared": true, "sort": 0, "value_type": "cumulative" }, "type": "graph", "xaxis": { "buckets": null, "mode": "time", "name": null, "show": true, "values": [] }, "yaxes": [ { "format": "bytes", "label": "transmit(-)/receive(+)", "logBase": 1, "max": null, "min": null, "show": true }, { "format": "short", "logBase": 1, "max": null, "min": null, "show": false } ], "yaxis": { "align": false, "alignLevel": null } }, { "cacheTimeout": null, "datasource": "prometheus", "description": "", "fieldConfig": { "defaults": { "mappings": [ { "id": 0, "op": "=", "text": "N/A", "type": 1, "value": "null" } ], "thresholds": { "mode": "absolute", "steps": [ { "color": "rgba(245, 54, 54, 0.9)", "value": null }, { "color": "rgba(237, 129, 40, 0.89)", "value": 1 }, { "color": "rgba(50, 172, 45, 0.97)", "value": 2 } ] }, "unit": "short" }, "overrides": [] }, "gridPos": { "h": 2, "w": 2, "x": 0, "y": 18 }, "id": 14, "interval": null, "links": [], "maxDataPoints": 100, "options": { "colorMode": "value", "graphMode": "none", "justifyMode": "auto", "orientation": "horizontal", "reduceOptions": { "calcs": [ "lastNotNull" ], "fields": "", "values": false }, "text": {}, "textMode": "value" }, "pluginVersion": "7.5.4", "targets": [ { "expr": "count(node_cpu_seconds_total{instance=~\"$node\", mode='system'})", "format": "time_series", "instant": true, "interval": "", "intervalFactor": 1, "legendFormat": "", "refId": "A", "step": 20 } ], "title": "CPU Cores", "type": "stat" }, { "cacheTimeout": null, "datasource": "prometheus", "description": "", "fieldConfig": { "defaults": { "mappings": [ { "id": 0, "op": "=", "text": "N/A", "type": 1, "value": "null" } ], "thresholds": { "mode": "absolute", "steps": [ { "color": "rgba(245, 54, 54, 0.9)", "value": null }, { "color": "rgba(237, 129, 40, 0.89)", "value": 100000 }, { "color": "rgba(50, 172, 45, 0.97)", "value": 1000000 } ] }, "unit": "short" }, "overrides": [] }, "gridPos": { "h": 2, "w": 2, "x": 15, "y": 18 }, "id": 179, "interval": null, "links": [], "maxDataPoints": 100, "options": { "colorMode": "value", "graphMode": "none", "justifyMode": "auto", "orientation": "horizontal", "reduceOptions": { "calcs": [ "lastNotNull" ], "fields": "", "values": false }, "text": {}, "textMode": "auto" }, "pluginVersion": "7.5.4", "targets": [ { "expr": "avg(node_filesystem_files_free{instance=~\"$node\",mountpoint=\"$maxmount\",fstype=~\"ext.?|xfs\"})", "format": "time_series", "instant": true, "interval": "", "intervalFactor": 1, "legendFormat": "", "refId": "A", "step": 20 } ], "title": "Free inodes:$maxmount ", "type": "stat" }, { "cacheTimeout": null, "datasource": "prometheus", "description": "", "fieldConfig": { "defaults": { "decimals": 0, "mappings": [ { "id": 0, "op": "=", "text": "N/A", "type": 1, "value": "null" } ], "thresholds": { "mode": "absolute", "steps": [ { "color": "rgba(245, 54, 54, 0.9)", "value": null }, { "color": "rgba(237, 129, 40, 0.89)", "value": 2 }, { "color": "rgba(50, 172, 45, 0.97)", "value": 3 } ] }, "unit": "bytes" }, "overrides": [] }, "gridPos": { "h": 2, "w": 2, "x": 0, "y": 20 }, "id": 75, "interval": null, "links": [], "maxDataPoints": 100, "options": { "colorMode": "value", "graphMode": "none", "justifyMode": "auto", "orientation": "horizontal", "reduceOptions": { "calcs": [ "lastNotNull" ], "fields": "", "values": false }, "text": {}, "textMode": "auto" }, "pluginVersion": "7.5.4", "targets": [ { "expr": "sum(node_memory_MemTotal_bytes{instance=~\"$node\"})", "format": "time_series", "instant": true, "interval": "", "intervalFactor": 1, "legendFormat": "{{instance}}", "refId": "A", "step": 20 } ], "title": "Total RAM", "type": "stat" }, { "cacheTimeout": null, "datasource": "prometheus", "description": "", "fieldConfig": { "defaults": { "mappings": [ { "id": 0, "op": "=", "text": "N/A", "type": 1, "value": "null" } ], "thresholds": { "mode": "absolute", "steps": [ { "color": "rgba(245, 54, 54, 0.9)", "value": null }, { "color": "rgba(237, 129, 40, 0.89)", "value": 1024 }, { "color": "rgba(50, 172, 45, 0.97)", "value": 10000 } ] }, "unit": "locale" }, "overrides": [] }, "gridPos": { "h": 2, "w": 2, "x": 15, "y": 20 }, "id": 178, "interval": null, "links": [], "maxDataPoints": 100, "options": { "colorMode": "value", "graphMode": "none", "justifyMode": "auto", "orientation": "horizontal", "reduceOptions": { "calcs": [ "lastNotNull" ], "fields": "", "values": false }, "text": {}, "textMode": "auto" }, "pluginVersion": "7.5.4", "targets": [ { "expr": "avg(node_filefd_maximum{instance=~\"$node\"})", "format": "time_series", "instant": true, "intervalFactor": 1, "legendFormat": "", "refId": "A", "step": 20 } ], "title": "Total filefd", "type": "stat" }, { "aliasColors": { "192.168.200.241:9100_Total": "dark-red", "Idle - Waiting for something to happen": "#052B51", "guest": "#9AC48A", "idle": "#052B51", "iowait": "#EAB839", "irq": "#BF1B00", "nice": "#C15C17", "sdb_每秒I/O操作%": "#d683ce", "softirq": "#E24D42", "steal": "#FCE2DE", "system": "#508642", "user": "#5195CE", "磁盘花费在I/O操作占比": "#ba43a9" }, "bars": false, "dashLength": 10, "dashes": false, "datasource": "prometheus", "decimals": 2, "description": "", "fieldConfig": { "defaults": { "links": [] }, "overrides": [] }, "fill": 1, "fillGradient": 0, "gridPos": { "h": 8, "w": 8, "x": 0, "y": 22 }, "hiddenSeries": false, "id": 7, "legend": { "alignAsTable": true, "avg": true, "current": true, "hideEmpty": true, "hideZero": true, "max": true, "min": true, "rightSide": false, "show": true, "sideWidth": null, "sort": "current", "sortDesc": true, "total": false, "values": true }, "lines": true, "linewidth": 2, "links": [], "maxPerRow": 6, "nullPointMode": "null", "options": { "alertThreshold": true }, "percentage": false, "pluginVersion": "7.5.4", "pointradius": 5, "points": false, "renderer": "flot", "repeat": null, "seriesOverrides": [ { "alias": "/.*Total/", "color": "#C4162A", "fill": 0 } ], "spaceLength": 10, "stack": false, "steppedLine": false, "targets": [ { "expr": "avg(rate(node_cpu_seconds_total{instance=~\"$node\",mode=\"system\"}[$interval])) by (instance) *100", "format": "time_series", "hide": false, "instant": false, "interval": "", "intervalFactor": 1, "legendFormat": "System", "refId": "A", "step": 20 }, { "expr": "avg(rate(node_cpu_seconds_total{instance=~\"$node\",mode=\"user\"}[$interval])) by (instance) *100", "format": "time_series", "hide": false, "interval": "", "intervalFactor": 1, "legendFormat": "User", "refId": "B", "step": 240 }, { "expr": "avg(rate(node_cpu_seconds_total{instance=~\"$node\",mode=\"iowait\"}[$interval])) by (instance) *100", "format": "time_series", "hide": false, "instant": false, "interval": "", "intervalFactor": 1, "legendFormat": "Iowait", "refId": "D", "step": 240 }, { "expr": "(1 - avg(rate(node_cpu_seconds_total{instance=~\"$node\",mode=\"idle\"}[$interval])) by (instance))*100", "format": "time_series", "hide": false, "interval": "", "intervalFactor": 1, "legendFormat": "Total", "refId": "F", "step": 240 } ], "thresholds": [], "timeFrom": null, "timeRegions": [], "timeShift": null, "title": "CPU% Basic", "tooltip": { "shared": true, "sort": 2, "value_type": "individual" }, "type": "graph", "xaxis": { "buckets": null, "mode": "time", "name": null, "show": true, "values": [] }, "yaxes": [ { "decimals": 0, "format": "percent", "label": "", "logBase": 1, "max": null, "min": null, "show": true }, { "format": "short", "label": null, "logBase": 1, "max": null, "min": null, "show": false } ], "yaxis": { "align": false, "alignLevel": null } }, { "aliasColors": { "192.168.200.241:9100_总内存": "dark-red", "使用率": "yellow", "内存_Avaliable": "#6ED0E0", "内存_Cached": "#EF843C", "内存_Free": "#629E51", "内存_Total": "#6d1f62", "内存_Used": "#eab839", "可用": "#9ac48a", "总内存": "#bf1b00" }, "bars": false, "dashLength": 10, "dashes": false, "datasource": "prometheus", "decimals": 2, "fieldConfig": { "defaults": { "links": [] }, "overrides": [] }, "fill": 1, "fillGradient": 0, "gridPos": { "h": 8, "w": 8, "x": 8, "y": 22 }, "height": "300", "hiddenSeries": false, "id": 156, "legend": { "alignAsTable": true, "avg": true, "current": true, "hideEmpty": true, "hideZero": true, "max": true, "min": true, "rightSide": false, "show": true, "sort": "current", "sortDesc": true, "total": false, "values": true }, "lines": true, "linewidth": 2, "links": [], "nullPointMode": "null", "options": { "alertThreshold": true }, "percentage": false, "pluginVersion": "7.5.4", "pointradius": 5, "points": false, "renderer": "flot", "seriesOverrides": [ { "alias": "Total", "color": "#C4162A", "fill": 0 }, { "alias": "Used%", "color": "rgb(0, 209, 255)", "lines": false, "pointradius": 1, "points": true, "yaxis": 2 } ], "spaceLength": 10, "stack": false, "steppedLine": false, "targets": [ { "expr": "node_memory_MemTotal_bytes{instance=~\"$node\"}", "format": "time_series", "hide": false, "instant": false, "interval": "", "intervalFactor": 1, "legendFormat": "Total", "refId": "A", "step": 4 }, { "expr": "node_memory_MemTotal_bytes{instance=~\"$node\"} - node_memory_MemAvailable_bytes{instance=~\"$node\"}", "format": "time_series", "hide": false, "interval": "", "intervalFactor": 1, "legendFormat": "Used", "refId": "B", "step": 4 }, { "expr": "node_memory_MemAvailable_bytes{instance=~\"$node\"}", "format": "time_series", "hide": false, "interval": "", "intervalFactor": 1, "legendFormat": "Avaliable", "refId": "F", "step": 4 }, { "expr": "node_memory_Buffers_bytes{instance=~\"$node\"}", "format": "time_series", "hide": true, "interval": "", "intervalFactor": 1, "legendFormat": "内存_Buffers", "refId": "D", "step": 4 }, { "expr": "node_memory_MemFree_bytes{instance=~\"$node\"}", "format": "time_series", "hide": true, "intervalFactor": 1, "legendFormat": "内存_Free", "refId": "C", "step": 4 }, { "expr": "node_memory_Cached_bytes{instance=~\"$node\"}", "format": "time_series", "hide": true, "intervalFactor": 1, "legendFormat": "内存_Cached", "refId": "E", "step": 4 }, { "expr": "node_memory_MemTotal_bytes{instance=~\"$node\"} - (node_memory_Cached_bytes{instance=~\"$node\"} + node_memory_Buffers_bytes{instance=~\"$node\"} + node_memory_MemFree_bytes{instance=~\"$node\"})", "format": "time_series", "hide": true, "intervalFactor": 1, "refId": "G" }, { "expr": "(1 - (node_memory_MemAvailable_bytes{instance=~\"$node\"} / (node_memory_MemTotal_bytes{instance=~\"$node\"})))* 100", "format": "time_series", "hide": false, "interval": "30m", "intervalFactor": 10, "legendFormat": "Used%", "refId": "H" } ], "thresholds": [], "timeFrom": null, "timeRegions": [], "timeShift": null, "title": "Memory Basic", "tooltip": { "shared": true, "sort": 2, "value_type": "individual" }, "type": "graph", "xaxis": { "buckets": null, "mode": "time", "name": null, "show": true, "values": [] }, "yaxes": [ { "format": "bytes", "label": null, "logBase": 1, "max": null, "min": "0", "show": true }, { "format": "percent", "label": "Utilization%", "logBase": 1, "max": "100", "min": "0", "show": true } ], "yaxis": { "align": false, "alignLevel": null } }, { "aliasColors": { "192.168.10.227:9100_em1_in下载": "super-light-green", "192.168.10.227:9100_em1_out上传": "dark-blue" }, "bars": false, "dashLength": 10, "dashes": false, "datasource": "prometheus", "decimals": 2, "fieldConfig": { "defaults": { "links": [] }, "overrides": [] }, "fill": 1, "fillGradient": 0, "gridPos": { "h": 8, "w": 8, "x": 16, "y": 22 }, "height": "300", "hiddenSeries": false, "id": 157, "legend": { "alignAsTable": true, "avg": true, "current": true, "hideEmpty": true, "hideZero": true, "max": true, "min": true, "rightSide": false, "show": true, "sort": "current", "sortDesc": true, "total": false, "values": true }, "lines": true, "linewidth": 1, "links": [], "nullPointMode": "null", "options": { "alertThreshold": true }, "percentage": false, "pluginVersion": "7.5.4", "pointradius": 2, "points": false, "renderer": "flot", "seriesOverrides": [ { "alias": "/.*_transmit$/", "transform": "negative-Y" } ], "spaceLength": 10, "stack": false, "steppedLine": false, "targets": [ { "expr": "rate(node_network_receive_bytes_total{instance=~'$node',device=~\"$device\"}[$interval])*8", "format": "time_series", "interval": "", "intervalFactor": 1, "legendFormat": "{{device}}_receive", "refId": "A", "step": 4 }, { "expr": "rate(node_network_transmit_bytes_total{instance=~'$node',device=~\"$device\"}[$interval])*8", "format": "time_series", "interval": "", "intervalFactor": 1, "legendFormat": "{{device}}_transmit", "refId": "B", "step": 4 } ], "thresholds": [], "timeFrom": null, "timeRegions": [], "timeShift": null, "title": "Network bandwidth usage per second $device", "tooltip": { "shared": true, "sort": 2, "value_type": "individual" }, "type": "graph", "xaxis": { "buckets": null, "mode": "time", "name": null, "show": true, "values": [] }, "yaxes": [ { "format": "bps", "label": "transmit(-)/receive(+)", "logBase": 1, "max": null, "min": null, "show": true }, { "format": "short", "label": null, "logBase": 1, "max": null, "min": null, "show": false } ], "yaxis": { "align": false, "alignLevel": null } }, { "aliasColors": { "15分钟": "#6ED0E0", "1分钟": "#BF1B00", "5分钟": "#CCA300" }, "bars": false, "dashLength": 10, "dashes": false, "datasource": "prometheus", "decimals": 2, "editable": true, "error": false, "fieldConfig": { "defaults": { "links": [] }, "overrides": [] }, "fill": 1, "fillGradient": 1, "grid": {}, "gridPos": { "h": 8, "w": 8, "x": 0, "y": 30 }, "height": "300", "hiddenSeries": false, "id": 13, "legend": { "alignAsTable": true, "avg": true, "current": true, "hideEmpty": true, "hideZero": true, "max": true, "min": true, "rightSide": false, "show": true, "sort": "current", "sortDesc": true, "total": false, "values": true }, "lines": true, "linewidth": 2, "links": [], "maxPerRow": 6, "nullPointMode": "null", "options": { "alertThreshold": true }, "percentage": false, "pluginVersion": "7.5.4", "pointradius": 5, "points": false, "renderer": "flot", "repeat": null, "seriesOverrides": [ { "alias": "/.*CPU cores/", "color": "#C4162A" } ], "spaceLength": 10, "stack": false, "steppedLine": false, "targets": [ { "expr": "node_load1{instance=~\"$node\"}", "format": "time_series", "instant": false, "interval": "", "intervalFactor": 1, "legendFormat": "1m", "metric": "", "refId": "A", "step": 20, "target": "" }, { "expr": "node_load5{instance=~\"$node\"}", "format": "time_series", "instant": false, "interval": "", "intervalFactor": 1, "legendFormat": "5m", "refId": "B", "step": 20 }, { "expr": "node_load15{instance=~\"$node\"}", "format": "time_series", "instant": false, "interval": "", "intervalFactor": 1, "legendFormat": "15m", "refId": "C", "step": 20 }, { "expr": " sum(count(node_cpu_seconds_total{instance=~\"$node\", mode='system'}) by (cpu,instance)) by(instance)", "format": "time_series", "instant": false, "interval": "", "intervalFactor": 1, "legendFormat": "CPU cores", "refId": "D", "step": 20 } ], "thresholds": [], "timeFrom": null, "timeRegions": [], "timeShift": null, "title": "System Load", "tooltip": { "msResolution": false, "shared": true, "sort": 2, "value_type": "cumulative" }, "type": "graph", "xaxis": { "buckets": null, "mode": "time", "name": null, "show": true, "values": [] }, "yaxes": [ { "format": "short", "logBase": 1, "max": null, "min": null, "show": true }, { "format": "short", "logBase": 1, "max": null, "min": null, "show": true } ], "yaxis": { "align": false, "alignLevel": null } }, { "aliasColors": { "vda_write": "#6ED0E0" }, "bars": false, "dashLength": 10, "dashes": false, "datasource": "prometheus", "decimals": 2, "description": "Per second read / write bytes ", "fieldConfig": { "defaults": { "links": [] }, "overrides": [] }, "fill": 1, "fillGradient": 1, "gridPos": { "h": 8, "w": 8, "x": 8, "y": 30 }, "height": "300", "hiddenSeries": false, "id": 168, "legend": { "alignAsTable": true, "avg": true, "current": true, "hideEmpty": true, "hideZero": true, "max": true, "min": true, "show": true, "sort": "current", "sortDesc": true, "total": false, "values": true }, "lines": true, "linewidth": 2, "links": [], "nullPointMode": "null", "options": { "alertThreshold": true }, "percentage": false, "pluginVersion": "7.5.4", "pointradius": 5, "points": false, "renderer": "flot", "seriesOverrides": [ { "alias": "/.*_Read bytes$/", "transform": "negative-Y" } ], "spaceLength": 10, "stack": false, "steppedLine": false, "targets": [ { "expr": "rate(node_disk_read_bytes_total{instance=~\"$node\"}[$interval])", "format": "time_series", "interval": "", "intervalFactor": 1, "legendFormat": "{{device}}_Read bytes", "refId": "A", "step": 10 }, { "expr": "rate(node_disk_written_bytes_total{instance=~\"$node\"}[$interval])", "format": "time_series", "hide": false, "interval": "", "intervalFactor": 1, "legendFormat": "{{device}}_Written bytes", "refId": "B", "step": 10 } ], "thresholds": [], "timeFrom": null, "timeRegions": [], "timeShift": null, "title": "Disk R/W Data", "tooltip": { "shared": true, "sort": 2, "value_type": "individual" }, "type": "graph", "xaxis": { "buckets": null, "mode": "time", "name": null, "show": true, "values": [] }, "yaxes": [ { "decimals": null, "format": "Bps", "label": "Bytes read (-) / write (+)", "logBase": 1, "max": null, "min": null, "show": true }, { "format": "short", "label": null, "logBase": 1, "max": null, "min": null, "show": false } ], "yaxis": { "align": false, "alignLevel": null } }, { "aliasColors": {}, "bars": false, "dashLength": 10, "dashes": false, "datasource": "prometheus", "decimals": 1, "description": "", "fieldConfig": { "defaults": { "links": [] }, "overrides": [] }, "fill": 0, "fillGradient": 0, "gridPos": { "h": 8, "w": 8, "x": 16, "y": 30 }, "hiddenSeries": false, "id": 174, "legend": { "alignAsTable": true, "avg": true, "current": true, "hideEmpty": true, "hideZero": true, "max": true, "min": true, "rightSide": false, "show": true, "sideWidth": null, "sort": "current", "sortDesc": true, "total": false, "values": true }, "lines": true, "linewidth": 2, "links": [], "nullPointMode": "null", "options": { "alertThreshold": true }, "percentage": false, "pluginVersion": "7.5.4", "pointradius": 5, "points": false, "renderer": "flot", "seriesOverrides": [ { "alias": "/Inodes.*/", "yaxis": 2 } ], "spaceLength": 10, "stack": false, "steppedLine": false, "targets": [ { "expr": "(node_filesystem_size_bytes{instance=~'$node',fstype=~\"ext.*|xfs\",mountpoint !~\".*pod.*\"}-node_filesystem_free_bytes{instance=~'$node',fstype=~\"ext.*|xfs\",mountpoint !~\".*pod.*\"}) *100/(node_filesystem_avail_bytes {instance=~'$node',fstype=~\"ext.*|xfs\",mountpoint !~\".*pod.*\"}+(node_filesystem_size_bytes{instance=~'$node',fstype=~\"ext.*|xfs\",mountpoint !~\".*pod.*\"}-node_filesystem_free_bytes{instance=~'$node',fstype=~\"ext.*|xfs\",mountpoint !~\".*pod.*\"}))", "format": "time_series", "instant": false, "interval": "", "intervalFactor": 1, "legendFormat": "{{mountpoint}}", "refId": "A" }, { "expr": "node_filesystem_files_free{instance=~'$node',fstype=~\"ext.?|xfs\"} / node_filesystem_files{instance=~'$node',fstype=~\"ext.?|xfs\"}", "hide": true, "interval": "", "legendFormat": "Inodes:{{instance}}:{{mountpoint}}", "refId": "B" } ], "thresholds": [], "timeFrom": null, "timeRegions": [], "timeShift": null, "title": "Disk Space Used% Basic", "tooltip": { "shared": true, "sort": 2, "value_type": "individual" }, "type": "graph", "xaxis": { "buckets": null, "mode": "time", "name": null, "show": true, "values": [] }, "yaxes": [ { "decimals": null, "format": "percent", "label": "", "logBase": 1, "max": "100", "min": "0", "show": true }, { "decimals": 2, "format": "percentunit", "label": null, "logBase": 1, "max": "1", "min": null, "show": false } ], "yaxis": { "align": false, "alignLevel": null } }, { "aliasColors": { "vda_write": "#6ED0E0" }, "bars": false, "dashLength": 10, "dashes": false, "datasource": "prometheus", "decimals": 2, "description": "Read/write completions per second\n\nWrites completed: 每个磁盘分区每秒写完成次数\n\nIO now 每个磁盘分区每秒正在处理的输入/输出请求数", "fieldConfig": { "defaults": { "links": [] }, "overrides": [] }, "fill": 0, "fillGradient": 0, "gridPos": { "h": 9, "w": 8, "x": 0, "y": 38 }, "height": "300", "hiddenSeries": false, "id": 161, "legend": { "alignAsTable": true, "avg": true, "current": true, "hideEmpty": true, "hideZero": true, "max": true, "min": true, "show": true, "sort": "max", "sortDesc": false, "total": false, "values": true }, "lines": true, "linewidth": 1, "links": [], "nullPointMode": "null", "options": { "alertThreshold": true }, "percentage": false, "pluginVersion": "7.5.4", "pointradius": 5, "points": false, "renderer": "flot", "seriesOverrides": [ { "alias": "/.*_Reads completed$/", "transform": "negative-Y" } ], "spaceLength": 10, "stack": false, "steppedLine": false, "targets": [ { "expr": "rate(node_disk_reads_completed_total{instance=~\"$node\"}[$interval])", "format": "time_series", "hide": false, "interval": "", "intervalFactor": 1, "legendFormat": "{{device}}_Reads completed", "refId": "A", "step": 10 }, { "expr": "rate(node_disk_writes_completed_total{instance=~\"$node\"}[$interval])", "format": "time_series", "hide": false, "interval": "", "intervalFactor": 1, "legendFormat": "{{device}}_Writes completed", "refId": "B", "step": 10 }, { "expr": "node_disk_io_now{instance=~\"$node\"}", "format": "time_series", "hide": true, "interval": "", "intervalFactor": 1, "legendFormat": "{{device}}", "refId": "C" } ], "thresholds": [], "timeFrom": null, "timeRegions": [], "timeShift": null, "title": "Disk IOps Completed(IOPS)", "tooltip": { "shared": true, "sort": 2, "value_type": "individual" }, "type": "graph", "xaxis": { "buckets": null, "mode": "time", "name": null, "show": true, "values": [] }, "yaxes": [ { "decimals": null, "format": "iops", "label": "IO read (-) / write (+)", "logBase": 1, "max": null, "min": null, "show": true }, { "format": "short", "label": null, "logBase": 1, "max": null, "min": null, "show": true } ], "yaxis": { "align": false, "alignLevel": null } }, { "aliasColors": { "Idle - Waiting for something to happen": "#052B51", "guest": "#9AC48A", "idle": "#052B51", "iowait": "#EAB839", "irq": "#BF1B00", "nice": "#C15C17", "sdb_每秒I/O操作%": "#d683ce", "softirq": "#E24D42", "steal": "#FCE2DE", "system": "#508642", "user": "#5195CE", "磁盘花费在I/O操作占比": "#ba43a9" }, "bars": false, "dashLength": 10, "dashes": false, "datasource": "prometheus", "decimals": null, "description": "The time spent on I/O in the natural time of each second.(wall-clock time)", "fieldConfig": { "defaults": { "links": [] }, "overrides": [] }, "fill": 1, "fillGradient": 0, "gridPos": { "h": 9, "w": 8, "x": 8, "y": 38 }, "hiddenSeries": false, "id": 175, "legend": { "alignAsTable": true, "avg": true, "current": true, "hideEmpty": true, "hideZero": true, "max": true, "min": false, "rightSide": false, "show": true, "sideWidth": null, "sort": null, "sortDesc": null, "total": false, "values": true }, "lines": true, "linewidth": 1, "links": [], "maxPerRow": 6, "nullPointMode": "null", "options": { "alertThreshold": true }, "percentage": false, "pluginVersion": "7.5.4", "pointradius": 5, "points": false, "renderer": "flot", "seriesOverrides": [], "spaceLength": 10, "stack": false, "steppedLine": false, "targets": [ { "expr": "rate(node_disk_io_time_seconds_total{instance=~\"$node\"}[$interval])", "format": "time_series", "interval": "", "intervalFactor": 1, "legendFormat": "{{device}}_ IO time", "refId": "C" } ], "thresholds": [], "timeFrom": null, "timeRegions": [], "timeShift": null, "title": "Time Spent Doing I/Os", "tooltip": { "shared": true, "sort": 2, "value_type": "individual" }, "type": "graph", "xaxis": { "buckets": null, "mode": "time", "name": null, "show": true, "values": [] }, "yaxes": [ { "decimals": null, "format": "percentunit", "label": "", "logBase": 1, "max": null, "min": null, "show": true }, { "format": "short", "label": null, "logBase": 1, "max": null, "min": null, "show": false } ], "yaxis": { "align": false, "alignLevel": null } }, { "aliasColors": { "vda": "#6ED0E0" }, "bars": false, "dashLength": 10, "dashes": false, "datasource": "prometheus", "decimals": 2, "description": "Time spent on each read/write operation", "fieldConfig": { "defaults": { "links": [] }, "overrides": [] }, "fill": 1, "fillGradient": 1, "gridPos": { "h": 9, "w": 8, "x": 16, "y": 38 }, "height": "300", "hiddenSeries": false, "id": 160, "legend": { "alignAsTable": true, "avg": true, "current": true, "hideEmpty": true, "hideZero": true, "max": true, "min": true, "show": true, "sort": "current", "sortDesc": true, "total": false, "values": true }, "lines": true, "linewidth": 2, "links": [], "nullPointMode": "null as zero", "options": { "alertThreshold": true }, "percentage": false, "pluginVersion": "7.5.4", "pointradius": 5, "points": false, "renderer": "flot", "seriesOverrides": [ { "alias": "/,*_Read time$/", "transform": "negative-Y" } ], "spaceLength": 10, "stack": false, "steppedLine": false, "targets": [ { "expr": "rate(node_disk_read_time_seconds_total{instance=~\"$node\"}[$interval]) / rate(node_disk_reads_completed_total{instance=~\"$node\"}[$interval])", "format": "time_series", "hide": false, "instant": false, "interval": "", "intervalFactor": 1, "legendFormat": "{{device}}_Read time", "refId": "B" }, { "expr": "rate(node_disk_write_time_seconds_total{instance=~\"$node\"}[$interval]) / rate(node_disk_writes_completed_total{instance=~\"$node\"}[$interval])", "format": "time_series", "hide": false, "instant": false, "interval": "", "intervalFactor": 1, "legendFormat": "{{device}}_Write time", "refId": "C" }, { "expr": "rate(node_disk_io_time_seconds_total{instance=~\"$node\"}[$interval])", "format": "time_series", "hide": true, "interval": "", "intervalFactor": 1, "legendFormat": "{{device}}", "refId": "A", "step": 10 }, { "expr": "rate(node_disk_io_time_weighted_seconds_total{instance=~\"$node\"}[$interval])", "format": "time_series", "hide": true, "interval": "", "intervalFactor": 1, "legendFormat": "{{device}}_加权", "refId": "D" } ], "thresholds": [], "timeFrom": null, "timeRegions": [], "timeShift": null, "title": "Disk R/W Time(Reference: less than 100ms)(beta)", "tooltip": { "shared": true, "sort": 2, "value_type": "individual" }, "type": "graph", "xaxis": { "buckets": null, "mode": "time", "name": null, "show": true, "values": [] }, "yaxes": [ { "format": "s", "label": "Time read (-) / write (+)", "logBase": 1, "max": null, "min": null, "show": true }, { "format": "short", "label": null, "logBase": 1, "max": null, "min": null, "show": false } ], "yaxis": { "align": false, "alignLevel": null } }, { "aliasColors": { "192.168.200.241:9100_TCP_alloc": "semi-dark-blue", "TCP": "#6ED0E0", "TCP_alloc": "blue" }, "bars": false, "dashLength": 10, "dashes": false, "datasource": "prometheus", "decimals": 2, "description": "Sockets_used - Sockets currently in use\n\nCurrEstab - TCP connections for which the current state is either ESTABLISHED or CLOSE- WAIT\n\nTCP_alloc - Allocated sockets\n\nTCP_tw - Sockets wating close\n\nUDP_inuse - Udp sockets currently in use\n\nRetransSegs - TCP retransmission packets\n\nOutSegs - Number of packets sent by TCP\n\nInSegs - Number of packets received by TCP", "fieldConfig": { "defaults": { "links": [] }, "overrides": [] }, "fill": 0, "fillGradient": 0, "gridPos": { "h": 8, "w": 16, "x": 0, "y": 47 }, "height": "300", "hiddenSeries": false, "id": 158, "interval": "", "legend": { "alignAsTable": true, "avg": false, "current": true, "hideEmpty": true, "hideZero": true, "max": true, "min": false, "rightSide": true, "show": true, "sideWidth": null, "sort": "current", "sortDesc": true, "total": false, "values": true }, "lines": true, "linewidth": 1, "links": [], "nullPointMode": "null", "options": { "alertThreshold": true }, "percentage": false, "pluginVersion": "7.5.4", "pointradius": 5, "points": false, "renderer": "flot", "seriesOverrides": [ { "alias": "/.*Sockets_used/", "color": "#E02F44", "lines": false, "pointradius": 1, "points": true, "yaxis": 2 } ], "spaceLength": 10, "stack": false, "steppedLine": false, "targets": [ { "expr": "node_netstat_Tcp_CurrEstab{instance=~'$node'}", "format": "time_series", "hide": false, "instant": false, "interval": "", "intervalFactor": 1, "legendFormat": "CurrEstab", "refId": "A", "step": 20 }, { "expr": "node_sockstat_TCP_tw{instance=~'$node'}", "format": "time_series", "interval": "", "intervalFactor": 1, "legendFormat": "TCP_tw", "refId": "D" }, { "expr": "node_sockstat_sockets_used{instance=~'$node'}", "hide": false, "interval": "30m", "intervalFactor": 1, "legendFormat": "Sockets_used", "refId": "B" }, { "expr": "node_sockstat_UDP_inuse{instance=~'$node'}", "interval": "", "legendFormat": "UDP_inuse", "refId": "C" }, { "expr": "node_sockstat_TCP_alloc{instance=~'$node'}", "interval": "", "legendFormat": "TCP_alloc", "refId": "E" }, { "expr": "rate(node_netstat_Tcp_PassiveOpens{instance=~'$node'}[$interval])", "hide": true, "interval": "", "legendFormat": "{{instance}}_Tcp_PassiveOpens", "refId": "G" }, { "expr": "rate(node_netstat_Tcp_ActiveOpens{instance=~'$node'}[$interval])", "hide": true, "interval": "", "legendFormat": "{{instance}}_Tcp_ActiveOpens", "refId": "F" }, { "expr": "rate(node_netstat_Tcp_InSegs{instance=~'$node'}[$interval])", "interval": "", "legendFormat": "Tcp_InSegs", "refId": "H" }, { "expr": "rate(node_netstat_Tcp_OutSegs{instance=~'$node'}[$interval])", "interval": "", "legendFormat": "Tcp_OutSegs", "refId": "I" }, { "expr": "rate(node_netstat_Tcp_RetransSegs{instance=~'$node'}[$interval])", "hide": false, "interval": "", "legendFormat": "Tcp_RetransSegs", "refId": "J" }, { "expr": "rate(node_netstat_TcpExt_ListenDrops{instance=~'$node'}[$interval])", "hide": true, "interval": "", "legendFormat": "", "refId": "K" } ], "thresholds": [], "timeFrom": null, "timeRegions": [], "timeShift": null, "title": "Network Sockstat", "tooltip": { "shared": true, "sort": 2, "value_type": "individual" }, "transformations": [], "type": "graph", "xaxis": { "buckets": null, "mode": "time", "name": null, "show": true, "values": [] }, "yaxes": [ { "format": "short", "label": null, "logBase": 1, "max": null, "min": null, "show": true }, { "format": "short", "label": "Total_Sockets_used", "logBase": 1, "max": null, "min": null, "show": true } ], "yaxis": { "align": false, "alignLevel": null } }, { "aliasColors": { "filefd_192.168.200.241:9100": "super-light-green", "switches_192.168.200.241:9100": "semi-dark-red", "使用的文件描述符_10.118.72.128:9100": "red", "每秒上下文切换次数_10.118.71.245:9100": "yellow", "每秒上下文切换次数_10.118.72.128:9100": "yellow" }, "bars": false, "cacheTimeout": null, "dashLength": 10, "dashes": false, "datasource": "prometheus", "description": "", "fieldConfig": { "defaults": { "links": [] }, "overrides": [] }, "fill": 0, "fillGradient": 1, "gridPos": { "h": 8, "w": 8, "x": 16, "y": 47 }, "hiddenSeries": false, "hideTimeOverride": false, "id": 16, "legend": { "alignAsTable": false, "avg": false, "current": true, "max": false, "min": false, "rightSide": false, "show": true, "total": false, "values": true }, "lines": true, "linewidth": 2, "links": [], "nullPointMode": "null", "options": { "alertThreshold": true }, "percentage": false, "pluginVersion": "7.5.4", "pointradius": 1, "points": false, "renderer": "flot", "seriesOverrides": [ { "alias": "switches", "color": "#FADE2A", "lines": false, "pointradius": 1, "points": true, "yaxis": 2 }, { "alias": "used filefd", "color": "#F2495C" } ], "spaceLength": 10, "stack": false, "steppedLine": false, "targets": [ { "expr": "node_filefd_allocated{instance=~\"$node\"}", "format": "time_series", "instant": false, "interval": "", "intervalFactor": 5, "legendFormat": "used filefd", "refId": "B" }, { "expr": "rate(node_context_switches_total{instance=~\"$node\"}[$interval])", "interval": "", "intervalFactor": 5, "legendFormat": "switches", "refId": "A" }, { "expr": " (node_filefd_allocated{instance=~\"$node\"}/node_filefd_maximum{instance=~\"$node\"}) *100", "format": "time_series", "hide": true, "instant": false, "interval": "", "intervalFactor": 5, "legendFormat": "使用的文件描述符占比_{{instance}}", "refId": "C" } ], "thresholds": [], "timeFrom": null, "timeRegions": [], "timeShift": null, "title": "Open File Descriptor(left)/Context switches(right)", "tooltip": { "shared": true, "sort": 2, "value_type": "individual" }, "type": "graph", "xaxis": { "buckets": null, "mode": "time", "name": null, "show": true, "values": [] }, "yaxes": [ { "format": "short", "label": "used filefd", "logBase": 1, "max": null, "min": null, "show": true }, { "format": "short", "label": "context_switches", "logBase": 1, "max": null, "min": null, "show": true } ], "yaxis": { "align": false, "alignLevel": null } } ], "refresh": false, "schemaVersion": 27, "style": "dark", "tags": [ "Prometheus", "node_exporter", "StarsL.cn" ], "templating": { "list": [ { "allValue": "", "current": { "isNone": true, "selected": false, "text": "None", "value": "" }, "datasource": "prometheus", "definition": "label_values(origin_prometheus)", "description": null, "error": null, "hide": 0, "includeAll": false, "label": "Origin_prom", "multi": false, "name": "origin_prometheus", "options": [], "query": { "query": "label_values(origin_prometheus)", "refId": "prometheus-origin_prometheus-Variable-Query" }, "refresh": 1, "regex": "", "skipUrlSync": false, "sort": 5, "tagValuesQuery": "", "tags": [], "tagsQuery": "", "type": "query", "useTags": false }, { "allValue": null, "current": { "selected": false, "text": "node-exporter", "value": "node-exporter" }, "datasource": "prometheus", "definition": "label_values(node_uname_info{origin_prometheus=~\"$origin_prometheus\"}, job)", "description": null, "error": null, "hide": 0, "includeAll": false, "label": "JOB", "multi": false, "name": "job", "options": [], "query": { "query": "label_values(node_uname_info{origin_prometheus=~\"$origin_prometheus\"}, job)", "refId": "prometheus-job-Variable-Query" }, "refresh": 1, "regex": "", "skipUrlSync": false, "sort": 5, "tagValuesQuery": "", "tags": [], "tagsQuery": "", "type": "query", "useTags": false }, { "allValue": null, "current": { "selected": false, "text": "All", "value": "$__all" }, "datasource": "prometheus", "definition": "label_values(node_uname_info{origin_prometheus=~\"$origin_prometheus\",job=~\"$job\"}, nodename)", "description": null, "error": null, "hide": 0, "includeAll": true, "label": "Host", "multi": false, "name": "hostname", "options": [], "query": { "query": "label_values(node_uname_info{origin_prometheus=~\"$origin_prometheus\",job=~\"$job\"}, nodename)", "refId": "prometheus-hostname-Variable-Query" }, "refresh": 1, "regex": "", "skipUrlSync": false, "sort": 5, "tagValuesQuery": "", "tags": [], "tagsQuery": "", "type": "query", "useTags": false }, { "allFormat": "glob", "allValue": null, "current": { "selected": false, "text": "k8s-ceph-01", "value": "k8s-ceph-01" }, "datasource": "prometheus", "definition": "label_values(node_uname_info{origin_prometheus=~\"$origin_prometheus\",job=~\"$job\",nodename=~\"$hostname\"},instance)", "description": null, "error": null, "hide": 0, "includeAll": false, "label": "Instance", "multi": true, "multiFormat": "regex values", "name": "node", "options": [], "query": { "query": "label_values(node_uname_info{origin_prometheus=~\"$origin_prometheus\",job=~\"$job\",nodename=~\"$hostname\"},instance)", "refId": "prometheus-node-Variable-Query" }, "refresh": 1, "regex": "", "skipUrlSync": false, "sort": 5, "tagValuesQuery": "", "tags": [], "tagsQuery": "", "type": "query", "useTags": false }, { "allFormat": "glob", "allValue": null, "current": { "selected": true, "text": [ "All" ], "value": [ "$__all" ] }, "datasource": "prometheus", "definition": "label_values(node_network_info{origin_prometheus=~\"$origin_prometheus\",device!~'tap.*|veth.*|br.*|docker.*|virbr.*|lo.*|cni.*'},device)", "description": null, "error": null, "hide": 0, "includeAll": true, "label": "NIC", "multi": true, "multiFormat": "regex values", "name": "device", "options": [], "query": { "query": "label_values(node_network_info{origin_prometheus=~\"$origin_prometheus\",device!~'tap.*|veth.*|br.*|docker.*|virbr.*|lo.*|cni.*'},device)", "refId": "prometheus-device-Variable-Query" }, "refresh": 1, "regex": "", "skipUrlSync": false, "sort": 1, "tagValuesQuery": "", "tags": [], "tagsQuery": "", "type": "query", "useTags": false }, { "auto": false, "auto_count": 100, "auto_min": "10s", "current": { "selected": false, "text": "2m", "value": "2m" }, "description": null, "error": null, "hide": 0, "label": "Interval", "name": "interval", "options": [ { "selected": false, "text": "30s", "value": "30s" }, { "selected": false, "text": "1m", "value": "1m" }, { "selected": true, "text": "2m", "value": "2m" }, { "selected": false, "text": "3m", "value": "3m" }, { "selected": false, "text": "5m", "value": "5m" }, { "selected": false, "text": "10m", "value": "10m" }, { "selected": false, "text": "30m", "value": "30m" } ], "query": "30s,1m,2m,3m,5m,10m,30m", "queryValue": "", "refresh": 2, "skipUrlSync": false, "type": "interval" }, { "allValue": null, "current": { "selected": false, "text": "/", "value": "/" }, "datasource": "prometheus", "definition": "query_result(topk(1,sort_desc (max(node_filesystem_size_bytes{origin_prometheus=~\"$origin_prometheus\",instance=~'$node',fstype=~\"ext.?|xfs\",mountpoint!~\".*pods.*\"}) by (mountpoint))))", "description": null, "error": null, "hide": 2, "includeAll": false, "label": "maxmount", "multi": false, "name": "maxmount", "options": [], "query": { "query": "query_result(topk(1,sort_desc (max(node_filesystem_size_bytes{origin_prometheus=~\"$origin_prometheus\",instance=~'$node',fstype=~\"ext.?|xfs\",mountpoint!~\".*pods.*\"}) by (mountpoint))))", "refId": "prometheus-maxmount-Variable-Query" }, "refresh": 2, "regex": "/.*\\\"(.*)\\\".*/", "skipUrlSync": false, "sort": 5, "tagValuesQuery": "", "tags": [], "tagsQuery": "", "type": "query", "useTags": false }, { "allValue": null, "current": { "selected": false, "text": "k8s-ceph-01", "value": "k8s-ceph-01" }, "datasource": "prometheus", "definition": "label_values(node_uname_info{origin_prometheus=~\"$origin_prometheus\",job=~\"$job\",instance=~\"$node\"}, nodename)", "description": null, "error": null, "hide": 2, "includeAll": false, "label": "show_hostname", "multi": false, "name": "show_hostname", "options": [], "query": { "query": "label_values(node_uname_info{origin_prometheus=~\"$origin_prometheus\",job=~\"$job\",instance=~\"$node\"}, nodename)", "refId": "prometheus-show_hostname-Variable-Query" }, "refresh": 1, "regex": "", "skipUrlSync": false, "sort": 5, "tagValuesQuery": "", "tags": [], "tagsQuery": "", "type": "query", "useTags": false }, { "allValue": null, "current": { "selected": false, "text": "9", "value": "9" }, "datasource": "prometheus", "definition": "query_result(count(node_uname_info{origin_prometheus=~\"$origin_prometheus\",job=~\"$job\"}))", "description": null, "error": null, "hide": 2, "includeAll": false, "label": "total_servers", "multi": false, "name": "total", "options": [], "query": { "query": "query_result(count(node_uname_info{origin_prometheus=~\"$origin_prometheus\",job=~\"$job\"}))", "refId": "prometheus-total-Variable-Query" }, "refresh": 1, "regex": "/{} (.*) .*/", "skipUrlSync": false, "sort": 0, "tagValuesQuery": "", "tags": [], "tagsQuery": "", "type": "query", "useTags": false } ] }, "time": { "from": "now-5m", "to": "now" }, "timepicker": { "hidden": false, "now": true, "refresh_intervals": [ "15s", "30s", "1m", "5m", "15m", "30m" ], "time_options": [ "5m", "15m", "1h", "6h", "12h", "24h", "2d", "7d", "30d" ] }, "timezone": "Asia/Shanghai", "title": "monitoring-node", "uid": "xfpJB9FGzx", "version": 3 }
效果图
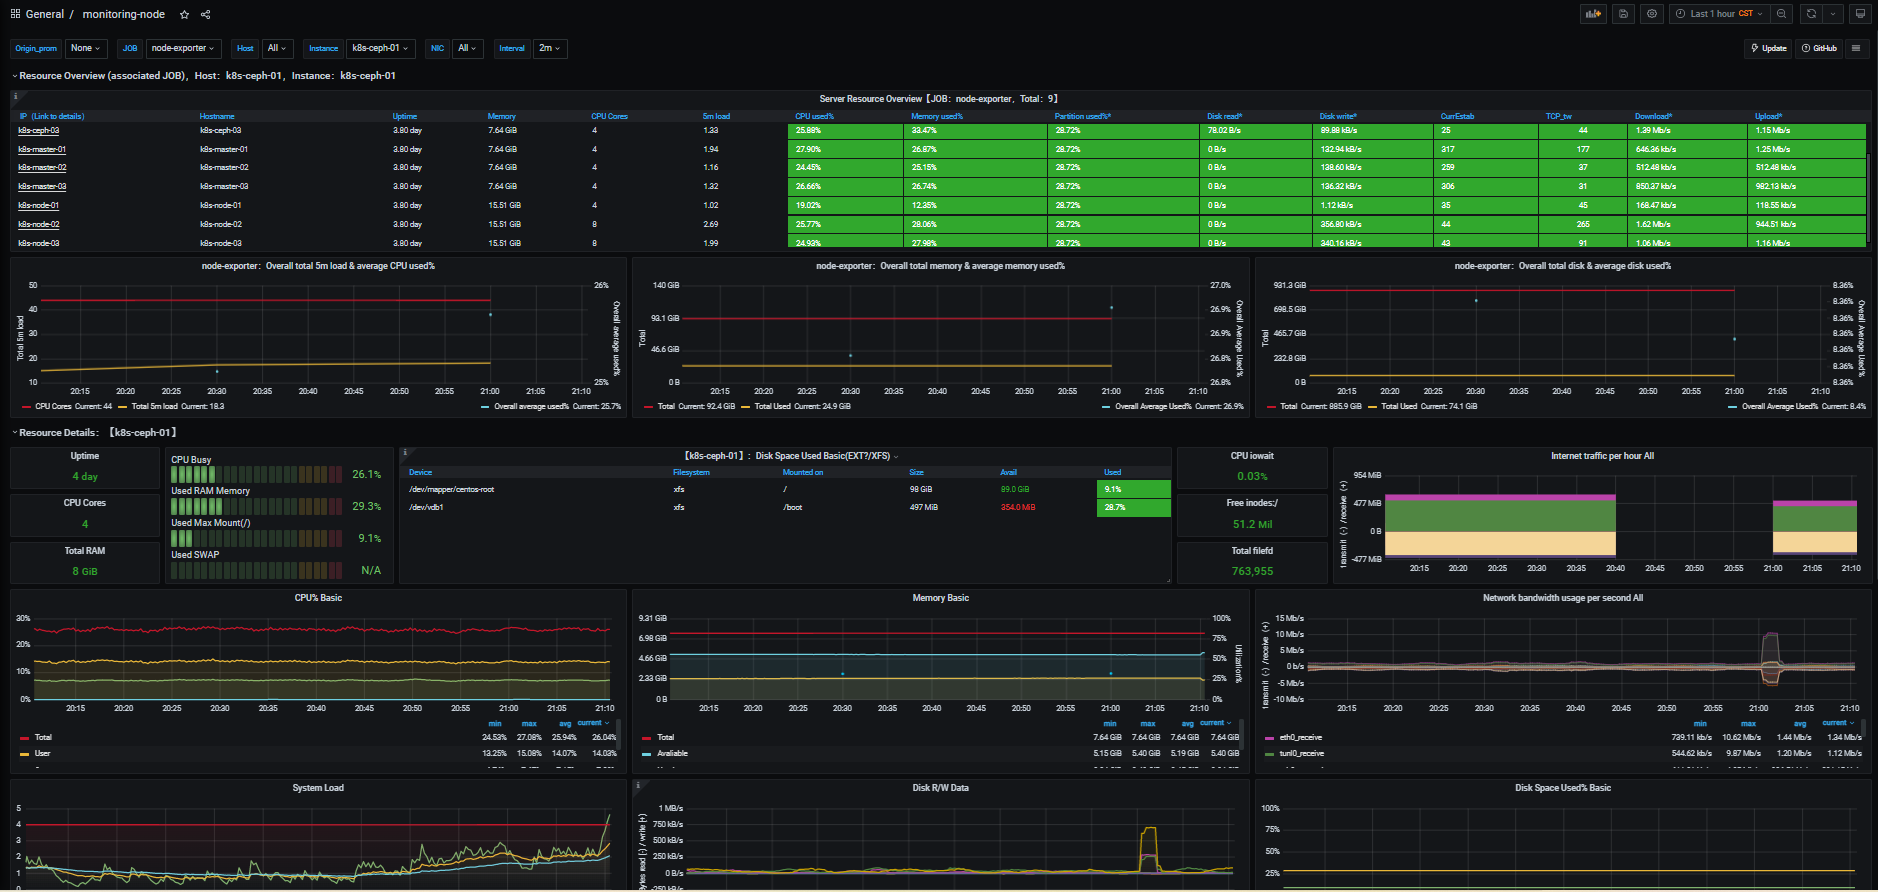
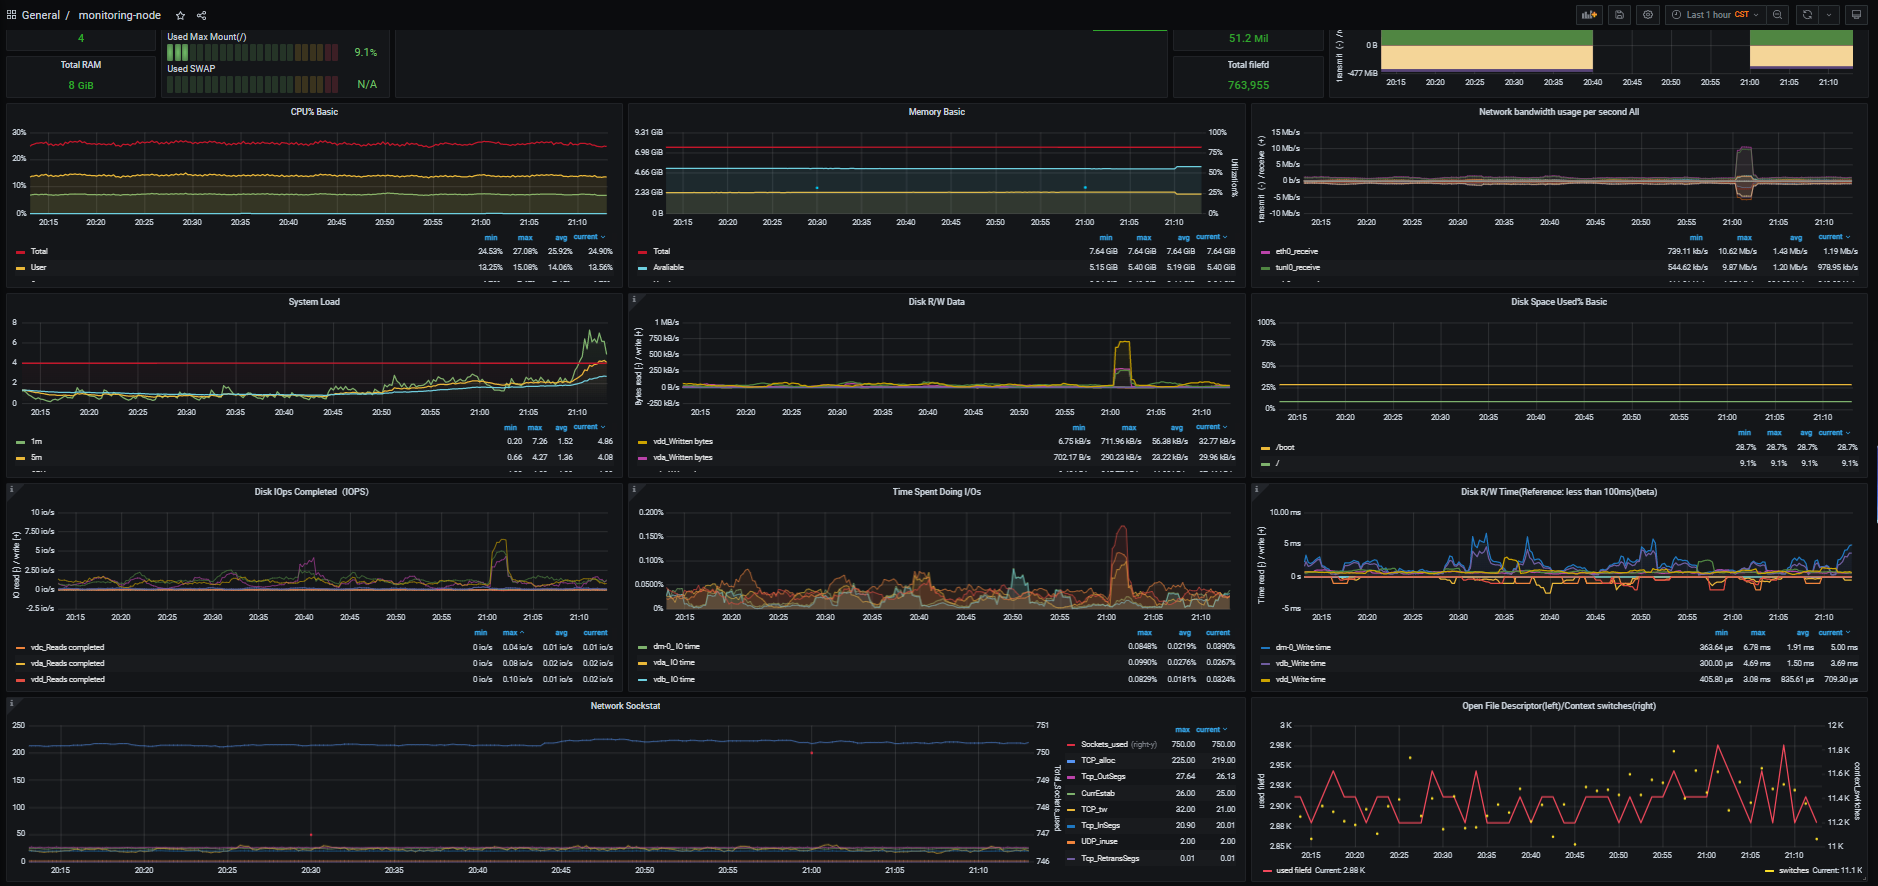
监控pod
{ "annotations": { "list": [ { "builtIn": 1, "datasource": "prometheus", "enable": true, "hide": true, "iconColor": "rgba(0, 211, 255, 1)", "name": "Annotations & Alerts", "type": "dashboard" } ] }, "description": "【English version】Update 2020.10.10, add the overall resource overview! Support Grafana6&7,Support Node Exporter v0.16 and above.Optimize the main metrics display. Includes: CPU, memory, disk IO, network, temperature and other monitoring metrics。https://github.com/starsliao/Prometheus", "editable": true, "gnetId": 11074, "graphTooltip": 0, "id": 27, "iteration": 1658322777542, "links": [ { "icon": "bolt", "tags": [], "targetBlank": true, "title": "Update", "tooltip": "Update dashboard", "type": "link", "url": "https://grafana.com/grafana/dashboards/11074" }, { "icon": "question", "tags": [], "targetBlank": true, "title": "GitHub", "tooltip": "more dashboard", "type": "link", "url": "https://github.com/starsliao" }, { "asDropdown": true, "icon": "external link", "tags": [], "targetBlank": true, "title": "", "type": "dashboards" } ], "panels": [ { "collapsed": false, "datasource": "prometheus", "gridPos": { "h": 1, "w": 24, "x": 0, "y": 0 }, "id": 187, "panels": [], "title": "Resource Overview (associated JOB),Host:$show_hostname,Instance:$node", "type": "row" }, { "columns": [], "datasource": "prometheus", "description": "Partition utilization, disk read, disk write, download bandwidth, upload bandwidth, if there are multiple network cards or multiple partitions, it is the value of the network card or partition with the highest utilization rate collected.\n\nCurrEstab: The number of TCP connections whose current status is ESTABLISHED or CLOSE-WAIT.", "fieldConfig": { "defaults": {}, "overrides": [] }, "fontSize": "80%", "gridPos": { "h": 7, "w": 24, "x": 0, "y": 1 }, "id": 185, "pageSize": null, "showHeader": true, "sort": { "col": 31, "desc": false }, "styles": [ { "alias": "Hostname", "align": "auto", "colorMode": null, "colors": [ "rgba(245, 54, 54, 0.9)", "rgba(237, 129, 40, 0.89)", "rgba(50, 172, 45, 0.97)" ], "dateFormat": "YYYY-MM-DD HH:mm:ss", "decimals": 1, "link": false, "linkTooltip": "", "linkUrl": "", "mappingType": 1, "pattern": "nodename", "thresholds": [], "type": "string", "unit": "bytes" }, { "alias": "IP(Link to details)", "align": "auto", "colorMode": null, "colors": [ "rgba(245, 54, 54, 0.9)", "rgba(237, 129, 40, 0.89)", "rgba(50, 172, 45, 0.97)" ], "dateFormat": "YYYY-MM-DD HH:mm:ss", "decimals": 2, "link": true, "linkTargetBlank": false, "linkTooltip": "Browse host details", "linkUrl": "d/xfpJB9FGz/node-exporter?orgId=1&var-job=${job}&var-hostname=All&var-node=${__cell}&var-device=All&var-origin_prometheus=$origin_prometheus", "mappingType": 1, "pattern": "instance", "thresholds": [], "type": "number", "unit": "short" }, { "alias": "Memory", "align": "auto", "colorMode": null, "colors": [ "rgba(245, 54, 54, 0.9)", "rgba(237, 129, 40, 0.89)", "rgba(50, 172, 45, 0.97)" ], "dateFormat": "YYYY-MM-DD HH:mm:ss", "decimals": 2, "link": false, "mappingType": 1, "pattern": "Value #B", "thresholds": [], "type": "number", "unit": "bytes" }, { "alias": "CPU Cores", "align": "auto", "colorMode": null, "colors": [ "rgba(245, 54, 54, 0.9)", "rgba(237, 129, 40, 0.89)", "rgba(50, 172, 45, 0.97)" ], "dateFormat": "YYYY-MM-DD HH:mm:ss", "decimals": null, "mappingType": 1, "pattern": "Value #C", "thresholds": [], "type": "number", "unit": "short" }, { "alias": " Uptime", "align": "auto", "colorMode": null, "colors": [ "rgba(245, 54, 54, 0.9)", "rgba(237, 129, 40, 0.89)", "rgba(50, 172, 45, 0.97)" ], "dateFormat": "YYYY-MM-DD HH:mm:ss", "decimals": 2, "mappingType": 1, "pattern": "Value #D", "thresholds": [], "type": "number", "unit": "s" }, { "alias": "Partition used%*", "align": "auto", "colorMode": "cell", "colors": [ "rgba(50, 172, 45, 0.97)", "rgba(237, 129, 40, 0.89)", "rgba(245, 54, 54, 0.9)" ], "dateFormat": "YYYY-MM-DD HH:mm:ss", "decimals": 2, "mappingType": 1, "pattern": "Value #E", "thresholds": [ "70", "85" ], "type": "number", "unit": "percent" }, { "alias": "CPU used%", "align": "auto", "colorMode": "cell", "colors": [ "rgba(50, 172, 45, 0.97)", "rgba(237, 129, 40, 0.89)", "rgba(245, 54, 54, 0.9)" ], "dateFormat": "YYYY-MM-DD HH:mm:ss", "decimals": 2, "mappingType": 1, "pattern": "Value #F", "thresholds": [ "70", "85" ], "type": "number", "unit": "percent" }, { "alias": "Memory used%", "align": "auto", "colorMode": "cell", "colors": [ "rgba(50, 172, 45, 0.97)", "rgba(237, 129, 40, 0.89)", "rgba(245, 54, 54, 0.9)" ], "dateFormat": "YYYY-MM-DD HH:mm:ss", "decimals": 2, "mappingType": 1, "pattern": "Value #G", "thresholds": [ "70", "85" ], "type": "number", "unit": "percent" }, { "alias": "Disk read*", "align": "auto", "colorMode": "cell", "colors": [ "rgba(50, 172, 45, 0.97)", "rgba(237, 129, 40, 0.89)", "rgba(245, 54, 54, 0.9)" ], "dateFormat": "YYYY-MM-DD HH:mm:ss", "decimals": 2, "mappingType": 1, "pattern": "Value #H", "thresholds": [ "10485760", "20485760" ], "type": "number", "unit": "Bps" }, { "alias": "Disk write*", "align": "auto", "colorMode": "cell", "colors": [ "rgba(50, 172, 45, 0.97)", "rgba(237, 129, 40, 0.89)", "rgba(245, 54, 54, 0.9)" ], "dateFormat": "YYYY-MM-DD HH:mm:ss", "decimals": 2, "mappingType": 1, "pattern": "Value #I", "thresholds": [ "10485760", "20485760" ], "type": "number", "unit": "Bps" }, { "alias": "Download*", "align": "auto", "colorMode": "cell", "colors": [ "rgba(50, 172, 45, 0.97)", "rgba(237, 129, 40, 0.89)", "rgba(245, 54, 54, 0.9)" ], "dateFormat": "YYYY-MM-DD HH:mm:ss", "decimals": 2, "mappingType": 1, "pattern": "Value #J", "thresholds": [ "30485760", "104857600" ], "type": "number", "unit": "bps" }, { "alias": "Upload*", "align": "auto", "colorMode": "cell", "colors": [ "rgba(50, 172, 45, 0.97)", "rgba(237, 129, 40, 0.89)", "rgba(245, 54, 54, 0.9)" ], "dateFormat": "YYYY-MM-DD HH:mm:ss", "decimals": 2, "mappingType": 1, "pattern": "Value #K", "thresholds": [ "30485760", "104857600" ], "type": "number", "unit": "bps" }, { "alias": "5m load", "align": "auto", "colorMode": null, "colors": [ "rgba(245, 54, 54, 0.9)", "rgba(237, 129, 40, 0.89)", "rgba(50, 172, 45, 0.97)" ], "dateFormat": "YYYY-MM-DD HH:mm:ss", "decimals": 2, "mappingType": 1, "pattern": "Value #L", "thresholds": [], "type": "number", "unit": "short" }, { "alias": "CurrEstab", "align": "auto", "colorMode": "cell", "colors": [ "rgba(50, 172, 45, 0.97)", "rgba(237, 129, 40, 0.89)", "rgba(245, 54, 54, 0.9)" ], "dateFormat": "YYYY-MM-DD HH:mm:ss", "decimals": 2, "mappingType": 1, "pattern": "Value #M", "thresholds": [ "1000", "1500" ], "type": "string", "unit": "short" }, { "alias": "TCP_tw", "align": "center", "colorMode": "cell", "colors": [ "rgba(50, 172, 45, 0.97)", "rgba(237, 129, 40, 0.89)", "rgba(245, 54, 54, 0.9)" ], "dateFormat": "YYYY-MM-DD HH:mm:ss", "decimals": null, "mappingType": 1, "pattern": "Value #N", "thresholds": [ "5000", "20000" ], "type": "number", "unit": "short" }, { "alias": "", "align": "right", "colorMode": null, "colors": [ "rgba(245, 54, 54, 0.9)", "rgba(237, 129, 40, 0.89)", "rgba(50, 172, 45, 0.97)" ], "decimals": 2, "pattern": "/.*/", "thresholds": [], "type": "hidden", "unit": "short" } ], "targets": [ { "expr": "node_uname_info{origin_prometheus=~\"$origin_prometheus\",job=~\"$job\"} - 0", "format": "table", "instant": true, "interval": "", "legendFormat": "主机名", "refId": "A" }, { "expr": "sum(time() - node_boot_time_seconds{origin_prometheus=~\"$origin_prometheus\",job=~\"$job\"})by(instance)", "format": "table", "hide": false, "instant": true, "interval": "", "legendFormat": "运行时间", "refId": "D" }, { "expr": "node_memory_MemTotal_bytes{origin_prometheus=~\"$origin_prometheus\",job=~\"$job\"} - 0", "format": "table", "hide": false, "instant": true, "interval": "", "legendFormat": "总内存", "refId": "B" }, { "expr": "count(node_cpu_seconds_total{origin_prometheus=~\"$origin_prometheus\",job=~\"$job\",mode='system'}) by (instance)", "format": "table", "hide": false, "instant": true, "interval": "", "legendFormat": "总核数", "refId": "C" }, { "expr": "node_load5{origin_prometheus=~\"$origin_prometheus\",job=~\"$job\"}", "format": "table", "instant": true, "interval": "", "legendFormat": "5分钟负载", "refId": "L" }, { "expr": "(1 - avg(rate(node_cpu_seconds_total{origin_prometheus=~\"$origin_prometheus\",job=~\"$job\",mode=\"idle\"}[$interval])) by (instance)) * 100", "format": "table", "hide": false, "instant": true, "interval": "", "legendFormat": "CPU使用率", "refId": "F" }, { "expr": "(1 - (node_memory_MemAvailable_bytes{origin_prometheus=~\"$origin_prometheus\",job=~\"$job\"} / (node_memory_MemTotal_bytes{origin_prometheus=~\"$origin_prometheus\",job=~\"$job\"})))* 100", "format": "table", "hide": false, "instant": true, "interval": "", "legendFormat": "内存使用率", "refId": "G" }, { "expr": "max((node_filesystem_size_bytes{origin_prometheus=~\"$origin_prometheus\",job=~\"$job\",fstype=~\"ext.?|xfs\"}-node_filesystem_free_bytes{origin_prometheus=~\"$origin_prometheus\",job=~\"$job\",fstype=~\"ext.?|xfs\"}) *100/(node_filesystem_avail_bytes {origin_prometheus=~\"$origin_prometheus\",job=~\"$job\",fstype=~\"ext.?|xfs\"}+(node_filesystem_size_bytes{origin_prometheus=~\"$origin_prometheus\",job=~\"$job\",fstype=~\"ext.?|xfs\"}-node_filesystem_free_bytes{origin_prometheus=~\"$origin_prometheus\",job=~\"$job\",fstype=~\"ext.?|xfs\"})))by(instance)", "format": "table", "hide": false, "instant": true, "interval": "", "legendFormat": "分区使用率", "refId": "E" }, { "expr": "max(rate(node_disk_read_bytes_total{origin_prometheus=~\"$origin_prometheus\",job=~\"$job\"}[$interval])) by (instance)", "format": "table", "hide": false, "instant": true, "interval": "", "legendFormat": "最大读取", "refId": "H" }, { "expr": "max(rate(node_disk_written_bytes_total{origin_prometheus=~\"$origin_prometheus\",job=~\"$job\"}[$interval])) by (instance)", "format": "table", "hide": false, "instant": true, "interval": "", "legendFormat": "最大写入", "refId": "I" }, { "expr": "node_netstat_Tcp_CurrEstab{origin_prometheus=~\"$origin_prometheus\",job=~\"$job\"} - 0", "format": "table", "hide": false, "instant": true, "interval": "", "legendFormat": "连接数", "refId": "M" }, { "expr": "node_sockstat_TCP_tw{origin_prometheus=~\"$origin_prometheus\",job=~\"$job\"} - 0", "format": "table", "hide": false, "instant": true, "interval": "", "legendFormat": "TIME_WAIT", "refId": "N" }, { "expr": "max(rate(node_network_receive_bytes_total{origin_prometheus=~\"$origin_prometheus\",job=~\"$job\"}[$interval])*8) by (instance)", "format": "table", "hide": false, "instant": true, "interval": "", "legendFormat": "下载带宽", "refId": "J" }, { "expr": "max(rate(node_network_transmit_bytes_total{origin_prometheus=~\"$origin_prometheus\",job=~\"$job\"}[$interval])*8) by (instance)", "format": "table", "hide": false, "instant": true, "interval": "", "legendFormat": "上传带宽", "refId": "K" } ], "timeFrom": null, "timeShift": null, "title": "Server Resource Overview【JOB:$job,Total:$total】", "transform": "table", "type": "table-old" }, { "aliasColors": { "192.168.200.241:9100_Total": "dark-red", "Idle - Waiting for something to happen": "#052B51", "guest": "#9AC48A", "idle": "#052B51", "iowait": "#EAB839", "irq": "#BF1B00", "nice": "#C15C17", "sdb_每秒I/O操作%": "#d683ce", "softirq": "#E24D42", "steal": "#FCE2DE", "system": "#508642", "user": "#5195CE", "磁盘花费在I/O操作占比": "#ba43a9" }, "bars": false, "dashLength": 10, "dashes": false, "datasource": "prometheus", "decimals": null, "description": "", "fieldConfig": { "defaults": { "links": [] }, "overrides": [] }, "fill": 0, "fillGradient": 0, "gridPos": { "h": 7, "w": 8, "x": 0, "y": 8 }, "hiddenSeries": false, "id": 191, "legend": { "alignAsTable": false, "avg": false, "current": true, "hideEmpty": true, "hideZero": true, "max": false, "min": false, "rightSide": false, "show": true, "sideWidth": null, "sort": "current", "sortDesc": true, "total": false, "values": true }, "lines": true, "linewidth": 2, "links": [], "maxPerRow": 6, "nullPointMode": "null", "options": { "alertThreshold": true }, "percentage": false, "pluginVersion": "7.5.4", "pointradius": 5, "points": false, "renderer": "flot", "repeat": null, "seriesOverrides": [ { "alias": "Overall average used%", "lines": false, "pointradius": 1, "points": true, "yaxis": 2 }, { "alias": "CPU Cores", "color": "#C4162A" } ], "spaceLength": 10, "stack": false, "steppedLine": false, "targets": [ { "expr": "count(node_cpu_seconds_total{origin_prometheus=~\"$origin_prometheus\",job=~\"$job\", mode='system'})", "format": "time_series", "hide": false, "instant": false, "interval": "30m", "intervalFactor": 1, "legendFormat": "CPU Cores", "refId": "B", "step": 240 }, { "expr": "sum(node_load5{origin_prometheus=~\"$origin_prometheus\",job=~\"$job\"})", "format": "time_series", "hide": false, "interval": "30m", "intervalFactor": 1, "legendFormat": "Total 5m load", "refId": "A", "step": 240 }, { "expr": "avg(1 - avg(rate(node_cpu_seconds_total{origin_prometheus=~\"$origin_prometheus\",job=~\"$job\",mode=\"idle\"}[$interval])) by (instance)) * 100", "format": "time_series", "hide": false, "interval": "30m", "intervalFactor": 1, "legendFormat": "Overall average used%", "refId": "F", "step": 240 } ], "thresholds": [], "timeFrom": null, "timeRegions": [], "timeShift": null, "title": "$job:Overall total 5m load & average CPU used%", "tooltip": { "shared": true, "sort": 2, "value_type": "individual" }, "type": "graph", "xaxis": { "buckets": null, "mode": "time", "name": null, "show": true, "values": [] }, "yaxes": [ { "decimals": null, "format": "short", "label": "Total 5m load", "logBase": 1, "max": null, "min": null, "show": true }, { "decimals": 0, "format": "percent", "label": "Overall average used%", "logBase": 1, "max": null, "min": null, "show": true } ], "yaxis": { "align": false, "alignLevel": null } }, { "aliasColors": { "192.168.200.241:9100_总内存": "dark-red", "内存_Avaliable": "#6ED0E0", "内存_Cached": "#EF843C", "内存_Free": "#629E51", "内存_Total": "#6d1f62", "内存_Used": "#eab839", "可用": "#9ac48a", "总内存": "#bf1b00" }, "bars": false, "dashLength": 10, "dashes": false, "datasource": "prometheus", "decimals": 1, "fieldConfig": { "defaults": { "links": [] }, "overrides": [] }, "fill": 0, "fillGradient": 0, "gridPos": { "h": 7, "w": 8, "x": 8, "y": 8 }, "height": "300", "hiddenSeries": false, "id": 195, "legend": { "alignAsTable": false, "avg": false, "current": true, "max": false, "min": false, "rightSide": false, "show": true, "sort": "current", "sortDesc": false, "total": false, "values": true }, "lines": true, "linewidth": 2, "links": [], "nullPointMode": "null", "options": { "alertThreshold": true }, "percentage": false, "pluginVersion": "7.5.4", "pointradius": 5, "points": false, "renderer": "flot", "seriesOverrides": [ { "alias": "Total", "color": "#C4162A", "fill": 0 }, { "alias": "Overall Average Used%", "lines": false, "pointradius": 1, "points": true, "yaxis": 2 } ], "spaceLength": 10, "stack": false, "steppedLine": false, "targets": [ { "expr": "sum(node_memory_MemTotal_bytes{origin_prometheus=~\"$origin_prometheus\",job=~\"$job\"})", "format": "time_series", "hide": false, "instant": false, "interval": "30m", "intervalFactor": 1, "legendFormat": "Total", "refId": "A", "step": 4 }, { "expr": "sum(node_memory_MemTotal_bytes{origin_prometheus=~\"$origin_prometheus\",job=~\"$job\"} - node_memory_MemAvailable_bytes{origin_prometheus=~\"$origin_prometheus\",job=~\"$job\"})", "format": "time_series", "hide": false, "interval": "30m", "intervalFactor": 1, "legendFormat": "Total Used", "refId": "B", "step": 4 }, { "expr": "(sum(node_memory_MemTotal_bytes{origin_prometheus=~\"$origin_prometheus\",job=~\"$job\"} - node_memory_MemAvailable_bytes{origin_prometheus=~\"$origin_prometheus\",job=~\"$job\"}) / sum(node_memory_MemTotal_bytes{origin_prometheus=~\"$origin_prometheus\",job=~\"$job\"}))*100", "format": "time_series", "hide": false, "interval": "30m", "intervalFactor": 1, "legendFormat": "Overall Average Used%", "refId": "H" } ], "thresholds": [], "timeFrom": null, "timeRegions": [], "timeShift": null, "title": "$job:Overall total memory & average memory used%", "tooltip": { "shared": true, "sort": 2, "value_type": "individual" }, "type": "graph", "xaxis": { "buckets": null, "mode": "time", "name": null, "show": true, "values": [] }, "yaxes": [ { "decimals": null, "format": "bytes", "label": "Total", "logBase": 1, "max": null, "min": "0", "show": true }, { "decimals": null, "format": "percent", "label": "Overall Average Used%", "logBase": 1, "max": null, "min": null, "show": true } ], "yaxis": { "align": false, "alignLevel": null } }, { "aliasColors": {}, "bars": false, "dashLength": 10, "dashes": false, "datasource": "prometheus", "decimals": 1, "description": "", "fieldConfig": { "defaults": { "links": [] }, "overrides": [] }, "fill": 0, "fillGradient": 0, "gridPos": { "h": 7, "w": 8, "x": 16, "y": 8 }, "hiddenSeries": false, "id": 197, "legend": { "alignAsTable": false, "avg": false, "current": true, "hideEmpty": false, "hideZero": false, "max": false, "min": false, "rightSide": false, "show": true, "sideWidth": null, "sort": "current", "sortDesc": true, "total": false, "values": true }, "lines": true, "linewidth": 2, "links": [], "nullPointMode": "null", "options": { "alertThreshold": true }, "percentage": false, "pluginVersion": "7.5.4", "pointradius": 5, "points": false, "renderer": "flot", "seriesOverrides": [ { "alias": "Overall Average Used%", "lines": false, "pointradius": 1, "points": true, "yaxis": 2 }, { "alias": "Total", "color": "#C4162A" } ], "spaceLength": 10, "stack": false, "steppedLine": false, "targets": [ { "expr": "sum(avg(node_filesystem_size_bytes{origin_prometheus=~\"$origin_prometheus\",job=~\"$job\",fstype=~\"xfs|ext.*\"})by(device,instance))", "format": "time_series", "instant": false, "interval": "30m", "intervalFactor": 1, "legendFormat": "Total", "refId": "E" }, { "expr": "sum(avg(node_filesystem_size_bytes{origin_prometheus=~\"$origin_prometheus\",job=~\"$job\",fstype=~\"xfs|ext.*\"})by(device,instance)) - sum(avg(node_filesystem_free_bytes{origin_prometheus=~\"$origin_prometheus\",job=~\"$job\",fstype=~\"xfs|ext.*\"})by(device,instance))", "format": "time_series", "instant": false, "interval": "30m", "intervalFactor": 1, "legendFormat": "Total Used", "refId": "C" }, { "expr": "(sum(avg(node_filesystem_size_bytes{origin_prometheus=~\"$origin_prometheus\",job=~\"$job\",fstype=~\"xfs|ext.*\"})by(device,instance)) - sum(avg(node_filesystem_free_bytes{origin_prometheus=~\"$origin_prometheus\",job=~\"$job\",fstype=~\"xfs|ext.*\"})by(device,instance))) *100/(sum(avg(node_filesystem_avail_bytes{origin_prometheus=~\"$origin_prometheus\",job=~\"$job\",fstype=~\"xfs|ext.*\"})by(device,instance))+(sum(avg(node_filesystem_size_bytes{origin_prometheus=~\"$origin_prometheus\",job=~\"$job\",fstype=~\"xfs|ext.*\"})by(device,instance)) - sum(avg(node_filesystem_free_bytes{origin_prometheus=~\"$origin_prometheus\",job=~\"$job\",fstype=~\"xfs|ext.*\"})by(device,instance))))", "format": "time_series", "instant": false, "interval": "30m", "intervalFactor": 1, "legendFormat": "Overall Average Used%", "refId": "A" } ], "thresholds": [], "timeFrom": null, "timeRegions": [], "timeShift": null, "title": "$job:Overall total disk & average disk used%", "tooltip": { "shared": true, "sort": 2, "value_type": "individual" }, "type": "graph", "xaxis": { "buckets": null, "mode": "time", "name": null, "show": true, "values": [] }, "yaxes": [ { "decimals": 1, "format": "bytes", "label": "Total", "logBase": 1, "max": null, "min": "0", "show": true }, { "decimals": null, "format": "percent", "label": "Overall Average Used%", "logBase": 1, "max": null, "min": null, "show": true } ], "yaxis": { "align": false, "alignLevel": null } }, { "collapsed": false, "datasource": "prometheus", "gridPos": { "h": 1, "w": 24, "x": 0, "y": 15 }, "id": 189, "panels": [], "title": "Resource Details:【$show_hostname】", "type": "row" }, { "cacheTimeout": null, "datasource": "prometheus", "description": "", "fieldConfig": { "defaults": { "decimals": 0, "mappings": [ { "id": 0, "op": "=", "text": "N/A", "type": 1, "value": "null" } ], "thresholds": { "mode": "absolute", "steps": [ { "color": "rgba(245, 54, 54, 0.9)", "value": null }, { "color": "rgba(237, 129, 40, 0.89)", "value": 1 }, { "color": "rgba(50, 172, 45, 0.97)", "value": 3 } ] }, "unit": "s" }, "overrides": [] }, "gridPos": { "h": 2, "w": 2, "x": 0, "y": 16 }, "hideTimeOverride": true, "id": 15, "interval": null, "links": [], "maxDataPoints": 100, "options": { "colorMode": "value", "graphMode": "none", "justifyMode": "auto", "orientation": "horizontal", "reduceOptions": { "calcs": [ "lastNotNull" ], "fields": "", "values": false }, "text": {}, "textMode": "auto" }, "pluginVersion": "7.5.4", "targets": [ { "expr": "avg(time() - node_boot_time_seconds{instance=~\"$node\"})", "format": "time_series", "hide": false, "instant": true, "interval": "", "intervalFactor": 1, "legendFormat": "", "refId": "A", "step": 40 } ], "title": "Uptime", "type": "stat" }, { "datasource": "prometheus", "fieldConfig": { "defaults": { "color": { "mode": "thresholds" }, "decimals": 1, "mappings": [ { "from": "", "id": 1, "operator": "", "text": "N/A", "to": "", "type": 1, "value": "0" } ], "max": 100, "min": 0.1, "thresholds": { "mode": "absolute", "steps": [ { "color": "green", "value": null }, { "color": "#EAB839", "value": 70 }, { "color": "red", "value": 90 } ] }, "unit": "percent" }, "overrides": [] }, "gridPos": { "h": 6, "w": 3, "x": 2, "y": 16 }, "id": 177, "options": { "displayMode": "lcd", "orientation": "horizontal", "reduceOptions": { "calcs": [ "last" ], "fields": "", "values": false }, "showUnfilled": true, "text": {} }, "pluginVersion": "7.5.4", "targets": [ { "expr": "100 - (avg(rate(node_cpu_seconds_total{instance=~\"$node\",mode=\"idle\"}[$interval])) * 100)", "instant": true, "interval": "", "legendFormat": "CPU Busy", "refId": "A" }, { "expr": "avg(rate(node_cpu_seconds_total{instance=~\"$node\",mode=\"iowait\"}[$interval])) * 100", "hide": true, "instant": true, "interval": "", "legendFormat": "IOwait使用率", "refId": "C" }, { "expr": "(1 - (node_memory_MemAvailable_bytes{instance=~\"$node\"} / (node_memory_MemTotal_bytes{instance=~\"$node\"})))* 100", "instant": true, "interval": "", "legendFormat": "Used RAM Memory", "refId": "B" }, { "expr": "(node_filesystem_size_bytes{instance=~'$node',fstype=~\"ext.*|xfs\",mountpoint=\"$maxmount\"}-node_filesystem_free_bytes{instance=~'$node',fstype=~\"ext.*|xfs\",mountpoint=\"$maxmount\"})*100 /(node_filesystem_avail_bytes {instance=~'$node',fstype=~\"ext.*|xfs\",mountpoint=\"$maxmount\"}+(node_filesystem_size_bytes{instance=~'$node',fstype=~\"ext.*|xfs\",mountpoint=\"$maxmount\"}-node_filesystem_free_bytes{instance=~'$node',fstype=~\"ext.*|xfs\",mountpoint=\"$maxmount\"}))", "hide": false, "instant": true, "interval": "", "legendFormat": "Used Max Mount($maxmount)", "refId": "D" }, { "expr": "(1 - ((node_memory_SwapFree_bytes{instance=~\"$node\"} + 1)/ (node_memory_SwapTotal_bytes{instance=~\"$node\"} + 1))) * 100", "instant": true, "interval": "", "legendFormat": "Used SWAP", "refId": "F" } ], "timeFrom": null, "timeShift": null, "transformations": [], "type": "bargauge" }, { "columns": [], "datasource": "prometheus", "description": "In this kanban: the total disk, usage, available, and usage rate are consistent with the values of the Size, Used, Avail, and Use% columns of the df command, and the value of Use% will be rounded to one decimal place, which will be more accurate .\n\nNote: The Use% algorithm in df is: (size-free) * 100 / (avail + (size-free)), the result is divisible by this value, non-divisible by this value is +1, and the unit of the result is %.\nRefer to the df command source code:", "fieldConfig": { "defaults": {}, "overrides": [] }, "fontSize": "80%", "gridPos": { "h": 6, "w": 10, "x": 5, "y": 16 }, "id": 181, "links": [ { "targetBlank": true, "title": "https://github.com/coreutils/coreutils/blob/master/src/df.c", "url": "https://github.com/coreutils/coreutils/blob/master/src/df.c" } ], "pageSize": null, "scroll": true, "showHeader": true, "sort": { "col": 6, "desc": false }, "styles": [ { "alias": "Mounted on", "align": "auto", "colorMode": null, "colors": [ "rgba(50, 172, 45, 0.97)", "rgba(237, 129, 40, 0.89)", "rgba(245, 54, 54, 0.9)" ], "dateFormat": "YYYY-MM-DD HH:mm:ss", "decimals": 2, "mappingType": 1, "pattern": "mountpoint", "thresholds": [ "" ], "type": "string", "unit": "bytes" }, { "alias": "Avail", "align": "auto", "colorMode": "value", "colors": [ "rgba(245, 54, 54, 0.9)", "rgba(237, 129, 40, 0.89)", "rgba(50, 172, 45, 0.97)" ], "dateFormat": "YYYY-MM-DD HH:mm:ss", "decimals": 1, "mappingType": 1, "pattern": "Value #A", "thresholds": [ "10000000000", "20000000000" ], "type": "number", "unit": "bytes" }, { "alias": "Used", "align": "auto", "colorMode": "cell", "colors": [ "rgba(50, 172, 45, 0.97)", "rgba(237, 129, 40, 0.89)", "rgba(245, 54, 54, 0.9)" ], "dateFormat": "YYYY-MM-DD HH:mm:ss", "decimals": 1, "mappingType": 1, "pattern": "Value #B", "thresholds": [ "70", "85" ], "type": "number", "unit": "percent" }, { "alias": "Size", "align": "auto", "colorMode": null, "colors": [ "rgba(245, 54, 54, 0.9)", "rgba(237, 129, 40, 0.89)", "rgba(50, 172, 45, 0.97)" ], "dateFormat": "YYYY-MM-DD HH:mm:ss", "decimals": 0, "link": false, "mappingType": 1, "pattern": "Value #C", "thresholds": [], "type": "number", "unit": "bytes" }, { "alias": "Filesystem", "align": "auto", "colorMode": null, "colors": [ "rgba(245, 54, 54, 0.9)", "rgba(237, 129, 40, 0.89)", "rgba(50, 172, 45, 0.97)" ], "dateFormat": "YYYY-MM-DD HH:mm:ss", "decimals": 2, "link": false, "mappingType": 1, "pattern": "fstype", "thresholds": [], "type": "string", "unit": "short" }, { "alias": "Device", "align": "auto", "colorMode": null, "colors": [ "rgba(245, 54, 54, 0.9)", "rgba(237, 129, 40, 0.89)", "rgba(50, 172, 45, 0.97)" ], "dateFormat": "YYYY-MM-DD HH:mm:ss", "decimals": 2, "link": false, "mappingType": 1, "pattern": "device", "preserveFormat": false, "sanitize": false, "thresholds": [], "type": "string", "unit": "short" }, { "alias": "", "align": "auto", "colorMode": null, "colors": [ "rgba(245, 54, 54, 0.9)", "rgba(237, 129, 40, 0.89)", "rgba(50, 172, 45, 0.97)" ], "decimals": 2, "pattern": "/.*/", "preserveFormat": true, "sanitize": false, "thresholds": [], "type": "hidden", "unit": "short" } ], "targets": [ { "expr": "node_filesystem_size_bytes{instance=~'$node',fstype=~\"ext.*|xfs\",mountpoint !~\".*pod.*\"}-0", "format": "table", "hide": false, "instant": true, "interval": "", "intervalFactor": 1, "legendFormat": "总量", "refId": "C" }, { "expr": "node_filesystem_avail_bytes {instance=~'$node',fstype=~\"ext.*|xfs\",mountpoint !~\".*pod.*\"}-0", "format": "table", "hide": false, "instant": true, "interval": "10s", "intervalFactor": 1, "legendFormat": "", "refId": "A" }, { "expr": "(node_filesystem_size_bytes{instance=~'$node',fstype=~\"ext.*|xfs\",mountpoint !~\".*pod.*\"}-node_filesystem_free_bytes{instance=~'$node',fstype=~\"ext.*|xfs\",mountpoint !~\".*pod.*\"}) *100/(node_filesystem_avail_bytes {instance=~'$node',fstype=~\"ext.*|xfs\",mountpoint !~\".*pod.*\"}+(node_filesystem_size_bytes{instance=~'$node',fstype=~\"ext.*|xfs\",mountpoint !~\".*pod.*\"}-node_filesystem_free_bytes{instance=~'$node',fstype=~\"ext.*|xfs\",mountpoint !~\".*pod.*\"}))", "format": "table", "hide": false, "instant": true, "interval": "", "intervalFactor": 1, "legendFormat": "", "refId": "B" } ], "title": "【$show_hostname】:Disk Space Used Basic(EXT?/XFS)", "transform": "table", "type": "table-old" }, { "cacheTimeout": null, "datasource": "prometheus", "description": "", "fieldConfig": { "defaults": { "decimals": 2, "mappings": [ { "id": 0, "op": "=", "text": "N/A", "type": 1, "value": "null" } ], "thresholds": { "mode": "absolute", "steps": [ { "color": "rgba(50, 172, 45, 0.97)", "value": null }, { "color": "rgba(237, 129, 40, 0.89)", "value": 20 }, { "color": "#d44a3a", "value": 50 } ] }, "unit": "percent" }, "overrides": [] }, "gridPos": { "h": 2, "w": 2, "x": 15, "y": 16 }, "id": 20, "interval": null, "links": [], "maxDataPoints": 100, "options": { "colorMode": "value", "graphMode": "area", "justifyMode": "auto", "orientation": "horizontal", "reduceOptions": { "calcs": [ "last" ], "fields": "", "values": false }, "text": {}, "textMode": "auto" }, "pluginVersion": "7.5.4", "targets": [ { "expr": "avg(rate(node_cpu_seconds_total{instance=~\"$node\",mode=\"iowait\"}[$interval])) * 100", "format": "time_series", "hide": false, "instant": false, "interval": "", "intervalFactor": 1, "legendFormat": "", "refId": "A", "step": 20 } ], "timeFrom": null, "timeShift": null, "title": "CPU iowait", "type": "stat" }, { "aliasColors": { "cn-shenzhen.i-wz9cq1dcb6zwc39ehw59_cni0_in": "light-red", "cn-shenzhen.i-wz9cq1dcb6zwc39ehw59_cni0_in下载": "green", "cn-shenzhen.i-wz9cq1dcb6zwc39ehw59_cni0_out上传": "yellow", "cn-shenzhen.i-wz9cq1dcb6zwc39ehw59_eth0_in下载": "purple", "cn-shenzhen.i-wz9cq1dcb6zwc39ehw59_eth0_out": "purple", "cn-shenzhen.i-wz9cq1dcb6zwc39ehw59_eth0_out上传": "blue" }, "bars": true, "dashLength": 10, "dashes": false, "datasource": "prometheus", "editable": true, "error": false, "fieldConfig": { "defaults": { "links": [] }, "overrides": [] }, "fill": 1, "fillGradient": 0, "grid": {}, "gridPos": { "h": 6, "w": 7, "x": 17, "y": 16 }, "hiddenSeries": false, "id": 183, "legend": { "alignAsTable": true, "avg": true, "current": true, "hideEmpty": true, "hideZero": true, "max": true, "min": false, "show": false, "sort": "current", "sortDesc": true, "total": true, "values": true }, "lines": false, "linewidth": 2, "links": [], "nullPointMode": "null as zero", "options": { "alertThreshold": true }, "percentage": false, "pluginVersion": "7.5.4", "pointradius": 1, "points": false, "renderer": "flot", "repeat": null, "seriesOverrides": [ { "alias": "/.*_transmit$/", "transform": "negative-Y" } ], "spaceLength": 10, "stack": false, "steppedLine": false, "targets": [ { "expr": "increase(node_network_receive_bytes_total{instance=~\"$node\",device=~\"$device\"}[60m])", "interval": "60m", "intervalFactor": 1, "legendFormat": "{{device}}_receive", "metric": "", "refId": "A", "step": 600, "target": "" }, { "expr": "increase(node_network_transmit_bytes_total{instance=~\"$node\",device=~\"$device\"}[60m])", "hide": false, "interval": "60m", "intervalFactor": 1, "legendFormat": "{{device}}_transmit", "refId": "B", "step": 600 } ], "thresholds": [], "timeFrom": null, "timeRegions": [], "timeShift": null, "title": "Internet traffic per hour $device", "tooltip": { "msResolution": false, "shared": true, "sort": 0, "value_type": "cumulative" }, "type": "graph", "xaxis": { "buckets": null, "mode": "time", "name": null, "show": true, "values": [] }, "yaxes": [ { "format": "bytes", "label": "transmit(-)/receive(+)", "logBase": 1, "max": null, "min": null, "show": true }, { "format": "short", "logBase": 1, "max": null, "min": null, "show": false } ], "yaxis": { "align": false, "alignLevel": null } }, { "cacheTimeout": null, "datasource": "prometheus", "description": "", "fieldConfig": { "defaults": { "mappings": [ { "id": 0, "op": "=", "text": "N/A", "type": 1, "value": "null" } ], "thresholds": { "mode": "absolute", "steps": [ { "color": "rgba(245, 54, 54, 0.9)", "value": null }, { "color": "rgba(237, 129, 40, 0.89)", "value": 1 }, { "color": "rgba(50, 172, 45, 0.97)", "value": 2 } ] }, "unit": "short" }, "overrides": [] }, "gridPos": { "h": 2, "w": 2, "x": 0, "y": 18 }, "id": 14, "interval": null, "links": [], "maxDataPoints": 100, "options": { "colorMode": "value", "graphMode": "none", "justifyMode": "auto", "orientation": "horizontal", "reduceOptions": { "calcs": [ "lastNotNull" ], "fields": "", "values": false }, "text": {}, "textMode": "value" }, "pluginVersion": "7.5.4", "targets": [ { "expr": "count(node_cpu_seconds_total{instance=~\"$node\", mode='system'})", "format": "time_series", "instant": true, "interval": "", "intervalFactor": 1, "legendFormat": "", "refId": "A", "step": 20 } ], "title": "CPU Cores", "type": "stat" }, { "cacheTimeout": null, "datasource": "prometheus", "description": "", "fieldConfig": { "defaults": { "mappings": [ { "id": 0, "op": "=", "text": "N/A", "type": 1, "value": "null" } ], "thresholds": { "mode": "absolute", "steps": [ { "color": "rgba(245, 54, 54, 0.9)", "value": null }, { "color": "rgba(237, 129, 40, 0.89)", "value": 100000 }, { "color": "rgba(50, 172, 45, 0.97)", "value": 1000000 } ] }, "unit": "short" }, "overrides": [] }, "gridPos": { "h": 2, "w": 2, "x": 15, "y": 18 }, "id": 179, "interval": null, "links": [], "maxDataPoints": 100, "options": { "colorMode": "value", "graphMode": "none", "justifyMode": "auto", "orientation": "horizontal", "reduceOptions": { "calcs": [ "lastNotNull" ], "fields": "", "values": false }, "text": {}, "textMode": "auto" }, "pluginVersion": "7.5.4", "targets": [ { "expr": "avg(node_filesystem_files_free{instance=~\"$node\",mountpoint=\"$maxmount\",fstype=~\"ext.?|xfs\"})", "format": "time_series", "instant": true, "interval": "", "intervalFactor": 1, "legendFormat": "", "refId": "A", "step": 20 } ], "title": "Free inodes:$maxmount ", "type": "stat" }, { "cacheTimeout": null, "datasource": "prometheus", "description": "", "fieldConfig": { "defaults": { "decimals": 0, "mappings": [ { "id": 0, "op": "=", "text": "N/A", "type": 1, "value": "null" } ], "thresholds": { "mode": "absolute", "steps": [ { "color": "rgba(245, 54, 54, 0.9)", "value": null }, { "color": "rgba(237, 129, 40, 0.89)", "value": 2 }, { "color": "rgba(50, 172, 45, 0.97)", "value": 3 } ] }, "unit": "bytes" }, "overrides": [] }, "gridPos": { "h": 2, "w": 2, "x": 0, "y": 20 }, "id": 75, "interval": null, "links": [], "maxDataPoints": 100, "options": { "colorMode": "value", "graphMode": "none", "justifyMode": "auto", "orientation": "horizontal", "reduceOptions": { "calcs": [ "lastNotNull" ], "fields": "", "values": false }, "text": {}, "textMode": "auto" }, "pluginVersion": "7.5.4", "targets": [ { "expr": "sum(node_memory_MemTotal_bytes{instance=~\"$node\"})", "format": "time_series", "instant": true, "interval": "", "intervalFactor": 1, "legendFormat": "{{instance}}", "refId": "A", "step": 20 } ], "title": "Total RAM", "type": "stat" }, { "cacheTimeout": null, "datasource": "prometheus", "description": "", "fieldConfig": { "defaults": { "mappings": [ { "id": 0, "op": "=", "text": "N/A", "type": 1, "value": "null" } ], "thresholds": { "mode": "absolute", "steps": [ { "color": "rgba(245, 54, 54, 0.9)", "value": null }, { "color": "rgba(237, 129, 40, 0.89)", "value": 1024 }, { "color": "rgba(50, 172, 45, 0.97)", "value": 10000 } ] }, "unit": "locale" }, "overrides": [] }, "gridPos": { "h": 2, "w": 2, "x": 15, "y": 20 }, "id": 178, "interval": null, "links": [], "maxDataPoints": 100, "options": { "colorMode": "value", "graphMode": "none", "justifyMode": "auto", "orientation": "horizontal", "reduceOptions": { "calcs": [ "lastNotNull" ], "fields": "", "values": false }, "text": {}, "textMode": "auto" }, "pluginVersion": "7.5.4", "targets": [ { "expr": "avg(node_filefd_maximum{instance=~\"$node\"})", "format": "time_series", "instant": true, "intervalFactor": 1, "legendFormat": "", "refId": "A", "step": 20 } ], "title": "Total filefd", "type": "stat" }, { "aliasColors": { "192.168.200.241:9100_Total": "dark-red", "Idle - Waiting for something to happen": "#052B51", "guest": "#9AC48A", "idle": "#052B51", "iowait": "#EAB839", "irq": "#BF1B00", "nice": "#C15C17", "sdb_每秒I/O操作%": "#d683ce", "softirq": "#E24D42", "steal": "#FCE2DE", "system": "#508642", "user": "#5195CE", "磁盘花费在I/O操作占比": "#ba43a9" }, "bars": false, "dashLength": 10, "dashes": false, "datasource": "prometheus", "decimals": 2, "description": "", "fieldConfig": { "defaults": { "links": [] }, "overrides": [] }, "fill": 1, "fillGradient": 0, "gridPos": { "h": 8, "w": 8, "x": 0, "y": 22 }, "hiddenSeries": false, "id": 7, "legend": { "alignAsTable": true, "avg": true, "current": true, "hideEmpty": true, "hideZero": true, "max": true, "min": true, "rightSide": false, "show": true, "sideWidth": null, "sort": "current", "sortDesc": true, "total": false, "values": true }, "lines": true, "linewidth": 2, "links": [], "maxPerRow": 6, "nullPointMode": "null", "options": { "alertThreshold": true }, "percentage": false, "pluginVersion": "7.5.4", "pointradius": 5, "points": false, "renderer": "flot", "repeat": null, "seriesOverrides": [ { "alias": "/.*Total/", "color": "#C4162A", "fill": 0 } ], "spaceLength": 10, "stack": false, "steppedLine": false, "targets": [ { "expr": "avg(rate(node_cpu_seconds_total{instance=~\"$node\",mode=\"system\"}[$interval])) by (instance) *100", "format": "time_series", "hide": false, "instant": false, "interval": "", "intervalFactor": 1, "legendFormat": "System", "refId": "A", "step": 20 }, { "expr": "avg(rate(node_cpu_seconds_total{instance=~\"$node\",mode=\"user\"}[$interval])) by (instance) *100", "format": "time_series", "hide": false, "interval": "", "intervalFactor": 1, "legendFormat": "User", "refId": "B", "step": 240 }, { "expr": "avg(rate(node_cpu_seconds_total{instance=~\"$node\",mode=\"iowait\"}[$interval])) by (instance) *100", "format": "time_series", "hide": false, "instant": false, "interval": "", "intervalFactor": 1, "legendFormat": "Iowait", "refId": "D", "step": 240 }, { "expr": "(1 - avg(rate(node_cpu_seconds_total{instance=~\"$node\",mode=\"idle\"}[$interval])) by (instance))*100", "format": "time_series", "hide": false, "interval": "", "intervalFactor": 1, "legendFormat": "Total", "refId": "F", "step": 240 } ], "thresholds": [], "timeFrom": null, "timeRegions": [], "timeShift": null, "title": "CPU% Basic", "tooltip": { "shared": true, "sort": 2, "value_type": "individual" }, "type": "graph", "xaxis": { "buckets": null, "mode": "time", "name": null, "show": true, "values": [] }, "yaxes": [ { "decimals": 0, "format": "percent", "label": "", "logBase": 1, "max": null, "min": null, "show": true }, { "format": "short", "label": null, "logBase": 1, "max": null, "min": null, "show": false } ], "yaxis": { "align": false, "alignLevel": null } }, { "aliasColors": { "192.168.200.241:9100_总内存": "dark-red", "使用率": "yellow", "内存_Avaliable": "#6ED0E0", "内存_Cached": "#EF843C", "内存_Free": "#629E51", "内存_Total": "#6d1f62", "内存_Used": "#eab839", "可用": "#9ac48a", "总内存": "#bf1b00" }, "bars": false, "dashLength": 10, "dashes": false, "datasource": "prometheus", "decimals": 2, "fieldConfig": { "defaults": { "links": [] }, "overrides": [] }, "fill": 1, "fillGradient": 0, "gridPos": { "h": 8, "w": 8, "x": 8, "y": 22 }, "height": "300", "hiddenSeries": false, "id": 156, "legend": { "alignAsTable": true, "avg": true, "current": true, "hideEmpty": true, "hideZero": true, "max": true, "min": true, "rightSide": false, "show": true, "sort": "current", "sortDesc": true, "total": false, "values": true }, "lines": true, "linewidth": 2, "links": [], "nullPointMode": "null", "options": { "alertThreshold": true }, "percentage": false, "pluginVersion": "7.5.4", "pointradius": 5, "points": false, "renderer": "flot", "seriesOverrides": [ { "alias": "Total", "color": "#C4162A", "fill": 0 }, { "alias": "Used%", "color": "rgb(0, 209, 255)", "lines": false, "pointradius": 1, "points": true, "yaxis": 2 } ], "spaceLength": 10, "stack": false, "steppedLine": false, "targets": [ { "expr": "node_memory_MemTotal_bytes{instance=~\"$node\"}", "format": "time_series", "hide": false, "instant": false, "interval": "", "intervalFactor": 1, "legendFormat": "Total", "refId": "A", "step": 4 }, { "expr": "node_memory_MemTotal_bytes{instance=~\"$node\"} - node_memory_MemAvailable_bytes{instance=~\"$node\"}", "format": "time_series", "hide": false, "interval": "", "intervalFactor": 1, "legendFormat": "Used", "refId": "B", "step": 4 }, { "expr": "node_memory_MemAvailable_bytes{instance=~\"$node\"}", "format": "time_series", "hide": false, "interval": "", "intervalFactor": 1, "legendFormat": "Avaliable", "refId": "F", "step": 4 }, { "expr": "node_memory_Buffers_bytes{instance=~\"$node\"}", "format": "time_series", "hide": true, "interval": "", "intervalFactor": 1, "legendFormat": "内存_Buffers", "refId": "D", "step": 4 }, { "expr": "node_memory_MemFree_bytes{instance=~\"$node\"}", "format": "time_series", "hide": true, "intervalFactor": 1, "legendFormat": "内存_Free", "refId": "C", "step": 4 }, { "expr": "node_memory_Cached_bytes{instance=~\"$node\"}", "format": "time_series", "hide": true, "intervalFactor": 1, "legendFormat": "内存_Cached", "refId": "E", "step": 4 }, { "expr": "node_memory_MemTotal_bytes{instance=~\"$node\"} - (node_memory_Cached_bytes{instance=~\"$node\"} + node_memory_Buffers_bytes{instance=~\"$node\"} + node_memory_MemFree_bytes{instance=~\"$node\"})", "format": "time_series", "hide": true, "intervalFactor": 1, "refId": "G" }, { "expr": "(1 - (node_memory_MemAvailable_bytes{instance=~\"$node\"} / (node_memory_MemTotal_bytes{instance=~\"$node\"})))* 100", "format": "time_series", "hide": false, "interval": "30m", "intervalFactor": 10, "legendFormat": "Used%", "refId": "H" } ], "thresholds": [], "timeFrom": null, "timeRegions": [], "timeShift": null, "title": "Memory Basic", "tooltip": { "shared": true, "sort": 2, "value_type": "individual" }, "type": "graph", "xaxis": { "buckets": null, "mode": "time", "name": null, "show": true, "values": [] }, "yaxes": [ { "format": "bytes", "label": null, "logBase": 1, "max": null, "min": "0", "show": true }, { "format": "percent", "label": "Utilization%", "logBase": 1, "max": "100", "min": "0", "show": true } ], "yaxis": { "align": false, "alignLevel": null } }, { "aliasColors": { "192.168.10.227:9100_em1_in下载": "super-light-green", "192.168.10.227:9100_em1_out上传": "dark-blue" }, "bars": false, "dashLength": 10, "dashes": false, "datasource": "prometheus", "decimals": 2, "fieldConfig": { "defaults": { "links": [] }, "overrides": [] }, "fill": 1, "fillGradient": 0, "gridPos": { "h": 8, "w": 8, "x": 16, "y": 22 }, "height": "300", "hiddenSeries": false, "id": 157, "legend": { "alignAsTable": true, "avg": true, "current": true, "hideEmpty": true, "hideZero": true, "max": true, "min": true, "rightSide": false, "show": true, "sort": "current", "sortDesc": true, "total": false, "values": true }, "lines": true, "linewidth": 1, "links": [], "nullPointMode": "null", "options": { "alertThreshold": true }, "percentage": false, "pluginVersion": "7.5.4", "pointradius": 2, "points": false, "renderer": "flot", "seriesOverrides": [ { "alias": "/.*_transmit$/", "transform": "negative-Y" } ], "spaceLength": 10, "stack": false, "steppedLine": false, "targets": [ { "expr": "rate(node_network_receive_bytes_total{instance=~'$node',device=~\"$device\"}[$interval])*8", "format": "time_series", "interval": "", "intervalFactor": 1, "legendFormat": "{{device}}_receive", "refId": "A", "step": 4 }, { "expr": "rate(node_network_transmit_bytes_total{instance=~'$node',device=~\"$device\"}[$interval])*8", "format": "time_series", "interval": "", "intervalFactor": 1, "legendFormat": "{{device}}_transmit", "refId": "B", "step": 4 } ], "thresholds": [], "timeFrom": null, "timeRegions": [], "timeShift": null, "title": "Network bandwidth usage per second $device", "tooltip": { "shared": true, "sort": 2, "value_type": "individual" }, "type": "graph", "xaxis": { "buckets": null, "mode": "time", "name": null, "show": true, "values": [] }, "yaxes": [ { "format": "bps", "label": "transmit(-)/receive(+)", "logBase": 1, "max": null, "min": null, "show": true }, { "format": "short", "label": null, "logBase": 1, "max": null, "min": null, "show": false } ], "yaxis": { "align": false, "alignLevel": null } }, { "aliasColors": { "15分钟": "#6ED0E0", "1分钟": "#BF1B00", "5分钟": "#CCA300" }, "bars": false, "dashLength": 10, "dashes": false, "datasource": "prometheus", "decimals": 2, "editable": true, "error": false, "fieldConfig": { "defaults": { "links": [] }, "overrides": [] }, "fill": 1, "fillGradient": 1, "grid": {}, "gridPos": { "h": 8, "w": 8, "x": 0, "y": 30 }, "height": "300", "hiddenSeries": false, "id": 13, "legend": { "alignAsTable": true, "avg": true, "current": true, "hideEmpty": true, "hideZero": true, "max": true, "min": true, "rightSide": false, "show": true, "sort": "current", "sortDesc": true, "total": false, "values": true }, "lines": true, "linewidth": 2, "links": [], "maxPerRow": 6, "nullPointMode": "null", "options": { "alertThreshold": true }, "percentage": false, "pluginVersion": "7.5.4", "pointradius": 5, "points": false, "renderer": "flot", "repeat": null, "seriesOverrides": [ { "alias": "/.*CPU cores/", "color": "#C4162A" } ], "spaceLength": 10, "stack": false, "steppedLine": false, "targets": [ { "expr": "node_load1{instance=~\"$node\"}", "format": "time_series", "instant": false, "interval": "", "intervalFactor": 1, "legendFormat": "1m", "metric": "", "refId": "A", "step": 20, "target": "" }, { "expr": "node_load5{instance=~\"$node\"}", "format": "time_series", "instant": false, "interval": "", "intervalFactor": 1, "legendFormat": "5m", "refId": "B", "step": 20 }, { "expr": "node_load15{instance=~\"$node\"}", "format": "time_series", "instant": false, "interval": "", "intervalFactor": 1, "legendFormat": "15m", "refId": "C", "step": 20 }, { "expr": " sum(count(node_cpu_seconds_total{instance=~\"$node\", mode='system'}) by (cpu,instance)) by(instance)", "format": "time_series", "instant": false, "interval": "", "intervalFactor": 1, "legendFormat": "CPU cores", "refId": "D", "step": 20 } ], "thresholds": [], "timeFrom": null, "timeRegions": [], "timeShift": null, "title": "System Load", "tooltip": { "msResolution": false, "shared": true, "sort": 2, "value_type": "cumulative" }, "type": "graph", "xaxis": { "buckets": null, "mode": "time", "name": null, "show": true, "values": [] }, "yaxes": [ { "format": "short", "logBase": 1, "max": null, "min": null, "show": true }, { "format": "short", "logBase": 1, "max": null, "min": null, "show": true } ], "yaxis": { "align": false, "alignLevel": null } }, { "aliasColors": { "vda_write": "#6ED0E0" }, "bars": false, "dashLength": 10, "dashes": false, "datasource": "prometheus", "decimals": 2, "description": "Per second read / write bytes ", "fieldConfig": { "defaults": { "links": [] }, "overrides": [] }, "fill": 1, "fillGradient": 1, "gridPos": { "h": 8, "w": 8, "x": 8, "y": 30 }, "height": "300", "hiddenSeries": false, "id": 168, "legend": { "alignAsTable": true, "avg": true, "current": true, "hideEmpty": true, "hideZero": true, "max": true, "min": true, "show": true, "sort": "current", "sortDesc": true, "total": false, "values": true }, "lines": true, "linewidth": 2, "links": [], "nullPointMode": "null", "options": { "alertThreshold": true }, "percentage": false, "pluginVersion": "7.5.4", "pointradius": 5, "points": false, "renderer": "flot", "seriesOverrides": [ { "alias": "/.*_Read bytes$/", "transform": "negative-Y" } ], "spaceLength": 10, "stack": false, "steppedLine": false, "targets": [ { "expr": "rate(node_disk_read_bytes_total{instance=~\"$node\"}[$interval])", "format": "time_series", "interval": "", "intervalFactor": 1, "legendFormat": "{{device}}_Read bytes", "refId": "A", "step": 10 }, { "expr": "rate(node_disk_written_bytes_total{instance=~\"$node\"}[$interval])", "format": "time_series", "hide": false, "interval": "", "intervalFactor": 1, "legendFormat": "{{device}}_Written bytes", "refId": "B", "step": 10 } ], "thresholds": [], "timeFrom": null, "timeRegions": [], "timeShift": null, "title": "Disk R/W Data", "tooltip": { "shared": true, "sort": 2, "value_type": "individual" }, "type": "graph", "xaxis": { "buckets": null, "mode": "time", "name": null, "show": true, "values": [] }, "yaxes": [ { "decimals": null, "format": "Bps", "label": "Bytes read (-) / write (+)", "logBase": 1, "max": null, "min": null, "show": true }, { "format": "short", "label": null, "logBase": 1, "max": null, "min": null, "show": false } ], "yaxis": { "align": false, "alignLevel": null } }, { "aliasColors": {}, "bars": false, "dashLength": 10, "dashes": false, "datasource": "prometheus", "decimals": 1, "description": "", "fieldConfig": { "defaults": { "links": [] }, "overrides": [] }, "fill": 0, "fillGradient": 0, "gridPos": { "h": 8, "w": 8, "x": 16, "y": 30 }, "hiddenSeries": false, "id": 174, "legend": { "alignAsTable": true, "avg": true, "current": true, "hideEmpty": true, "hideZero": true, "max": true, "min": true, "rightSide": false, "show": true, "sideWidth": null, "sort": "current", "sortDesc": true, "total": false, "values": true }, "lines": true, "linewidth": 2, "links": [], "nullPointMode": "null", "options": { "alertThreshold": true }, "percentage": false, "pluginVersion": "7.5.4", "pointradius": 5, "points": false, "renderer": "flot", "seriesOverrides": [ { "alias": "/Inodes.*/", "yaxis": 2 } ], "spaceLength": 10, "stack": false, "steppedLine": false, "targets": [ { "expr": "(node_filesystem_size_bytes{instance=~'$node',fstype=~\"ext.*|xfs\",mountpoint !~\".*pod.*\"}-node_filesystem_free_bytes{instance=~'$node',fstype=~\"ext.*|xfs\",mountpoint !~\".*pod.*\"}) *100/(node_filesystem_avail_bytes {instance=~'$node',fstype=~\"ext.*|xfs\",mountpoint !~\".*pod.*\"}+(node_filesystem_size_bytes{instance=~'$node',fstype=~\"ext.*|xfs\",mountpoint !~\".*pod.*\"}-node_filesystem_free_bytes{instance=~'$node',fstype=~\"ext.*|xfs\",mountpoint !~\".*pod.*\"}))", "format": "time_series", "instant": false, "interval": "", "intervalFactor": 1, "legendFormat": "{{mountpoint}}", "refId": "A" }, { "expr": "node_filesystem_files_free{instance=~'$node',fstype=~\"ext.?|xfs\"} / node_filesystem_files{instance=~'$node',fstype=~\"ext.?|xfs\"}", "hide": true, "interval": "", "legendFormat": "Inodes:{{instance}}:{{mountpoint}}", "refId": "B" } ], "thresholds": [], "timeFrom": null, "timeRegions": [], "timeShift": null, "title": "Disk Space Used% Basic", "tooltip": { "shared": true, "sort": 2, "value_type": "individual" }, "type": "graph", "xaxis": { "buckets": null, "mode": "time", "name": null, "show": true, "values": [] }, "yaxes": [ { "decimals": null, "format": "percent", "label": "", "logBase": 1, "max": "100", "min": "0", "show": true }, { "decimals": 2, "format": "percentunit", "label": null, "logBase": 1, "max": "1", "min": null, "show": false } ], "yaxis": { "align": false, "alignLevel": null } }, { "aliasColors": { "vda_write": "#6ED0E0" }, "bars": false, "dashLength": 10, "dashes": false, "datasource": "prometheus", "decimals": 2, "description": "Read/write completions per second\n\nWrites completed: 每个磁盘分区每秒写完成次数\n\nIO now 每个磁盘分区每秒正在处理的输入/输出请求数", "fieldConfig": { "defaults": { "links": [] }, "overrides": [] }, "fill": 0, "fillGradient": 0, "gridPos": { "h": 9, "w": 8, "x": 0, "y": 38 }, "height": "300", "hiddenSeries": false, "id": 161, "legend": { "alignAsTable": true, "avg": true, "current": true, "hideEmpty": true, "hideZero": true, "max": true, "min": true, "show": true, "sort": "max", "sortDesc": false, "total": false, "values": true }, "lines": true, "linewidth": 1, "links": [], "nullPointMode": "null", "options": { "alertThreshold": true }, "percentage": false, "pluginVersion": "7.5.4", "pointradius": 5, "points": false, "renderer": "flot", "seriesOverrides": [ { "alias": "/.*_Reads completed$/", "transform": "negative-Y" } ], "spaceLength": 10, "stack": false, "steppedLine": false, "targets": [ { "expr": "rate(node_disk_reads_completed_total{instance=~\"$node\"}[$interval])", "format": "time_series", "hide": false, "interval": "", "intervalFactor": 1, "legendFormat": "{{device}}_Reads completed", "refId": "A", "step": 10 }, { "expr": "rate(node_disk_writes_completed_total{instance=~\"$node\"}[$interval])", "format": "time_series", "hide": false, "interval": "", "intervalFactor": 1, "legendFormat": "{{device}}_Writes completed", "refId": "B", "step": 10 }, { "expr": "node_disk_io_now{instance=~\"$node\"}", "format": "time_series", "hide": true, "interval": "", "intervalFactor": 1, "legendFormat": "{{device}}", "refId": "C" } ], "thresholds": [], "timeFrom": null, "timeRegions": [], "timeShift": null, "title": "Disk IOps Completed(IOPS)", "tooltip": { "shared": true, "sort": 2, "value_type": "individual" }, "type": "graph", "xaxis": { "buckets": null, "mode": "time", "name": null, "show": true, "values": [] }, "yaxes": [ { "decimals": null, "format": "iops", "label": "IO read (-) / write (+)", "logBase": 1, "max": null, "min": null, "show": true }, { "format": "short", "label": null, "logBase": 1, "max": null, "min": null, "show": true } ], "yaxis": { "align": false, "alignLevel": null } }, { "aliasColors": { "Idle - Waiting for something to happen": "#052B51", "guest": "#9AC48A", "idle": "#052B51", "iowait": "#EAB839", "irq": "#BF1B00", "nice": "#C15C17", "sdb_每秒I/O操作%": "#d683ce", "softirq": "#E24D42", "steal": "#FCE2DE", "system": "#508642", "user": "#5195CE", "磁盘花费在I/O操作占比": "#ba43a9" }, "bars": false, "dashLength": 10, "dashes": false, "datasource": "prometheus", "decimals": null, "description": "The time spent on I/O in the natural time of each second.(wall-clock time)", "fieldConfig": { "defaults": { "links": [] }, "overrides": [] }, "fill": 1, "fillGradient": 0, "gridPos": { "h": 9, "w": 8, "x": 8, "y": 38 }, "hiddenSeries": false, "id": 175, "legend": { "alignAsTable": true, "avg": true, "current": true, "hideEmpty": true, "hideZero": true, "max": true, "min": false, "rightSide": false, "show": true, "sideWidth": null, "sort": null, "sortDesc": null, "total": false, "values": true }, "lines": true, "linewidth": 1, "links": [], "maxPerRow": 6, "nullPointMode": "null", "options": { "alertThreshold": true }, "percentage": false, "pluginVersion": "7.5.4", "pointradius": 5, "points": false, "renderer": "flot", "seriesOverrides": [], "spaceLength": 10, "stack": false, "steppedLine": false, "targets": [ { "expr": "rate(node_disk_io_time_seconds_total{instance=~\"$node\"}[$interval])", "format": "time_series", "interval": "", "intervalFactor": 1, "legendFormat": "{{device}}_ IO time", "refId": "C" } ], "thresholds": [], "timeFrom": null, "timeRegions": [], "timeShift": null, "title": "Time Spent Doing I/Os", "tooltip": { "shared": true, "sort": 2, "value_type": "individual" }, "type": "graph", "xaxis": { "buckets": null, "mode": "time", "name": null, "show": true, "values": [] }, "yaxes": [ { "decimals": null, "format": "percentunit", "label": "", "logBase": 1, "max": null, "min": null, "show": true }, { "format": "short", "label": null, "logBase": 1, "max": null, "min": null, "show": false } ], "yaxis": { "align": false, "alignLevel": null } }, { "aliasColors": { "vda": "#6ED0E0" }, "bars": false, "dashLength": 10, "dashes": false, "datasource": "prometheus", "decimals": 2, "description": "Time spent on each read/write operation", "fieldConfig": { "defaults": { "links": [] }, "overrides": [] }, "fill": 1, "fillGradient": 1, "gridPos": { "h": 9, "w": 8, "x": 16, "y": 38 }, "height": "300", "hiddenSeries": false, "id": 160, "legend": { "alignAsTable": true, "avg": true, "current": true, "hideEmpty": true, "hideZero": true, "max": true, "min": true, "show": true, "sort": "current", "sortDesc": true, "total": false, "values": true }, "lines": true, "linewidth": 2, "links": [], "nullPointMode": "null as zero", "options": { "alertThreshold": true }, "percentage": false, "pluginVersion": "7.5.4", "pointradius": 5, "points": false, "renderer": "flot", "seriesOverrides": [ { "alias": "/,*_Read time$/", "transform": "negative-Y" } ], "spaceLength": 10, "stack": false, "steppedLine": false, "targets": [ { "expr": "rate(node_disk_read_time_seconds_total{instance=~\"$node\"}[$interval]) / rate(node_disk_reads_completed_total{instance=~\"$node\"}[$interval])", "format": "time_series", "hide": false, "instant": false, "interval": "", "intervalFactor": 1, "legendFormat": "{{device}}_Read time", "refId": "B" }, { "expr": "rate(node_disk_write_time_seconds_total{instance=~\"$node\"}[$interval]) / rate(node_disk_writes_completed_total{instance=~\"$node\"}[$interval])", "format": "time_series", "hide": false, "instant": false, "interval": "", "intervalFactor": 1, "legendFormat": "{{device}}_Write time", "refId": "C" }, { "expr": "rate(node_disk_io_time_seconds_total{instance=~\"$node\"}[$interval])", "format": "time_series", "hide": true, "interval": "", "intervalFactor": 1, "legendFormat": "{{device}}", "refId": "A", "step": 10 }, { "expr": "rate(node_disk_io_time_weighted_seconds_total{instance=~\"$node\"}[$interval])", "format": "time_series", "hide": true, "interval": "", "intervalFactor": 1, "legendFormat": "{{device}}_加权", "refId": "D" } ], "thresholds": [], "timeFrom": null, "timeRegions": [], "timeShift": null, "title": "Disk R/W Time(Reference: less than 100ms)(beta)", "tooltip": { "shared": true, "sort": 2, "value_type": "individual" }, "type": "graph", "xaxis": { "buckets": null, "mode": "time", "name": null, "show": true, "values": [] }, "yaxes": [ { "format": "s", "label": "Time read (-) / write (+)", "logBase": 1, "max": null, "min": null, "show": true }, { "format": "short", "label": null, "logBase": 1, "max": null, "min": null, "show": false } ], "yaxis": { "align": false, "alignLevel": null } }, { "aliasColors": { "192.168.200.241:9100_TCP_alloc": "semi-dark-blue", "TCP": "#6ED0E0", "TCP_alloc": "blue" }, "bars": false, "dashLength": 10, "dashes": false, "datasource": "prometheus", "decimals": 2, "description": "Sockets_used - Sockets currently in use\n\nCurrEstab - TCP connections for which the current state is either ESTABLISHED or CLOSE- WAIT\n\nTCP_alloc - Allocated sockets\n\nTCP_tw - Sockets wating close\n\nUDP_inuse - Udp sockets currently in use\n\nRetransSegs - TCP retransmission packets\n\nOutSegs - Number of packets sent by TCP\n\nInSegs - Number of packets received by TCP", "fieldConfig": { "defaults": { "links": [] }, "overrides": [] }, "fill": 0, "fillGradient": 0, "gridPos": { "h": 8, "w": 16, "x": 0, "y": 47 }, "height": "300", "hiddenSeries": false, "id": 158, "interval": "", "legend": { "alignAsTable": true, "avg": false, "current": true, "hideEmpty": true, "hideZero": true, "max": true, "min": false, "rightSide": true, "show": true, "sideWidth": null, "sort": "current", "sortDesc": true, "total": false, "values": true }, "lines": true, "linewidth": 1, "links": [], "nullPointMode": "null", "options": { "alertThreshold": true }, "percentage": false, "pluginVersion": "7.5.4", "pointradius": 5, "points": false, "renderer": "flot", "seriesOverrides": [ { "alias": "/.*Sockets_used/", "color": "#E02F44", "lines": false, "pointradius": 1, "points": true, "yaxis": 2 } ], "spaceLength": 10, "stack": false, "steppedLine": false, "targets": [ { "expr": "node_netstat_Tcp_CurrEstab{instance=~'$node'}", "format": "time_series", "hide": false, "instant": false, "interval": "", "intervalFactor": 1, "legendFormat": "CurrEstab", "refId": "A", "step": 20 }, { "expr": "node_sockstat_TCP_tw{instance=~'$node'}", "format": "time_series", "interval": "", "intervalFactor": 1, "legendFormat": "TCP_tw", "refId": "D" }, { "expr": "node_sockstat_sockets_used{instance=~'$node'}", "hide": false, "interval": "30m", "intervalFactor": 1, "legendFormat": "Sockets_used", "refId": "B" }, { "expr": "node_sockstat_UDP_inuse{instance=~'$node'}", "interval": "", "legendFormat": "UDP_inuse", "refId": "C" }, { "expr": "node_sockstat_TCP_alloc{instance=~'$node'}", "interval": "", "legendFormat": "TCP_alloc", "refId": "E" }, { "expr": "rate(node_netstat_Tcp_PassiveOpens{instance=~'$node'}[$interval])", "hide": true, "interval": "", "legendFormat": "{{instance}}_Tcp_PassiveOpens", "refId": "G" }, { "expr": "rate(node_netstat_Tcp_ActiveOpens{instance=~'$node'}[$interval])", "hide": true, "interval": "", "legendFormat": "{{instance}}_Tcp_ActiveOpens", "refId": "F" }, { "expr": "rate(node_netstat_Tcp_InSegs{instance=~'$node'}[$interval])", "interval": "", "legendFormat": "Tcp_InSegs", "refId": "H" }, { "expr": "rate(node_netstat_Tcp_OutSegs{instance=~'$node'}[$interval])", "interval": "", "legendFormat": "Tcp_OutSegs", "refId": "I" }, { "expr": "rate(node_netstat_Tcp_RetransSegs{instance=~'$node'}[$interval])", "hide": false, "interval": "", "legendFormat": "Tcp_RetransSegs", "refId": "J" }, { "expr": "rate(node_netstat_TcpExt_ListenDrops{instance=~'$node'}[$interval])", "hide": true, "interval": "", "legendFormat": "", "refId": "K" } ], "thresholds": [], "timeFrom": null, "timeRegions": [], "timeShift": null, "title": "Network Sockstat", "tooltip": { "shared": true, "sort": 2, "value_type": "individual" }, "transformations": [], "type": "graph", "xaxis": { "buckets": null, "mode": "time", "name": null, "show": true, "values": [] }, "yaxes": [ { "format": "short", "label": null, "logBase": 1, "max": null, "min": null, "show": true }, { "format": "short", "label": "Total_Sockets_used", "logBase": 1, "max": null, "min": null, "show": true } ], "yaxis": { "align": false, "alignLevel": null } }, { "aliasColors": { "filefd_192.168.200.241:9100": "super-light-green", "switches_192.168.200.241:9100": "semi-dark-red", "使用的文件描述符_10.118.72.128:9100": "red", "每秒上下文切换次数_10.118.71.245:9100": "yellow", "每秒上下文切换次数_10.118.72.128:9100": "yellow" }, "bars": false, "cacheTimeout": null, "dashLength": 10, "dashes": false, "datasource": "prometheus", "description": "", "fieldConfig": { "defaults": { "links": [] }, "overrides": [] }, "fill": 0, "fillGradient": 1, "gridPos": { "h": 8, "w": 8, "x": 16, "y": 47 }, "hiddenSeries": false, "hideTimeOverride": false, "id": 16, "legend": { "alignAsTable": false, "avg": false, "current": true, "max": false, "min": false, "rightSide": false, "show": true, "total": false, "values": true }, "lines": true, "linewidth": 2, "links": [], "nullPointMode": "null", "options": { "alertThreshold": true }, "percentage": false, "pluginVersion": "7.5.4", "pointradius": 1, "points": false, "renderer": "flot", "seriesOverrides": [ { "alias": "switches", "color": "#FADE2A", "lines": false, "pointradius": 1, "points": true, "yaxis": 2 }, { "alias": "used filefd", "color": "#F2495C" } ], "spaceLength": 10, "stack": false, "steppedLine": false, "targets": [ { "expr": "node_filefd_allocated{instance=~\"$node\"}", "format": "time_series", "instant": false, "interval": "", "intervalFactor": 5, "legendFormat": "used filefd", "refId": "B" }, { "expr": "rate(node_context_switches_total{instance=~\"$node\"}[$interval])", "interval": "", "intervalFactor": 5, "legendFormat": "switches", "refId": "A" }, { "expr": " (node_filefd_allocated{instance=~\"$node\"}/node_filefd_maximum{instance=~\"$node\"}) *100", "format": "time_series", "hide": true, "instant": false, "interval": "", "intervalFactor": 5, "legendFormat": "使用的文件描述符占比_{{instance}}", "refId": "C" } ], "thresholds": [], "timeFrom": null, "timeRegions": [], "timeShift": null, "title": "Open File Descriptor(left)/Context switches(right)", "tooltip": { "shared": true, "sort": 2, "value_type": "individual" }, "type": "graph", "xaxis": { "buckets": null, "mode": "time", "name": null, "show": true, "values": [] }, "yaxes": [ { "format": "short", "label": "used filefd", "logBase": 1, "max": null, "min": null, "show": true }, { "format": "short", "label": "context_switches", "logBase": 1, "max": null, "min": null, "show": true } ], "yaxis": { "align": false, "alignLevel": null } } ], "refresh": false, "schemaVersion": 27, "style": "dark", "tags": [ "Prometheus", "node_exporter", "StarsL.cn" ], "templating": { "list": [ { "allValue": "", "current": { "isNone": true, "selected": false, "text": "None", "value": "" }, "datasource": "prometheus", "definition": "label_values(origin_prometheus)", "description": null, "error": null, "hide": 0, "includeAll": false, "label": "Origin_prom", "multi": false, "name": "origin_prometheus", "options": [], "query": { "query": "label_values(origin_prometheus)", "refId": "prometheus-origin_prometheus-Variable-Query" }, "refresh": 1, "regex": "", "skipUrlSync": false, "sort": 5, "tagValuesQuery": "", "tags": [], "tagsQuery": "", "type": "query", "useTags": false }, { "allValue": null, "current": { "selected": false, "text": "node-exporter", "value": "node-exporter" }, "datasource": "prometheus", "definition": "label_values(node_uname_info{origin_prometheus=~\"$origin_prometheus\"}, job)", "description": null, "error": null, "hide": 0, "includeAll": false, "label": "JOB", "multi": false, "name": "job", "options": [], "query": { "query": "label_values(node_uname_info{origin_prometheus=~\"$origin_prometheus\"}, job)", "refId": "prometheus-job-Variable-Query" }, "refresh": 1, "regex": "", "skipUrlSync": false, "sort": 5, "tagValuesQuery": "", "tags": [], "tagsQuery": "", "type": "query", "useTags": false }, { "allValue": null, "current": { "selected": false, "text": "All", "value": "$__all" }, "datasource": "prometheus", "definition": "label_values(node_uname_info{origin_prometheus=~\"$origin_prometheus\",job=~\"$job\"}, nodename)", "description": null, "error": null, "hide": 0, "includeAll": true, "label": "Host", "multi": false, "name": "hostname", "options": [], "query": { "query": "label_values(node_uname_info{origin_prometheus=~\"$origin_prometheus\",job=~\"$job\"}, nodename)", "refId": "prometheus-hostname-Variable-Query" }, "refresh": 1, "regex": "", "skipUrlSync": false, "sort": 5, "tagValuesQuery": "", "tags": [], "tagsQuery": "", "type": "query", "useTags": false }, { "allFormat": "glob", "allValue": null, "current": { "selected": false, "text": "k8s-ceph-01", "value": "k8s-ceph-01" }, "datasource": "prometheus", "definition": "label_values(node_uname_info{origin_prometheus=~\"$origin_prometheus\",job=~\"$job\",nodename=~\"$hostname\"},instance)", "description": null, "error": null, "hide": 0, "includeAll": false, "label": "Instance", "multi": true, "multiFormat": "regex values", "name": "node", "options": [], "query": { "query": "label_values(node_uname_info{origin_prometheus=~\"$origin_prometheus\",job=~\"$job\",nodename=~\"$hostname\"},instance)", "refId": "prometheus-node-Variable-Query" }, "refresh": 1, "regex": "", "skipUrlSync": false, "sort": 5, "tagValuesQuery": "", "tags": [], "tagsQuery": "", "type": "query", "useTags": false }, { "allFormat": "glob", "allValue": null, "current": { "selected": true, "text": [ "All" ], "value": [ "$__all" ] }, "datasource": "prometheus", "definition": "label_values(node_network_info{origin_prometheus=~\"$origin_prometheus\",device!~'tap.*|veth.*|br.*|docker.*|virbr.*|lo.*|cni.*'},device)", "description": null, "error": null, "hide": 0, "includeAll": true, "label": "NIC", "multi": true, "multiFormat": "regex values", "name": "device", "options": [], "query": { "query": "label_values(node_network_info{origin_prometheus=~\"$origin_prometheus\",device!~'tap.*|veth.*|br.*|docker.*|virbr.*|lo.*|cni.*'},device)", "refId": "prometheus-device-Variable-Query" }, "refresh": 1, "regex": "", "skipUrlSync": false, "sort": 1, "tagValuesQuery": "", "tags": [], "tagsQuery": "", "type": "query", "useTags": false }, { "auto": false, "auto_count": 100, "auto_min": "10s", "current": { "selected": false, "text": "2m", "value": "2m" }, "description": null, "error": null, "hide": 0, "label": "Interval", "name": "interval", "options": [ { "selected": false, "text": "30s", "value": "30s" }, { "selected": false, "text": "1m", "value": "1m" }, { "selected": true, "text": "2m", "value": "2m" }, { "selected": false, "text": "3m", "value": "3m" }, { "selected": false, "text": "5m", "value": "5m" }, { "selected": false, "text": "10m", "value": "10m" }, { "selected": false, "text": "30m", "value": "30m" } ], "query": "30s,1m,2m,3m,5m,10m,30m", "queryValue": "", "refresh": 2, "skipUrlSync": false, "type": "interval" }, { "allValue": null, "current": { "selected": false, "text": "/", "value": "/" }, "datasource": "prometheus", "definition": "query_result(topk(1,sort_desc (max(node_filesystem_size_bytes{origin_prometheus=~\"$origin_prometheus\",instance=~'$node',fstype=~\"ext.?|xfs\",mountpoint!~\".*pods.*\"}) by (mountpoint))))", "description": null, "error": null, "hide": 2, "includeAll": false, "label": "maxmount", "multi": false, "name": "maxmount", "options": [], "query": { "query": "query_result(topk(1,sort_desc (max(node_filesystem_size_bytes{origin_prometheus=~\"$origin_prometheus\",instance=~'$node',fstype=~\"ext.?|xfs\",mountpoint!~\".*pods.*\"}) by (mountpoint))))", "refId": "prometheus-maxmount-Variable-Query" }, "refresh": 2, "regex": "/.*\\\"(.*)\\\".*/", "skipUrlSync": false, "sort": 5, "tagValuesQuery": "", "tags": [], "tagsQuery": "", "type": "query", "useTags": false }, { "allValue": null, "current": { "selected": false, "text": "k8s-ceph-01", "value": "k8s-ceph-01" }, "datasource": "prometheus", "definition": "label_values(node_uname_info{origin_prometheus=~\"$origin_prometheus\",job=~\"$job\",instance=~\"$node\"}, nodename)", "description": null, "error": null, "hide": 2, "includeAll": false, "label": "show_hostname", "multi": false, "name": "show_hostname", "options": [], "query": { "query": "label_values(node_uname_info{origin_prometheus=~\"$origin_prometheus\",job=~\"$job\",instance=~\"$node\"}, nodename)", "refId": "prometheus-show_hostname-Variable-Query" }, "refresh": 1, "regex": "", "skipUrlSync": false, "sort": 5, "tagValuesQuery": "", "tags": [], "tagsQuery": "", "type": "query", "useTags": false }, { "allValue": null, "current": { "selected": false, "text": "9", "value": "9" }, "datasource": "prometheus", "definition": "query_result(count(node_uname_info{origin_prometheus=~\"$origin_prometheus\",job=~\"$job\"}))", "description": null, "error": null, "hide": 2, "includeAll": false, "label": "total_servers", "multi": false, "name": "total", "options": [], "query": { "query": "query_result(count(node_uname_info{origin_prometheus=~\"$origin_prometheus\",job=~\"$job\"}))", "refId": "prometheus-total-Variable-Query" }, "refresh": 1, "regex": "/{} (.*) .*/", "skipUrlSync": false, "sort": 0, "tagValuesQuery": "", "tags": [], "tagsQuery": "", "type": "query", "useTags": false } ] }, "time": { "from": "now-1h", "to": "now" }, "timepicker": { "hidden": false, "now": true, "refresh_intervals": [ "15s", "30s", "1m", "5m", "15m", "30m" ], "time_options": [ "5m", "15m", "1h", "6h", "12h", "24h", "2d", "7d", "30d" ] }, "timezone": "Asia/Shanghai", "title": "monitoring-node", "uid": "xfpJB9FGzx", "version": 3 }
效果图
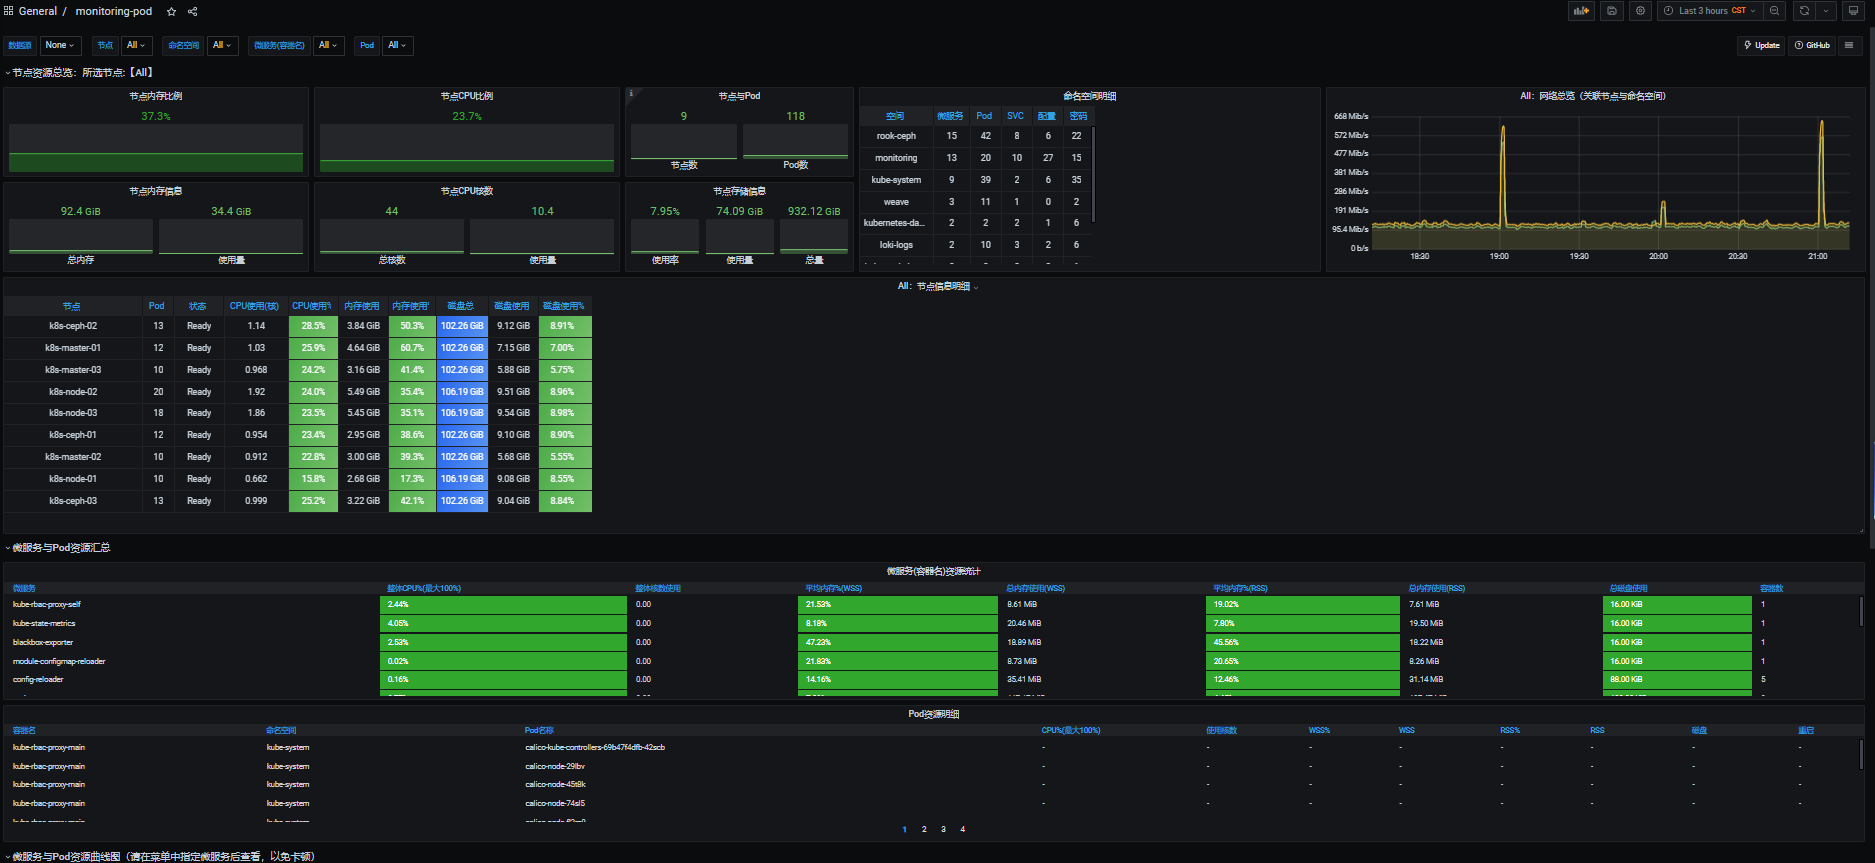
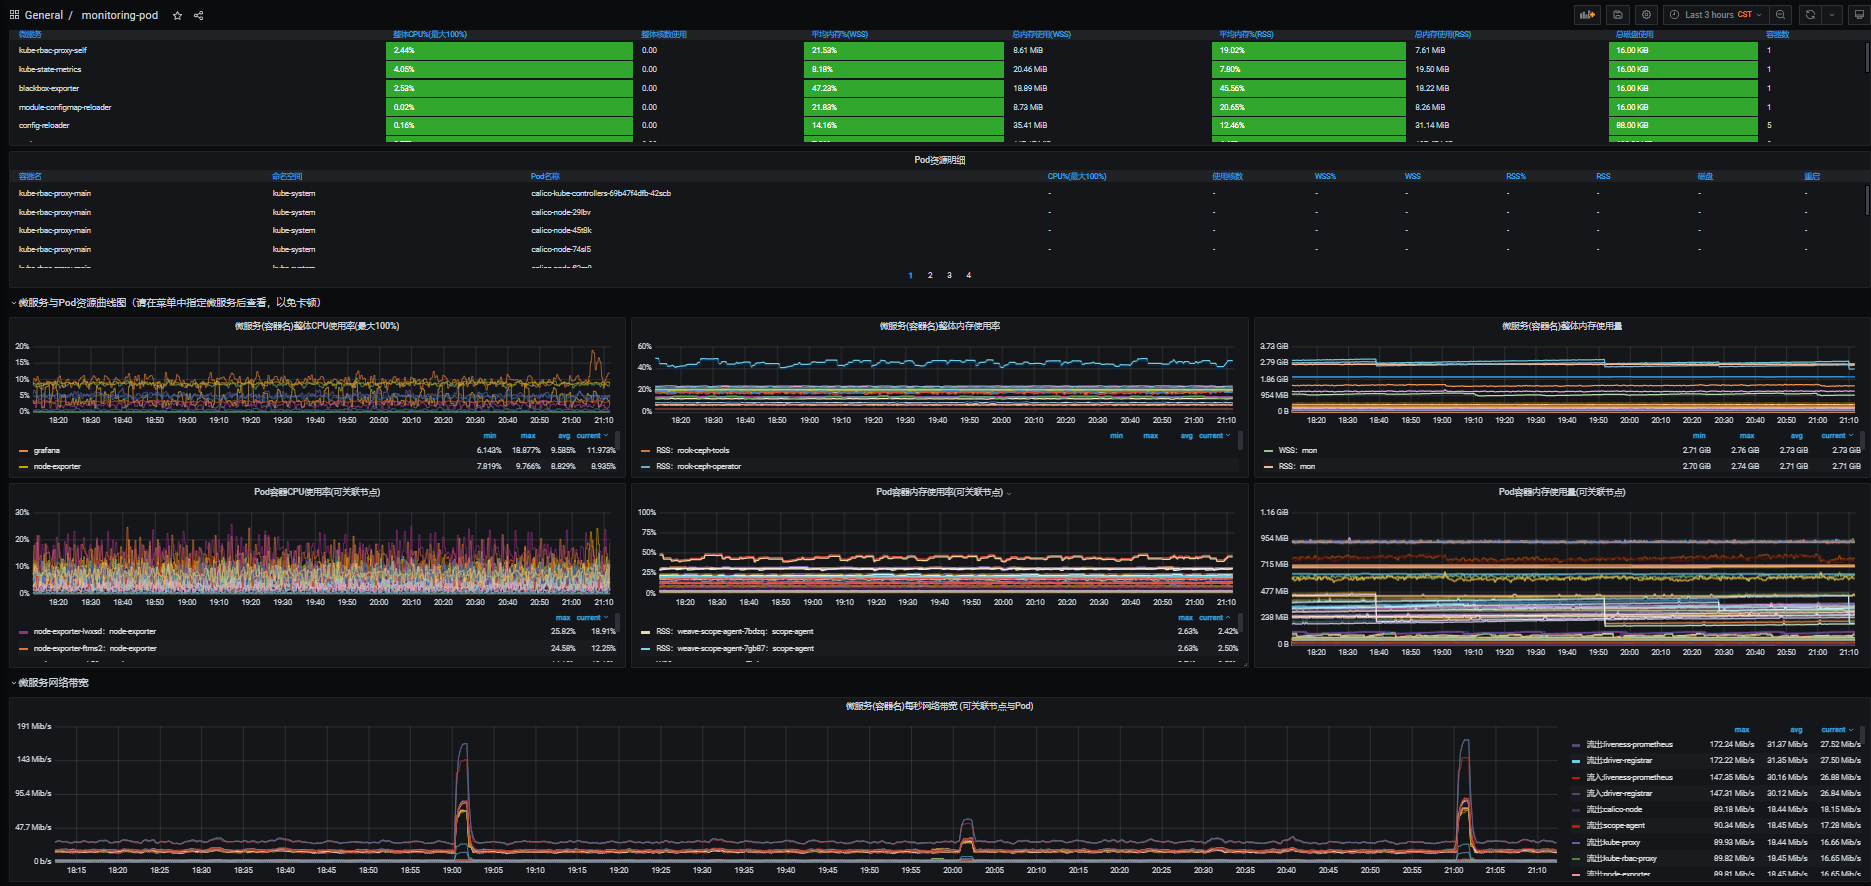
此刻kube-prometheues部署完成!!!
四、安装loki轻量级日志搜集系统
4.1、下载并安装helm安装包
wget https://get.helm.sh/helm-v3.2.4-linux-amd64.tar.gz
tar -xvzf helm-v3.2.4-linux-amd64.tar.gz
mv helm /usr/local/bin/
[root@k8s-master-01 ~]# helm version
version.BuildInfo{Version:"v3.2.4", GitCommit:"0ad800ef43d3b826f31a5ad8dfbb4fe05d143688", GitTreeState:"clean", GoVersion:"go1.13.12"}
[root@k8s-master-01 ~]#
4.2、添加granfana-loki helm repo源
helm repo add grafana https://grafana.github.io/helm-charts
helm repo update #更新同步grafana源到本地
helm search repo #查看有哪些可用源
[root@k8s-master-01 ~]# helm search repo
NAME                                    CHART VERSION    APP VERSION    DESCRIPTION
grafana/enterprise-logs                 2.2.2            v1.4.1         Grafana Enterprise Logs
grafana/enterprise-logs-simple          1.2.0            v1.4.0         DEPRECATED Grafana Enterprise Logs (Simple Scal...
grafana/enterprise-metrics              1.9.0            v1.7.0         DEPRECATED Grafana Enterprise Metrics
grafana/fluent-bit                      2.3.1            v2.1.0         Uses fluent-bit Loki go plugin for gathering lo...
grafana/grafana                         6.32.2           9.0.2          The leading tool for querying and visualizing t...
grafana/grafana-agent-operator          0.2.3            0.25.1         A Helm chart for Grafana Agent Operator
grafana/loki                            2.13.1           v2.6.0         Loki: like Prometheus, but for logs.
grafana/loki-canary                     0.9.1            2.6.0          Helm chart for Grafana Loki Canary
grafana/loki-distributed                0.53.1           2.6.0          Helm chart for Grafana Loki in microservices mode
grafana/loki-simple-scalable            1.7.5            2.6.0          Helm chart for Grafana Loki in simple, scalable...
grafana/loki-stack                      2.6.5            v2.4.2         Loki: like Prometheus, but for logs.
grafana/mimir-distributed               2.1.0            2.1.0          Grafana Mimir
grafana/mimir-openshift-experimental    2.1.0            2.0.0          Grafana Mimir on OpenShift Experiment
grafana/oncall                          1.0.2            v1.0.3         Developer-friendly incident response with brill...
grafana/promtail                        6.2.1            2.6.0          Promtail is an agent which ships the contents o...
grafana/rollout-operator                0.1.2            v0.1.1         Grafana rollout-operator
grafana/tempo                           0.15.6           1.4.1          Grafana Tempo Single Binary Mode
grafana/tempo-distributed               0.21.6           1.4.1          Grafana Tempo in MicroService mode
grafana/tempo-vulture                   0.2.0            1.3.0          Grafana Tempo Vulture - A tool to monitor Tempo...
[root@k8s-master-01 ~]#
4.3、安装granfana-loki
创建namespace
kubectl create ns loki-logs
helm upgrade --install grafana-loki grafana/loki-stack --namespace loki-logs
[root@k8s-master-01 ~]# helm ls -A
NAME            NAMESPACE    REVISION    UPDATED                                    STATUS      CHART               APP VERSION
grafana-loki    loki-logs    1           2022-07-17 14:15:50.585807899 +0800 CST    deployed    loki-stack-2.6.5    v2.4.2
[root@k8s-master-01 ~]# kubectl get pod -n loki-logs
NAME                          READY   STATUS    RESTARTS   AGE
grafana-loki-0                1/1     Running   0          3d7h
grafana-loki-promtail-4c9n2   1/1     Running   0          3d8h
grafana-loki-promtail-5jfx6   1/1     Running   0          3d8h
grafana-loki-promtail-bvfql   1/1     Running   0          3d8h
grafana-loki-promtail-dvcvq   1/1     Running   0          3d8h
grafana-loki-promtail-kgwvs   1/1     Running   0          3d8h
grafana-loki-promtail-pl986   1/1     Running   0          3d8h
grafana-loki-promtail-sgl8p   1/1     Running   0          3d8h
grafana-loki-promtail-xnqbz   1/1     Running   0          3d8h
grafana-loki-promtail-zj86c   1/1     Running   0          3d8h
[root@k8s-master-01 ~]#
4.4、创建grafana-loki pvc
[root@k8s-master-01 loki]# cat loki-strorage.yaml
---
apiVersion: v1
kind: PersistentVolumeClaim
metadata:
  name: loki
  namespace: loki-logs
spec:
  accessModes:
    - ReadWriteOnce
  resources:
    requests:
      storage: 200Gi
  storageClassName: hdd-rook-ceph-block
[root@k8s-master-01 loki]#

[root@k8s-master-01 loki]# kubectl create -f loki-strorage.yaml
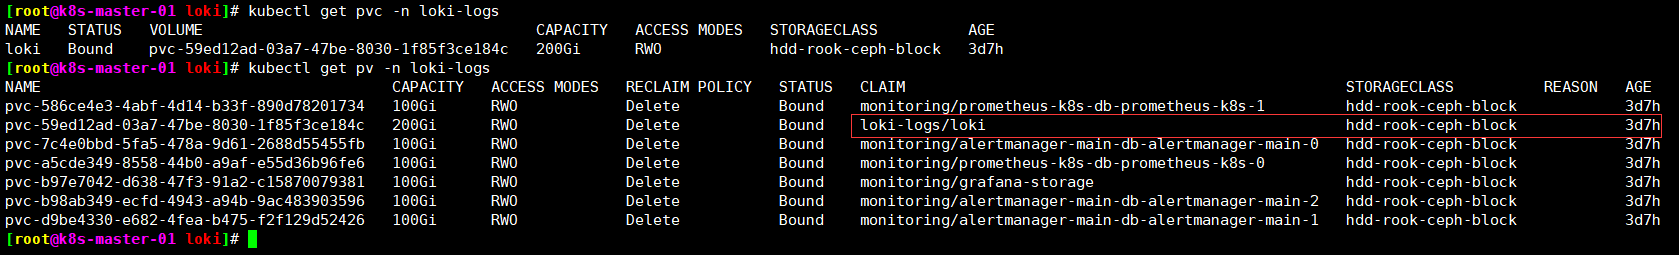
4.5、修改loki emptDir并指定存储
将我们上面的statefulset/loki保存为yaml文件。
# kubectl get statefulset loki -n monitoring -o yaml >> loki-sf.yaml
vi loki-sf.yaml
......................................
      volumes:
      - emptyDir: {}
        name: tmp
      - name: config
        secret:
          defaultMode: 420
          secretName: grafana-loki
      #- emptyDir: {} #注释此行,新增以下两行
      - name: storage   #新增行
        persistentVolumeClaim:   #新增行
         claimName: loki #新增行
  updateStrategy:
    type: RollingUpdate
.................................................
# kubectl apply -f loki-sf.yaml
如果出现报:MountVolume.NewMounter initialization failed for volume "pvc-909c9faf-234f-43c4-b511-4024283ddd0c" : couldn't get secret loki/ceph-secret-k8s err: secrets "ceph-secret-k8s" not found
解决办法:在loki命名空间下创建可连接ceph secret
[root@easzlab-deploy loki-logs]# cat case3-secret-client-k8s.yaml
apiVersion: v1
kind: Secret
metadata:
  name: ceph-secret-k8s
  namespace: loki
type: "kubernetes.io/rbd"
data:
  key: QVFDZjFmNWpVUitsTUJBQWN6bDZHRmE3VGY4VEkydENVTDNPYnc9PQ==
[root@easzlab-deploy loki-logs]#
[root@easzlab-deploy loki-logs]# kubectl apply -f case3-secret-client-k8s.yaml
secret/ceph-secret-k8s created
[root@easzlab-deploy loki-logs]#
[root@easzlab-deploy loki-logs]# kubectl get secret -n loki
NAME                                 TYPE                 DATA   AGE
ceph-secret-k8s                      kubernetes.io/rbd    1      10m  #新增
grafana-loki                         Opaque               1      43m
grafana-loki-promtail                Opaque               1      43m
sh.helm.release.v1.grafana-loki.v1   helm.sh/release.v1   1      43m
[root@easzlab-deploy loki-logs]#
验证是否挂载成功
kubectl exec [POD] [COMMAND] is DEPRECATED and will be removed in a future version. Use kubectl exec [POD] -- [COMMAND] instead.
/ $ df -h
Filesystem                Size      Used Available Use% Mounted on
overlay                   1.0T     41.2G    948.5G   4% /
tmpfs                    64.0M         0     64.0M   0% /dev
tmpfs                     7.8G         0      7.8G   0% /sys/fs/cgroup
/dev/mapper/ubuntu--vg-ubuntu--lv
                          1.0T     41.2G    948.5G   4% /tmp
/dev/rbd1               491.1G      3.4M    491.1G   0% /data  #已挂载成功
tmpfs                    15.3G      4.0K     15.3G   0% /etc/loki
/dev/mapper/ubuntu--vg-ubuntu--lv
                          1.0T     41.2G    948.5G   4% /etc/hosts
/dev/mapper/ubuntu--vg-ubuntu--lv
                          1.0T     41.2G    948.5G   4% /dev/termination-log
/dev/mapper/ubuntu--vg-ubuntu--lv
                          1.0T     41.2G    948.5G   4% /etc/hostname
/dev/mapper/ubuntu--vg-ubuntu--lv
                          1.0T     41.2G    948.5G   4% /etc/resolv.conf
shm                      64.0M         0     64.0M   0% /dev/shm
tmpfs                    15.3G     12.0K     15.3G   0% /run/secrets/kubernetes.io/serviceaccount
tmpfs                     7.8G         0      7.8G   0% /proc/acpi
tmpfs                    64.0M         0     64.0M   0% /proc/kcore
tmpfs                    64.0M         0     64.0M   0% /proc/keys
tmpfs                    64.0M         0     64.0M   0% /proc/timer_list
tmpfs                    64.0M         0     64.0M   0% /proc/sched_debug
tmpfs                     7.8G         0      7.8G   0% /proc/scsi
tmpfs                     7.8G         0      7.8G   0% /sys/firmware
/ $~ $ ls -lrth /data/
total 20K
drwxrws---    2 root     loki       16.0K Sep 27 06:25 lost+found
drwxr-sr-x    7 loki     loki        4.0K Sep 27 06:25 loki
/ $ ls -lrth /data/loki/
total 20K
drwxr-sr-x    2 loki     loki        4.0K Sep 27 06:25 boltdb-shipper-compactor
drwxr-sr-x    2 loki     loki        4.0K Sep 27 06:25 boltdb-shipper-cache
drwxr-sr-x    4 loki     loki        4.0K Sep 27 06:30 boltdb-shipper-active
drwxr-sr-x    4 loki     loki        4.0K Sep 27 06:40 wal
drwxr-sr-x    2 loki     loki        4.0K Sep 27 06:42 chunks
/ $
4.6、添加grafana日志面板id
https://grafana.com/grafana/dashboards/15324 15324
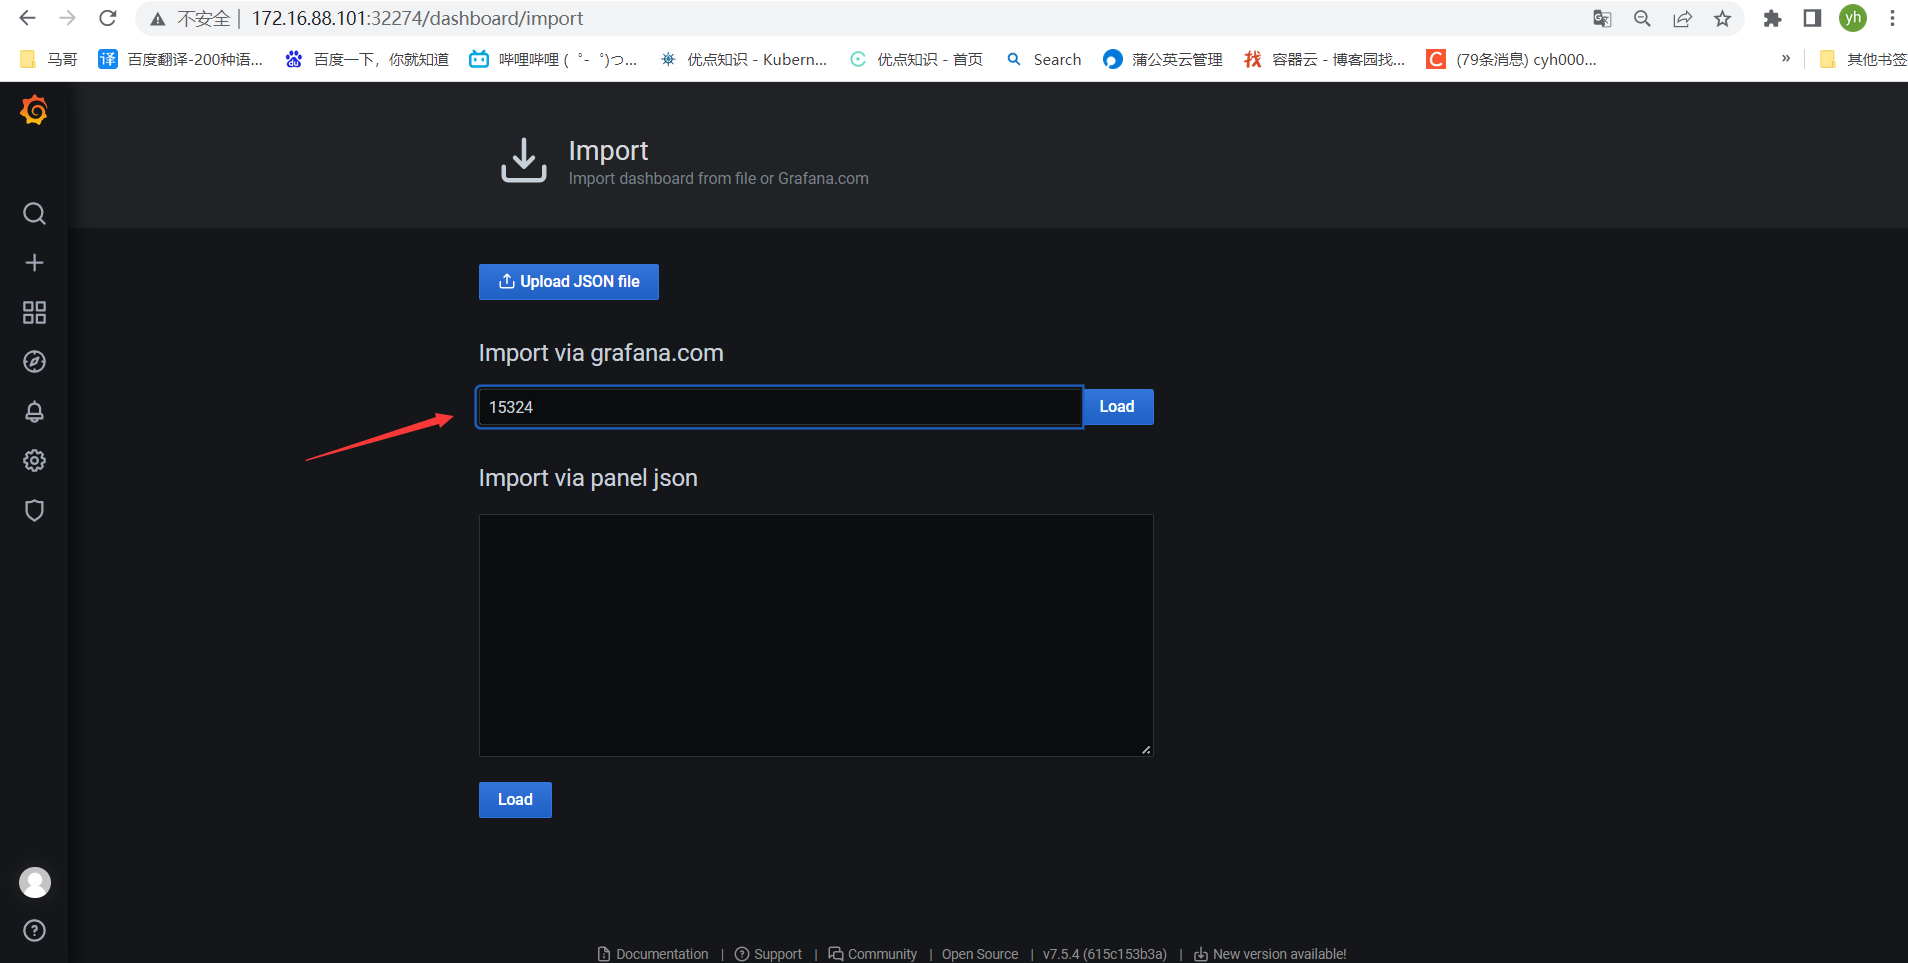
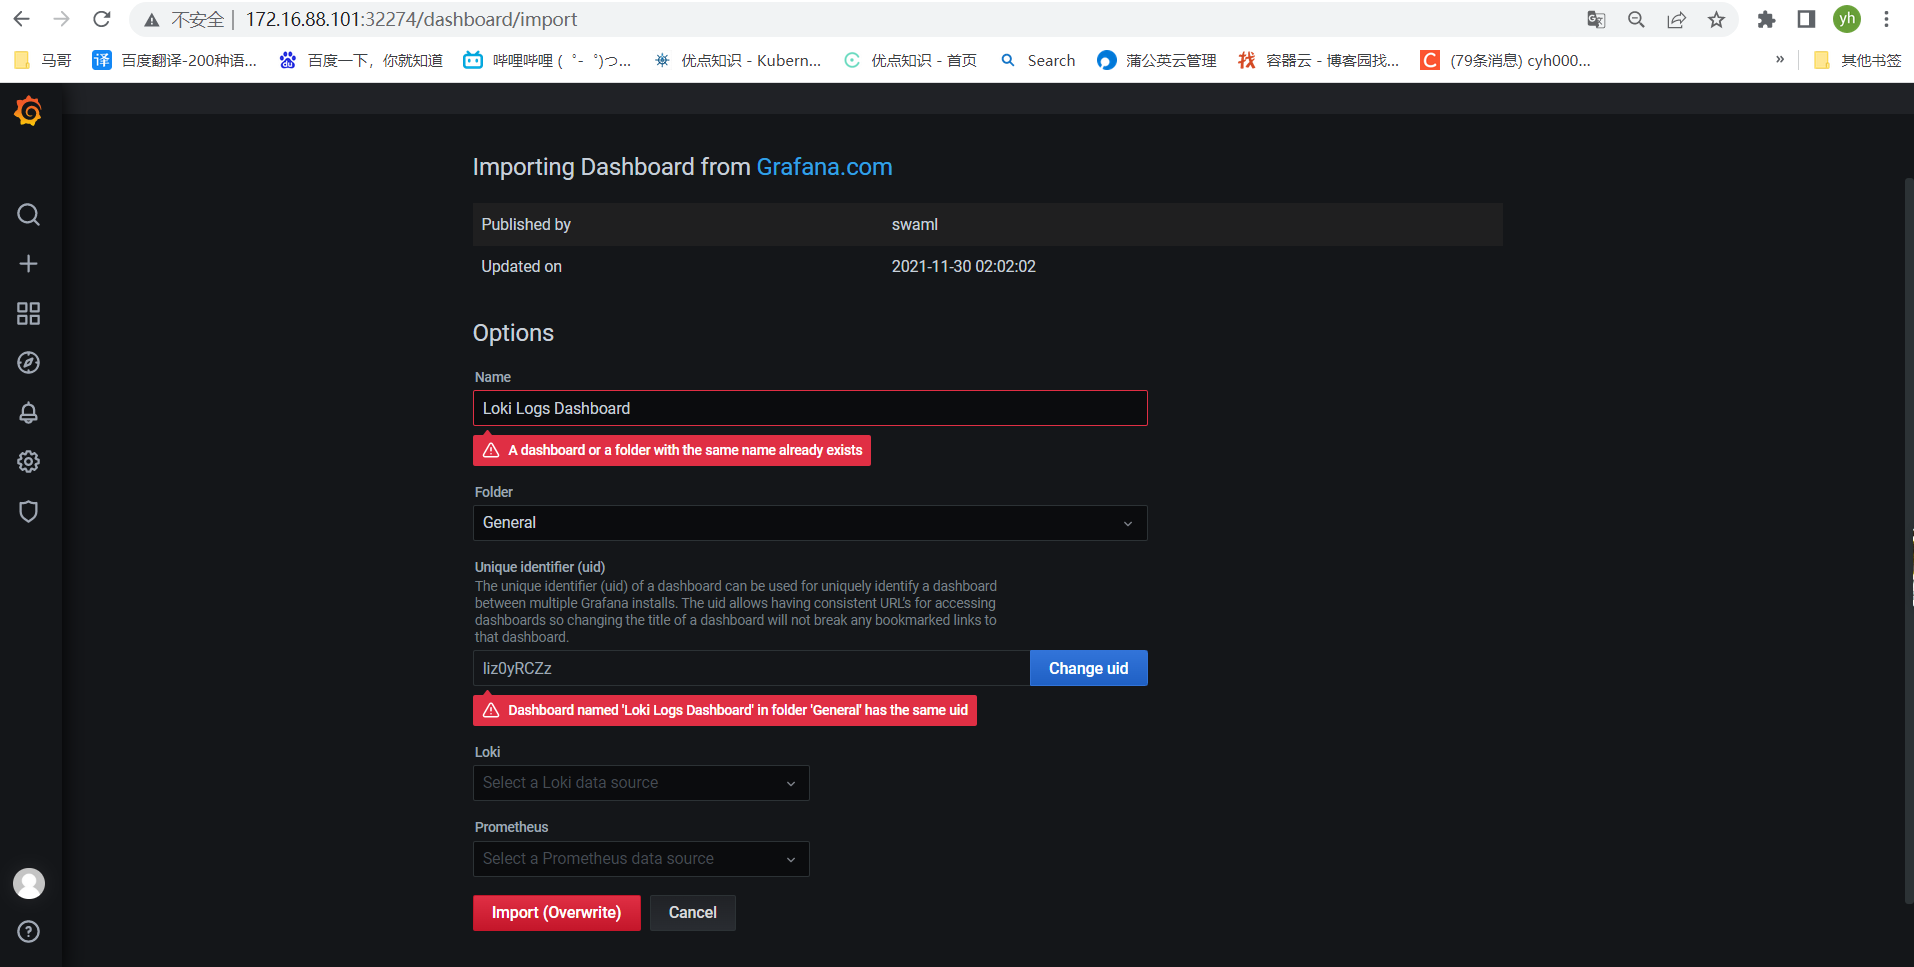
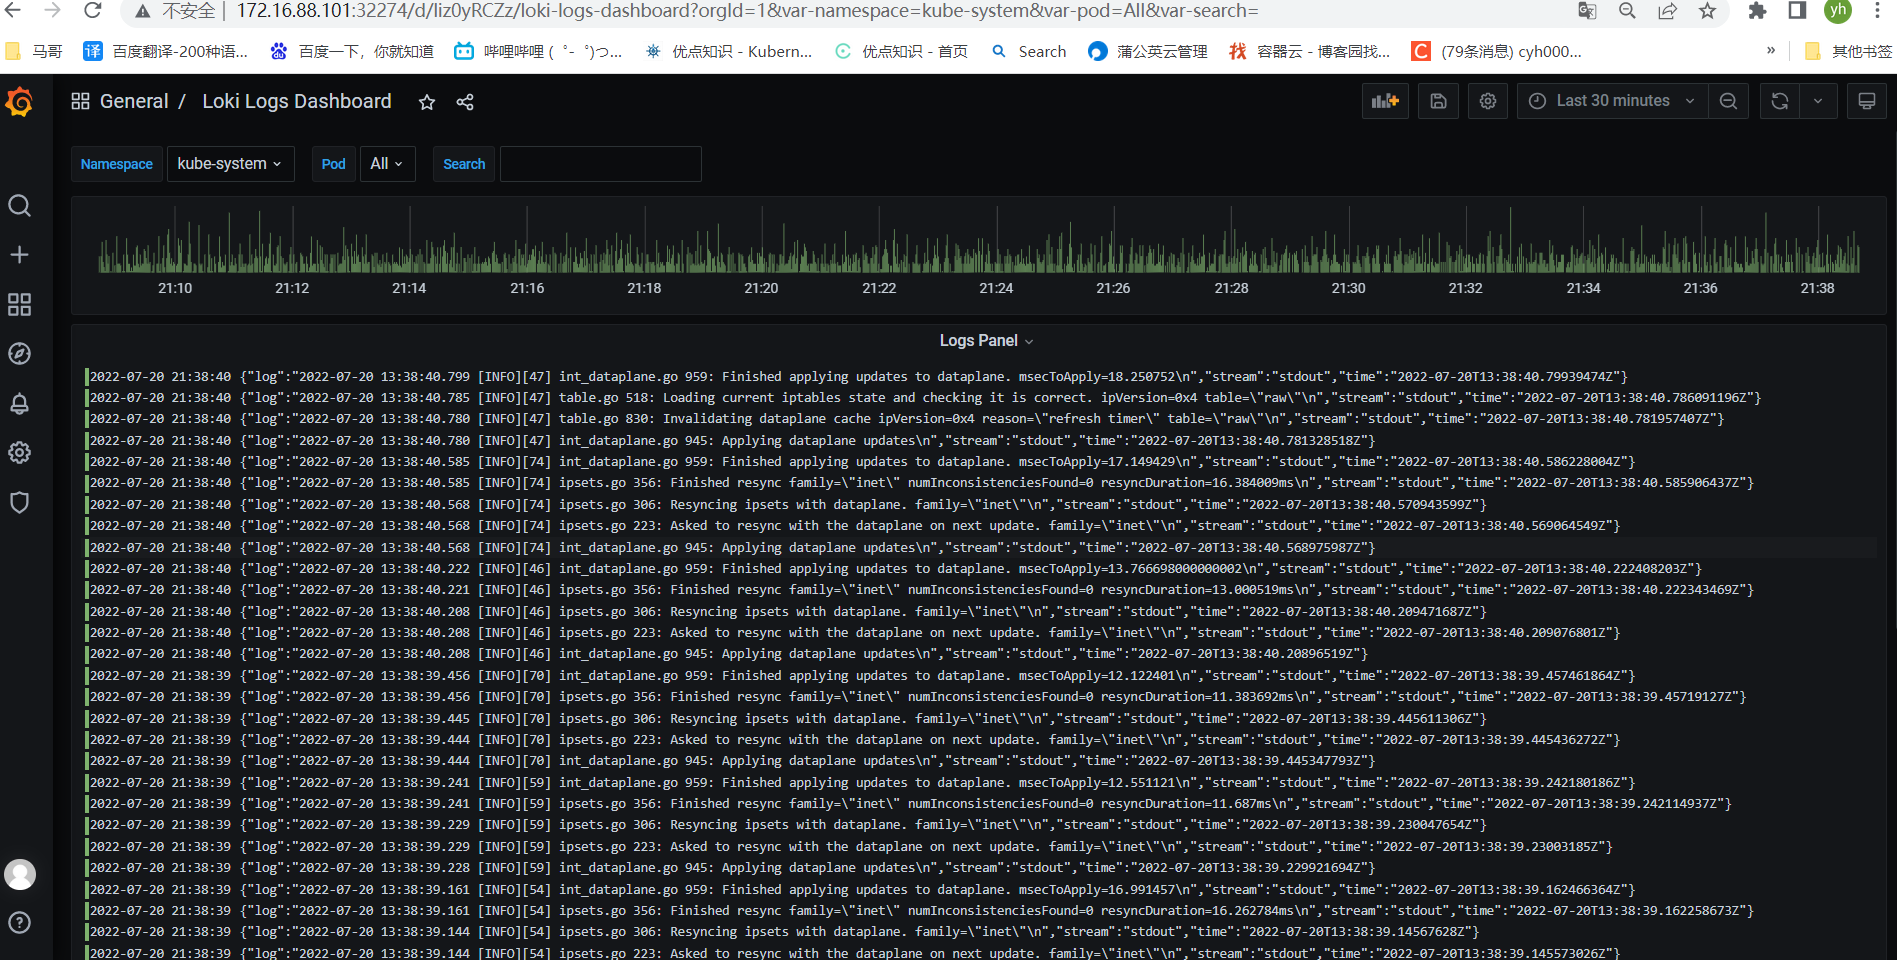
五、安装k8s dashbroad
wget https://raw.githubusercontent.com/kubernetes/dashboard/v2.6.0/aio/deploy/recommended.yaml
sed -i 's@kubernetesui@registry.aliyuncs.com/google_containers@g' recommended.yaml #修改镜像地址
sed -i '/targetPort: 8443/a\ \ \ \ \ \ nodePort: 30001\n\ \ type: NodePort' recommended.yaml #配置NodePort,外部通过https://NodeIp:NodePort 访问Dashboard,此时端口为30001
5.1、新增管理员帐号
cat >> recommended.yaml << EOF
---
# ------------------- dashboard-admin ------------------- #
apiVersion: v1
kind: ServiceAccount
metadata:
name: dashboard-admin
namespace: kubernetes-dashboard
---
apiVersion: rbac.authorization.k8s.io/v1
kind: ClusterRoleBinding
metadata:
name: dashboard-admin
subjects:
- kind: ServiceAccount
name: dashboard-admin
namespace: kubernetes-dashboard
roleRef:
apiGroup: rbac.authorization.k8s.io
kind: ClusterRole
name: cluster-admin
EOF
[root@k8s-master-01 ~]# kubectl apply -f recommended.yaml
[root@k8s-master-01 ~]# kubectl get pod -n kubernetes-dashboard
NAME                                         READY   STATUS    RESTARTS   AGE
dashboard-metrics-scraper-66dd8bdd86-dp5vg   1/1     Running   0          3d10h
kubernetes-dashboard-5c4b99db7-9vnqr         1/1     Running   0          3d10h
[root@k8s-master-01 ~]#
5.2、token获取
# kubectl describe secrets -n kubernetes-dashboard dashboard-admin
[root@k8s-master-01 ~]# kubectl describe secrets -n kubernetes-dashboard dashboard-admin
Name:         dashboard-admin-token-4zxcp
Namespace:    kubernetes-dashboard
Labels:       <none>
Annotations:  kubernetes.io/service-account.name: dashboard-admin
              kubernetes.io/service-account.uid: c30af115-afc5-4f7e-be36-cc5ffdea4b19

Type:  kubernetes.io/service-account-token

Data
====
ca.crt:     1070 bytes
namespace:  20 bytes
token:      eyJhbGciOiJSUzI1NiIsImtpZCI6IkxWUE95YzBaczJQTVJFR3ZFbm5GSnppbUl0RFg3dUtVOURNN1Rxekxqc1EifQ.eyJpc3MiOiJrdWJlcm5ldGVzL3NlcnZpY2VhY2NvdW50Iiwia3ViZXJuZXRlcy5pby9zZXJ2aWNlYWNjb3VudC9uYW1lc3BhY2UiOiJrdWJlcm5ldGVzLWRhc2hib2FyZCIsImt1YmVybmV0ZXMuaW8vc2VydmljZWFjY291bnQvc2VjcmV0Lm5hbWUiOiJkYXNoYm9hcmQtYWRtaW4tdG9rZW4tNHp4Y3AiLCJrdWJlcm5ldGVzLmlvL3NlcnZpY2VhY2NvdW50L3NlcnZpY2UtYWNjb3VudC5uYW1lIjoiZGFzaGJvYXJkLWFkbWluIiwia3ViZXJuZXRlcy5pby9zZXJ2aWNlYWNjb3VudC9zZXJ2aWNlLWFjY291bnQudWlkIjoiYzMwYWYxMTUtYWZjNS00ZjdlLWJlMzYtY2M1ZmZkZWE0YjE5Iiwic3ViIjoic3lzdGVtOnNlcnZpY2VhY2NvdW50Omt1YmVybmV0ZXMtZGFzaGJvYXJkOmRhc2hib2FyZC1hZG1pbiJ9.unMx48sJS5XEDAggCHuGCDstJt8qVAUI_8UCDxeAwjMFoG_GJJlIW9neo8yY2pWJXKZqtHdcxx3dosSPigLPUNuPF8x4ltPjMoGFFR7v12DEgWIHBuq74NKcqLj59IeZFb6P5gNisMiyZiUFXJbAjRP6nSThqHpIIfeZh8ywnNbD4vnQ6AD3i_G76ThxzbuaYKtnSCpIuJfIJrRmpJxWnvVgEIoUx0KO_yOHLQnKGJ1JhLXNZvdaL9YQkIJltnOkF9M1TTDcZa-GnIJB6QfMbopfLBtWZNp7HKE0XjERNwQJ7DBXKDSo6ixWBmJ1DhLeV7OlCpjv5wHnZdBukdQu7w

[root@k8s-master-01 ~]#
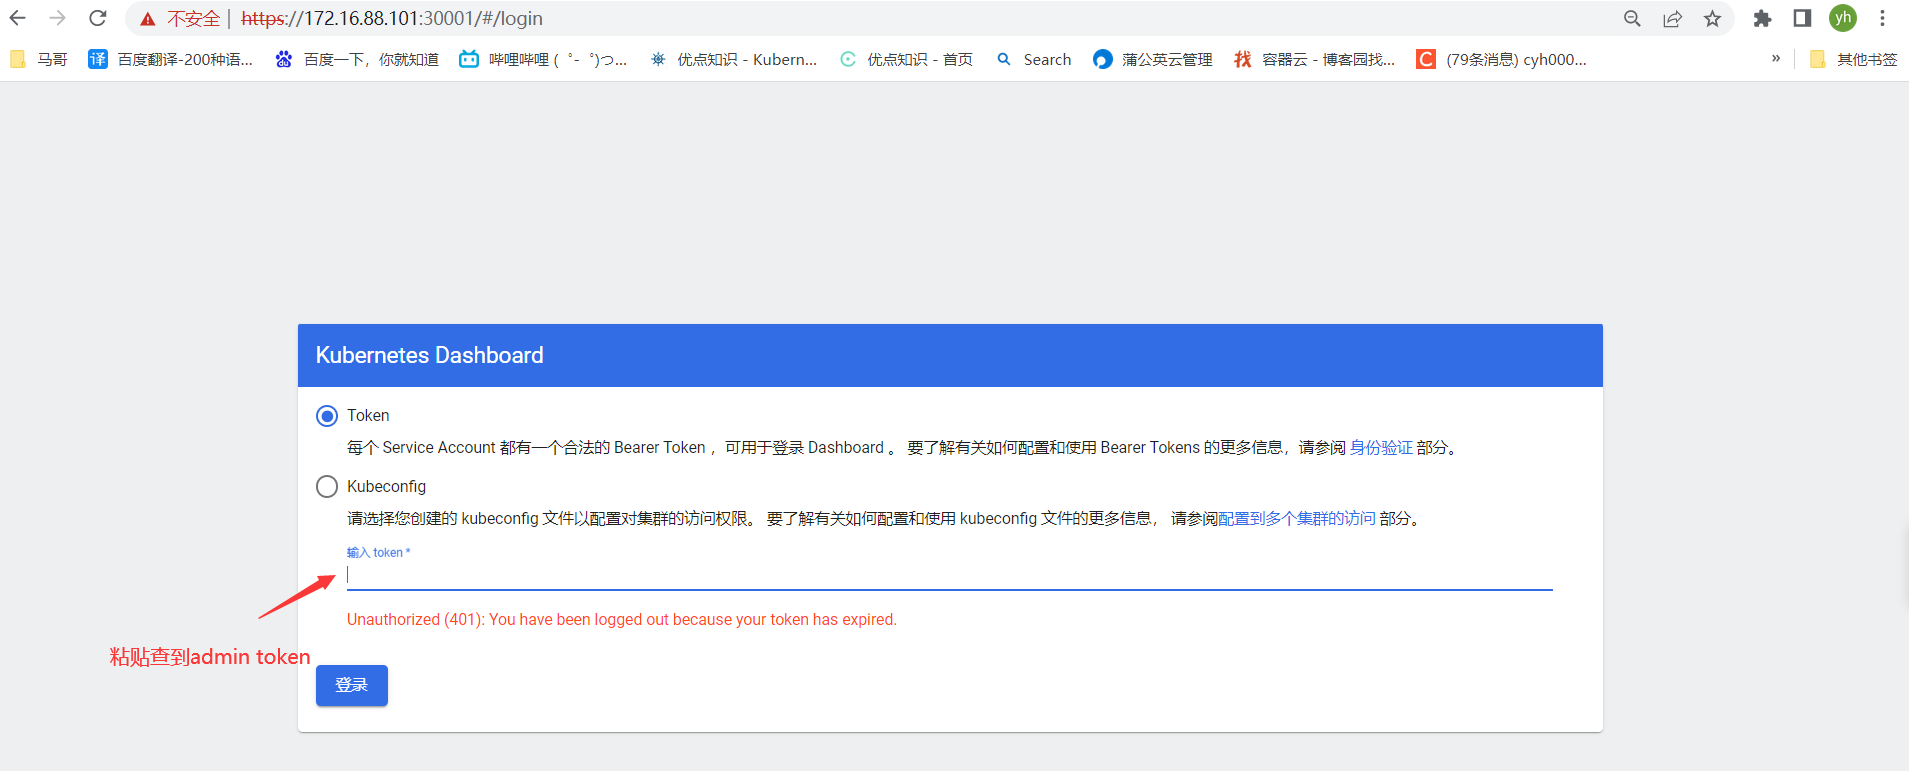
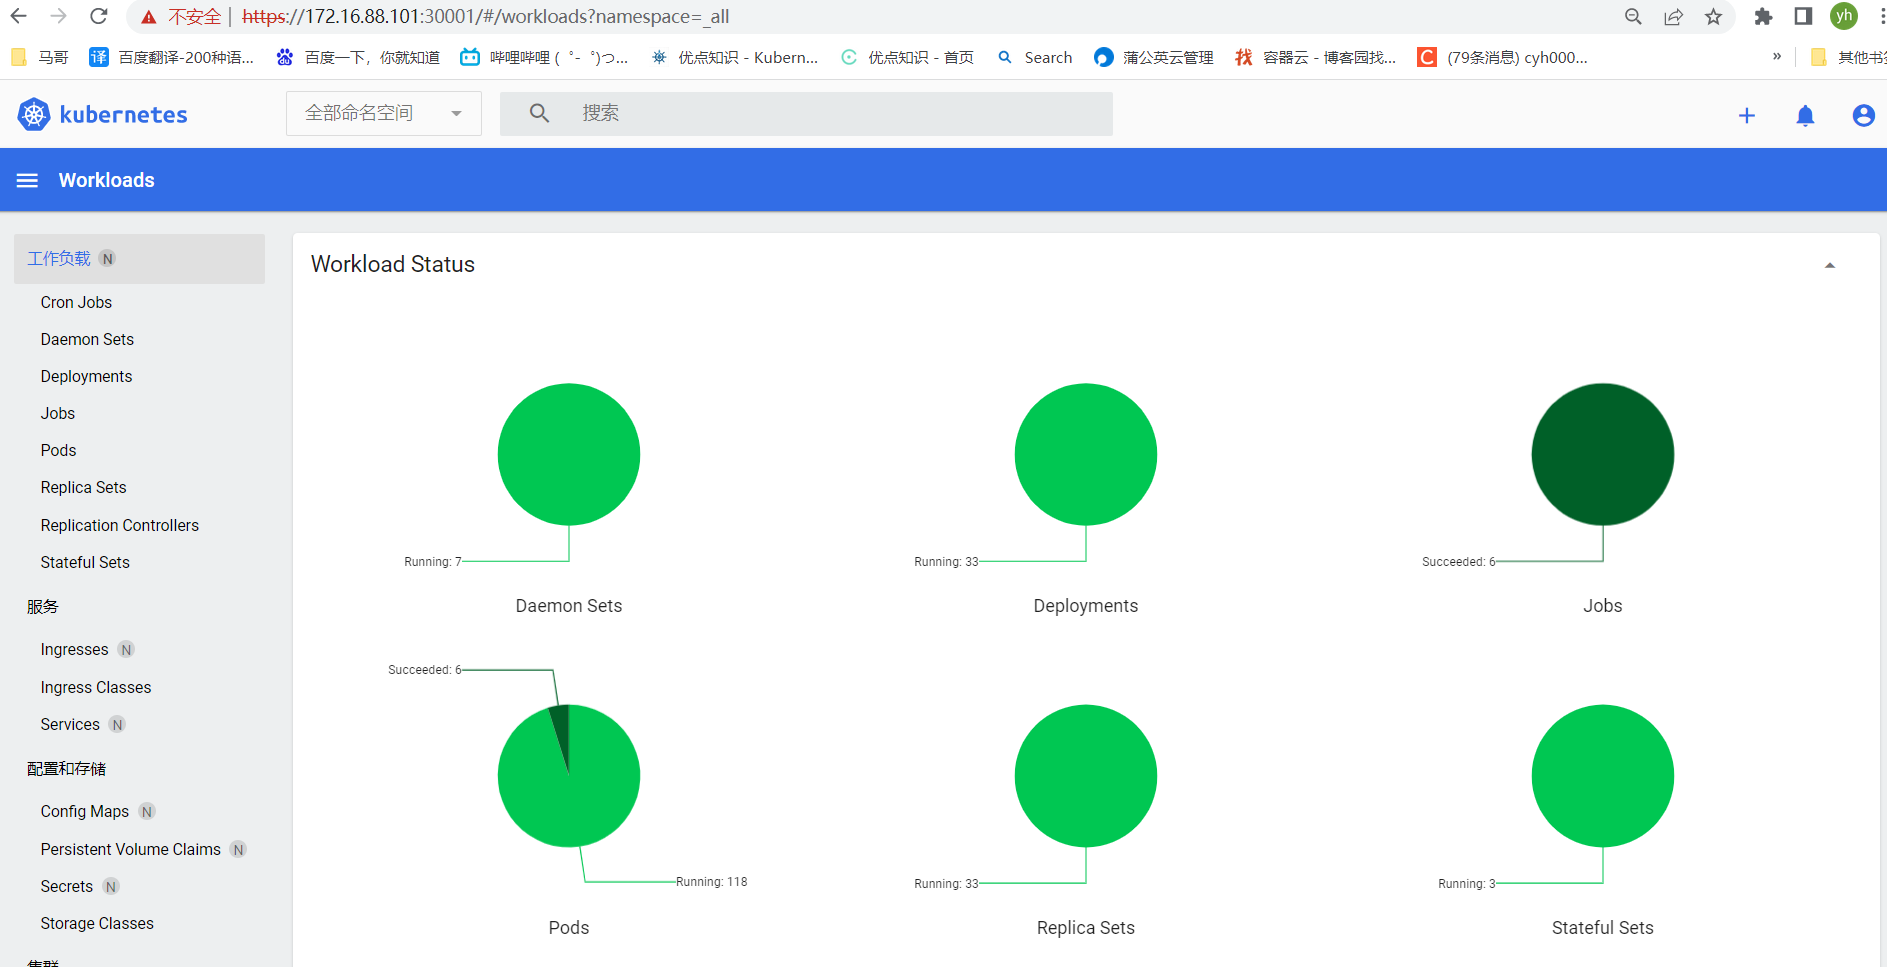
六、安装weave网络监控工具
# kubectl apply -f "https://cloud.weave.works/k8s/scope.yaml?k8s-version=$(kubectl version | base64 | tr -d '\n')&k8s-service-type=NodePort"
[root@k8s-master-01 ~]# kubectl get pod -n weave
NAME                                         READY   STATUS    RESTARTS   AGE
weave-scope-agent-2wl2t                      1/1     Running   0          22h
weave-scope-agent-7bdzq                      1/1     Running   0          22h
weave-scope-agent-7gb87                      1/1     Running   0          22h
weave-scope-agent-blgtb                      1/1     Running   0          22h
weave-scope-agent-bllck                      1/1     Running   0          22h
weave-scope-agent-dhz7m                      1/1     Running   0          22h
weave-scope-agent-npg74                      1/1     Running   0          22h
weave-scope-agent-spgnf                      1/1     Running   0          22h
weave-scope-agent-wfrrv                      1/1     Running   0          22h
weave-scope-app-588b789d4-fxsl7              1/1     Running   0          22h
weave-scope-cluster-agent-5d7745c9c9-xxcdd   1/1     Running   0          22h
[root@k8s-master-01 ~]#
[root@k8s-master-01 ~]# kubectl get node -owide NAME STATUS ROLES AGE VERSION INTERNAL-IP EXTERNAL-IP OS-IMAGE KERNEL-VERSION CONTAINER-RUNTIME k8s-ceph-01 Ready <none> 3d20h v1.19.8 172.16.88.107 <none> CentOS Linux 7 (Core) 3.10.0-1160.el7.x86_64 docker://19.3.12 k8s-ceph-02 Ready <none> 3d20h v1.19.8 172.16.88.108 <none> CentOS Linux 7 (Core) 3.10.0-1160.el7.x86_64 docker://19.3.12 k8s-ceph-03 Ready <none> 3d20h v1.19.8 172.16.88.109 <none> CentOS Linux 7 (Core) 3.10.0-1160.el7.x86_64 docker://19.3.12 k8s-master-01 Ready master 3d20h v1.19.8 172.16.88.101 <none> CentOS Linux 7 (Core) 3.10.0-1160.el7.x86_64 docker://19.3.12 k8s-master-02 Ready master 3d20h v1.19.8 172.16.88.102 <none> CentOS Linux 7 (Core) 3.10.0-1160.el7.x86_64 docker://19.3.12 k8s-master-03 Ready master 3d20h v1.19.8 172.16.88.103 <none> CentOS Linux 7 (Core) 3.10.0-1160.el7.x86_64 docker://19.3.12 k8s-node-01 Ready <none> 3d20h v1.19.8 172.16.88.104 <none> CentOS Linux 7 (Core) 3.10.0-1160.el7.x86_64 docker://19.3.12 k8s-node-02 Ready <none> 3d20h v1.19.8 172.16.88.105 <none> CentOS Linux 7 (Core) 3.10.0-1160.el7.x86_64 docker://19.3.12 k8s-node-03 Ready <none> 3d20h v1.19.8 172.16.88.106 <none> CentOS Linux 7 (Core) 3.10.0-1160.el7.x86_64 docker://19.3.12 [root@k8s-master-01 ~]# kubectl top node NAME CPU(cores) CPU% MEMORY(bytes) MEMORY% k8s-ceph-01 1073m 26% 2387Mi 30% k8s-ceph-02 1074m 26% 3366Mi 43% k8s-ceph-03 1175m 29% 2690Mi 34% k8s-master-01 1137m 28% 2106Mi 27% k8s-master-02 966m 24% 1976Mi 25% k8s-master-03 1003m 25% 2102Mi 27% k8s-node-01 707m 17% 1965Mi 12% k8s-node-02 2109m 26% 4454Mi 28% k8s-node-03 1977m 24% 4457Mi 28% [root@k8s-master-01 ~]# kubectl get pod -A NAMESPACE NAME READY STATUS RESTARTS AGE kube-system calico-kube-controllers-69b47f4dfb-42scb 1/1 Running 0 3d20h kube-system calico-node-29lbv 1/1 Running 0 3d20h kube-system calico-node-45t8k 1/1 Running 0 3d20h kube-system calico-node-74sl5 1/1 Running 0 3d20h kube-system calico-node-fl2m8 1/1 Running 0 3d20h kube-system calico-node-lczd6 1/1 Running 0 3d20h kube-system calico-node-nrcz9 1/1 Running 0 3d20h kube-system calico-node-p25bb 1/1 Running 0 3d20h kube-system calico-node-q6f85 1/1 Running 0 3d20h kube-system calico-node-xp2xx 1/1 Running 0 3d20h kube-system coredns-f9fd979d6-5f4ds 1/1 Running 0 3d20h kube-system coredns-f9fd979d6-nhcz9 1/1 Running 0 3d20h kube-system etcd-k8s-master-01 1/1 Running 0 3d20h kube-system etcd-k8s-master-02 1/1 Running 0 3d20h kube-system etcd-k8s-master-03 1/1 Running 0 3d20h kube-system kube-apiserver-k8s-master-01 1/1 Running 0 3d20h kube-system kube-apiserver-k8s-master-02 1/1 Running 0 3d20h kube-system kube-apiserver-k8s-master-03 1/1 Running 0 3d20h kube-system kube-controller-manager-k8s-master-01 1/1 Running 2 3d20h kube-system kube-controller-manager-k8s-master-02 1/1 Running 2 3d20h kube-system kube-controller-manager-k8s-master-03 1/1 Running 2 3d20h kube-system kube-proxy-6smtq 1/1 Running 0 3d20h kube-system kube-proxy-grwxk 1/1 Running 0 3d20h kube-system kube-proxy-j6d7k 1/1 Running 0 3d20h kube-system kube-proxy-ksnhd 1/1 Running 0 3d20h kube-system kube-proxy-p2k59 1/1 Running 0 3d20h kube-system kube-proxy-pgxnh 1/1 Running 0 3d20h kube-system kube-proxy-s2kd6 1/1 Running 0 3d20h kube-system kube-proxy-xmvch 1/1 Running 0 3d20h kube-system kube-proxy-z54qk 1/1 Running 0 3d20h kube-system kube-scheduler-k8s-master-01 1/1 Running 1 3d20h kube-system kube-scheduler-k8s-master-02 1/1 Running 0 3d20h kube-system kube-scheduler-k8s-master-03 1/1 Running 2 3d20h kube-system kube-sealyun-lvscare-k8s-ceph-01 1/1 Running 0 3d20h kube-system kube-sealyun-lvscare-k8s-ceph-02 1/1 Running 0 3d20h kube-system kube-sealyun-lvscare-k8s-ceph-03 1/1 Running 0 3d20h kube-system kube-sealyun-lvscare-k8s-node-01 1/1 Running 0 3d20h kube-system kube-sealyun-lvscare-k8s-node-02 1/1 Running 0 3d20h kube-system kube-sealyun-lvscare-k8s-node-03 1/1 Running 0 3d20h kubernetes-dashboard dashboard-metrics-scraper-66dd8bdd86-dp5vg 1/1 Running 0 3d10h kubernetes-dashboard kubernetes-dashboard-5c4b99db7-9vnqr 1/1 Running 0 3d10h loki-logs grafana-loki-0 1/1 Running 0 3d8h loki-logs grafana-loki-promtail-4c9n2 1/1 Running 0 3d8h loki-logs grafana-loki-promtail-5jfx6 1/1 Running 0 3d8h loki-logs grafana-loki-promtail-bvfql 1/1 Running 0 3d8h loki-logs grafana-loki-promtail-dvcvq 1/1 Running 0 3d8h loki-logs grafana-loki-promtail-kgwvs 1/1 Running 0 3d8h loki-logs grafana-loki-promtail-pl986 1/1 Running 0 3d8h loki-logs grafana-loki-promtail-sgl8p 1/1 Running 0 3d8h loki-logs grafana-loki-promtail-xnqbz 1/1 Running 0 3d8h loki-logs grafana-loki-promtail-zj86c 1/1 Running 0 3d8h monitoring alertmanager-main-0 2/2 Running 0 3d8h monitoring alertmanager-main-1 2/2 Running 0 3d8h monitoring alertmanager-main-2 2/2 Running 0 3d8h monitoring blackbox-exporter-55c457d5fb-5hfmn 3/3 Running 0 3d8h monitoring grafana-79d866bddf-f5j99 1/1 Running 0 3d8h monitoring kube-state-metrics-76f6cb7996-8xbrj 3/3 Running 0 3d8h monitoring node-exporter-7rzqp 2/2 Running 0 3d8h monitoring node-exporter-dxpcq 2/2 Running 0 3d8h monitoring node-exporter-ftms2 2/2 Running 0 3d8h monitoring node-exporter-h87x4 2/2 Running 0 3d8h monitoring node-exporter-j27j2 2/2 Running 0 3d8h monitoring node-exporter-lwxsd 2/2 Running 0 3d8h monitoring node-exporter-qk59q 2/2 Running 0 3d8h monitoring node-exporter-t5zhs 2/2 Running 0 3d8h monitoring node-exporter-tg9fp 2/2 Running 0 3d8h monitoring prometheus-adapter-59df95d9f5-5mz9v 1/1 Running 0 3d8h monitoring prometheus-adapter-59df95d9f5-8gg4j 1/1 Running 0 3d8h monitoring prometheus-k8s-0 2/2 Running 1 3d8h monitoring prometheus-k8s-1 2/2 Running 1 3d8h monitoring prometheus-operator-7775c66ccf-j249k 2/2 Running 0 3d8h rook-ceph csi-cephfsplugin-7grct 3/3 Running 0 3d20h rook-ceph csi-cephfsplugin-7trv4 3/3 Running 0 3d20h rook-ceph csi-cephfsplugin-lb5zg 3/3 Running 0 3d20h rook-ceph csi-cephfsplugin-n569t 3/3 Running 0 3d20h rook-ceph csi-cephfsplugin-provisioner-6d4bd9b669-4j4b9 6/6 Running 4 3d20h rook-ceph csi-cephfsplugin-provisioner-6d4bd9b669-9pbpt 6/6 Running 9 3d20h rook-ceph csi-cephfsplugin-vmrxm 3/3 Running 0 3d20h rook-ceph csi-cephfsplugin-w94tz 3/3 Running 0 3d20h rook-ceph csi-rbdplugin-cgkqw 3/3 Running 0 3d20h rook-ceph csi-rbdplugin-drdrf 3/3 Running 0 3d20h rook-ceph csi-rbdplugin-g6pj8 3/3 Running 0 3d20h rook-ceph csi-rbdplugin-gd6q4 3/3 Running 0 3d20h rook-ceph csi-rbdplugin-provisioner-6bcd78bb89-7mch4 6/6 Running 8 3d20h rook-ceph csi-rbdplugin-provisioner-6bcd78bb89-fr6gc 6/6 Running 2 3d20h rook-ceph csi-rbdplugin-s6q2b 3/3 Running 0 3d20h rook-ceph csi-rbdplugin-sj85z 3/3 Running 0 3d20h rook-ceph rook-ceph-crashcollector-k8s-ceph-01-764696896d-gv9b4 1/1 Running 0 3d19h rook-ceph rook-ceph-crashcollector-k8s-ceph-02-66cdd4766f-rjmw6 1/1 Running 0 3d19h rook-ceph rook-ceph-crashcollector-k8s-ceph-03-7bfc9f7886-xzttd 1/1 Running 0 3d19h rook-ceph rook-ceph-crashcollector-k8s-node-02-84cb7dc68f-s2cfb 1/1 Running 0 3d19h rook-ceph rook-ceph-crashcollector-k8s-node-03-79fbc7f784-5lrnt 1/1 Running 0 3d19h rook-ceph rook-ceph-mgr-a-f694765d4-6bkjl 1/1 Running 0 3d19h rook-ceph rook-ceph-mon-a-7597d6fc57-8wx2j 1/1 Running 0 3d20h rook-ceph rook-ceph-mon-b-5fbd44fd56-z9z5q 1/1 Running 0 3d20h rook-ceph rook-ceph-mon-c-56cbd5d54b-blxcg 1/1 Running 0 3d20h rook-ceph rook-ceph-operator-57c548c785-ps6zh 1/1 Running 0 3d20h rook-ceph rook-ceph-osd-0-6987c7cd9b-fg9bs 1/1 Running 0 3d19h rook-ceph rook-ceph-osd-1-5bcf547b58-p74sw 1/1 Running 0 3d19h rook-ceph rook-ceph-osd-2-6978b8fb7f-6d7vw 1/1 Running 0 3d19h rook-ceph rook-ceph-osd-3-76f59c8f59-lm6f6 1/1 Running 0 3d19h rook-ceph rook-ceph-osd-4-54cbd6cf75-9k5lg 1/1 Running 0 3d19h rook-ceph rook-ceph-osd-5-7d4d6467c7-w95sf 1/1 Running 0 3d19h rook-ceph rook-ceph-osd-6-5758ff6748-9tgpn 1/1 Running 0 3d19h rook-ceph rook-ceph-osd-7-97f99c76b-ccfc5 1/1 Running 0 3d19h rook-ceph rook-ceph-osd-8-7bc6c4bccd-22n8j 1/1 Running 0 3d19h rook-ceph rook-ceph-osd-prepare-k8s-ceph-01-l4c8b 0/1 Completed 0 11m rook-ceph rook-ceph-osd-prepare-k8s-ceph-02-t62lz 0/1 Completed 0 11m rook-ceph rook-ceph-osd-prepare-k8s-ceph-03-g2k68 0/1 Completed 0 11m rook-ceph rook-ceph-osd-prepare-k8s-node-01-mfrzk 0/1 Completed 0 11m rook-ceph rook-ceph-osd-prepare-k8s-node-02-d42qs 0/1 Completed 0 11m rook-ceph rook-ceph-osd-prepare-k8s-node-03-jsdfx 0/1 Completed 0 11m rook-ceph rook-ceph-tools-7cd79f6fbf-q97bf 1/1 Running 0 3d12h weave weave-scope-agent-2wl2t 1/1 Running 0 22h weave weave-scope-agent-7bdzq 1/1 Running 0 22h weave weave-scope-agent-7gb87 1/1 Running 0 22h weave weave-scope-agent-blgtb 1/1 Running 0 22h weave weave-scope-agent-bllck 1/1 Running 0 22h weave weave-scope-agent-dhz7m 1/1 Running 0 22h weave weave-scope-agent-npg74 1/1 Running 0 22h weave weave-scope-agent-spgnf 1/1 Running 0 22h weave weave-scope-agent-wfrrv 1/1 Running 0 22h weave weave-scope-app-588b789d4-fxsl7 1/1 Running 0 22h weave weave-scope-cluster-agent-5d7745c9c9-xxcdd 1/1 Running 0 22h [root@k8s-master-01 ~]#
至此sealos部署k8s集群完毕!!

