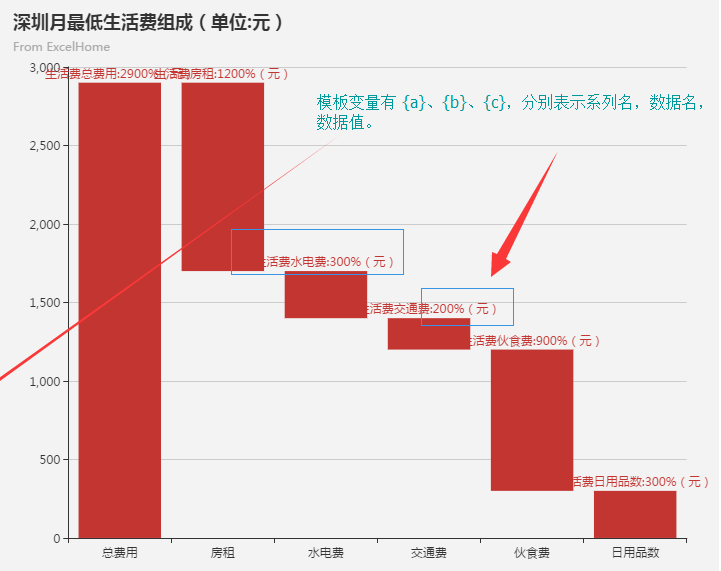
echarts_部分图表配置_柱状图或者其他图表上添加文字或单位
series[i]-bar.label.normal.formatter string, Function
标签内容格式器,支持字符串模板和回调函数两种形式,字符串模板与回调函数返回的字符串均支持用 \n 换行。
字符串模板 模板变量有 {a}、{b}、{c},分别表示系列名,数据名,数据值。

option = {
    title: {
        text: '深圳月最低生活费组成(单位:元)',
        subtext: 'From ExcelHome',
        sublink: 'http://e.weibo.com/1341556070/AjQH99che'
    },
    tooltip : {
        trigger: 'axis',
        axisPointer : {            // 坐标轴指示器,坐标轴触发有效
            type : 'shadow'        // 默认为直线,可选为:'line' | 'shadow'
        },
        formatter: function (params) {
            var tar = params[1];
            return tar.name + '<br/>' + tar.seriesName + ' : ' + tar.value;
        }
    },
    grid: {
        left: '3%',
        right: '4%',
        bottom: '3%',
        containLabel: true
    },
    xAxis: {
        type : 'category',
        splitLine: {show:false},
        data : ['总费用','房租','水电费','交通费','伙食费','日用品数']
    },
    yAxis: {
        type : 'value'
    },
    series: [
        {
            name: '辅助',
            type: 'bar',
            stack:  '总量',
            itemStyle: {
                normal: {
                    barBorderColor: 'rgba(0,0,0,0)',
                    color: 'rgba(0,0,0,0)'
                },
                emphasis: {
                    barBorderColor: 'rgba(0,0,0,0)',
                    color: 'rgba(0,0,0,0)'
                }
            },
            data: [0, 1700, 1400, 1200, 300, 0]
        },
        {
            name: '生活费',
            type: 'bar',
            stack: '总量',
            label: {
                normal: {
                    show: true,//是否显示
                    position: 'top',//文字位置
                    formatter: '{a}{b}:{c}%(元)'//c后面加单位

                }
            },
            data:[2900, 1200, 300, 200, 900, 300]
        }
    ]
};
我直接在formatter属性中添加了先要的单位,挺简单的,如大家有其他方式方案还望赐教


