# coding = utf-8
from matplotlib import pyplot as plt
import random
from matplotlib import font_manager
import matplotlib

#matplotlib设置字体
#法一:适用于windows/linux
# font = {
#     "family":"Microsoft YaHei UI",
#     "weight":"bold",
#     "size":"larger"
# }
# matplotlib.rc(font,**font)

#法二:适用于windows/linux/mac
my_font = font_manager.FontProperties(fname='C:/Windows/Fonts/simfang.ttf')#fname:系统支持的字体
x = range(0,120)
y = [random.randint(20,35) for i in range(120)]
plt.figure(figsize = (20,8),dpi = 80)
x_steps = ["10点{}分".format(i) for i in range(60)]
x_steps += ["11点{}分".format(i) for i in range(60)]
#调整x轴的刻度,取步长,数字和字符串一一对应
plt.xticks(list(x)[::3],x_steps[::3],rotation=45,fontproperties=my_font)#rotation表示旋转的度数
y_steps=range(min(y),max(y)+1)
plt.yticks(y_steps)
plt.xlabel('时间',fontproperties=my_font)
plt.ylabel('温度/℃',fontproperties=my_font)
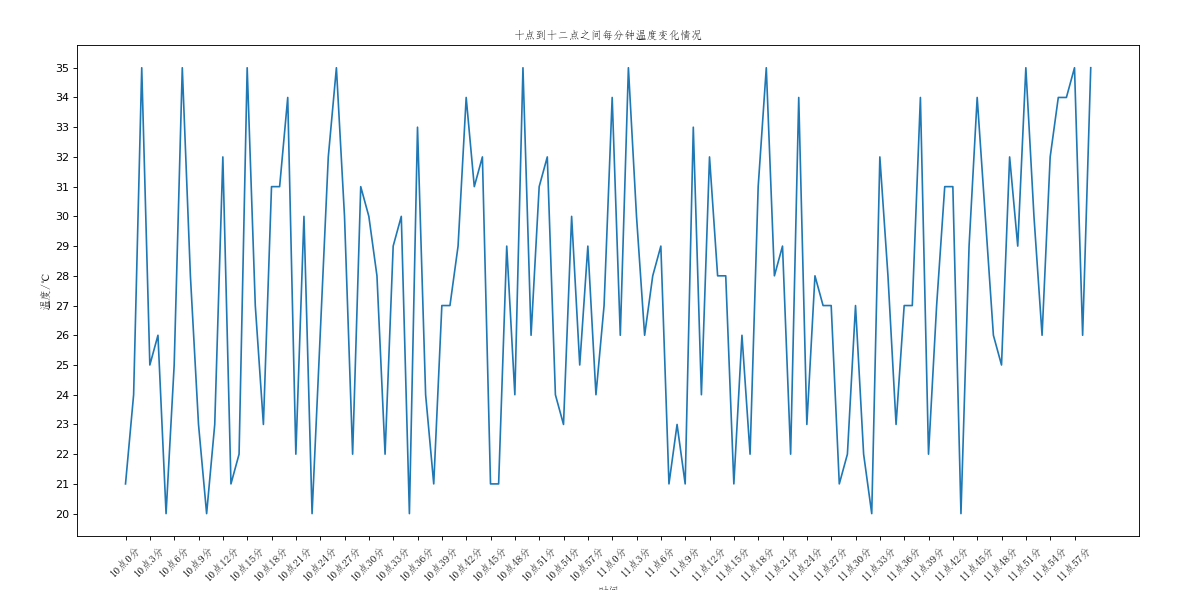
plt.title('十点到十二点之间每分钟温度变化情况',fontproperties=my_font)
plt.plot(x,y)
plt.show()


效果图:


