Matlab 曲线绘制之线型和颜色 示例
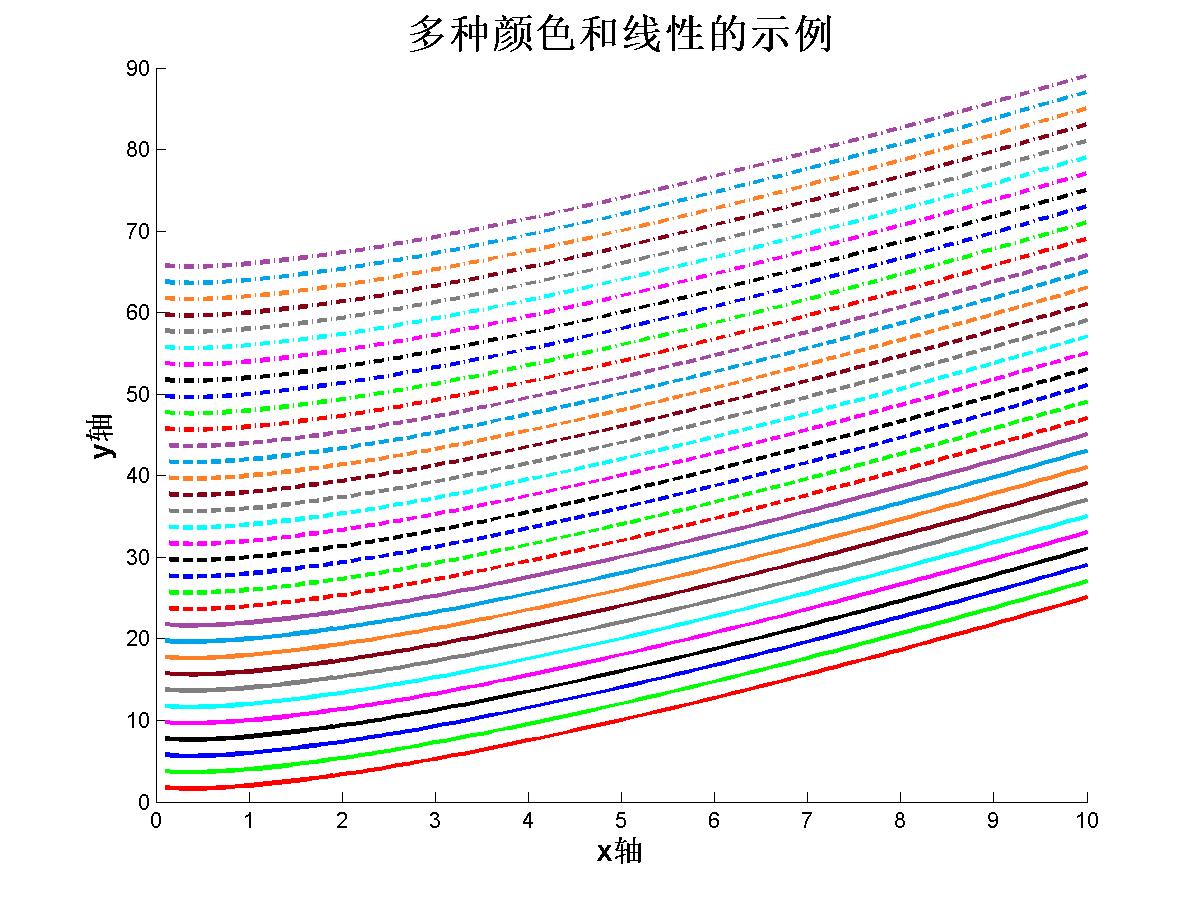
估计很多人会碰到,当绘制的曲线特别多的时候,需要用不同的颜色和线型区分开这些曲线。根据STC论文,自己整理了一个颜色和线型的例子,供大家直接使用,直接引用PlotStyle这个数据结构就可以了。
示例1
 1 PlotStyle={
 2     struct('Color',[1,0,0],'LineStyle','-'),...
 3     struct('Color',[0,1,0],'LineStyle','-'),...
 4     struct('Color',[0,0,1],'LineStyle','-'),...
 5     struct('Color',[0,0,0],'LineStyle','-'),...%    struct('Color',[1,1,0],'LineStyle','-'),...%yellow
 6     struct('Color',[1,0,1],'LineStyle','-'),...%pink
 7     struct('Color',[0,1,1],'LineStyle','-'),...
 8     struct('Color',[0.5,0.5,0.5],'LineStyle','-'),...%gray-25%
 9     struct('Color',[136,0,21]/255,'LineStyle','-'),...%dark red
10     struct('Color',[255,127,39]/255,'LineStyle','-'),...%orange
11     struct('Color',[0,162,232]/255,'LineStyle','-'),...%Turquoise
12     struct('Color',[163,73,164]/255,'LineStyle','-'),...%purple    %%%%%%%%%%%%%%%%%%%%
13     struct('Color',[1,0,0],'LineStyle','--'),...
14     struct('Color',[0,1,0],'LineStyle','--'),...
15     struct('Color',[0,0,1],'LineStyle','--'),...
16     struct('Color',[0,0,0],'LineStyle','--'),...%    struct('Color',[1,1,0],'LineStyle','--'),...%yellow
17     struct('Color',[1,0,1],'LineStyle','--'),...%pink
18     struct('Color',[0,1,1],'LineStyle','--'),...
19     struct('Color',[0.5,0.5,0.5],'LineStyle','--'),...%gray-25%
20     struct('Color',[136,0,21]/255,'LineStyle','--'),...%dark red
21     struct('Color',[255,127,39]/255,'LineStyle','--'),...%orange
22     struct('Color',[0,162,232]/255,'LineStyle','--'),...%Turquoise
23     struct('Color',[163,73,164]/255,'LineStyle','--'),...%purple    %%%%%%%%%%%%%%%%%%%
24     struct('Color',[1,0,0],'LineStyle','-.'),...
25     struct('Color',[0,1,0],'LineStyle','-.'),...
26     struct('Color',[0,0,1],'LineStyle','-.'),...
27     struct('Color',[0,0,0],'LineStyle','-.'),...%    struct('Color',[1,1,0],'LineStyle',':'),...%yellow
28     struct('Color',[1,0,1],'LineStyle','-.'),...%pink
29     struct('Color',[0,1,1],'LineStyle','-.'),...
30     struct('Color',[0.5,0.5,0.5],'LineStyle','-.'),...%gray-25%
31     struct('Color',[136,0,21]/255,'LineStyle','-.'),...%dark red
32     struct('Color',[255,127,39]/255,'LineStyle','-.'),...%orange
33     struct('Color',[0,162,232]/255,'LineStyle','-.'),...%Turquoise
34     struct('Color',[163,73,164]/255,'LineStyle','-.'),...%purple
35   };
36
37 x = 0.1:.1:10;
38 len = length(PlotStyle)
39 for i = 1:len
40    y = x.*log(x)+i*2;
41    hold on;
42    plot(x,y,'Color',PlotStyle{1,i}.Color,'LineStyle',PlotStyle{1,i}.LineStyle,'lineWidth', 2);%call method
43 end
44 title('多种颜色和线性的示例','FontSize',20,'FontWeight','bold','Color','k');
45 xlabel('x轴','FontSize',15,'FontWeight','bold','Color','k');
46 ylabel('y轴','FontSize',15,'FontWeight','bold','Color','k');
47 saveas(1, 'result', 'jpg');
效果如下图所示:

示例2
PlotStyle={
    struct('Color',[123,0,150]/255,'LineStyle','-'),...
    struct('Color',[1,0,160]/255,'LineStyle','--'),...
    struct('Color',[0,137,4]/255,'LineStyle','-.'),...
    struct('Color',[160,101,5]/255,'LineStyle',':'),...%    struct('Color',[1,1,0],'LineStyle','-'),...%yellow
    struct('Color',[150,0,5]/255,'LineStyle','-')
  };

x = 0:.1:10;
len = length(PlotStyle)
for i = 1:len
%    y = x.*log(x)+i*2;
   y = x.*sin(x)+i*2;
   hold on;
   plot(x,y,'Color',PlotStyle{1,i}.Color,'LineStyle',PlotStyle{1,i}.LineStyle,'lineWidth', 2);
end
title('多种颜色和线性的示例','FontSize',20,'FontWeight','bold','Color','k');
xlabel('x轴','FontSize',15,'FontWeight','bold','Color','k');
ylabel('y轴','FontSize',15,'FontWeight','bold','Color','k');
saveas(1, 'result2', 'jpg');
效果如下图所示:

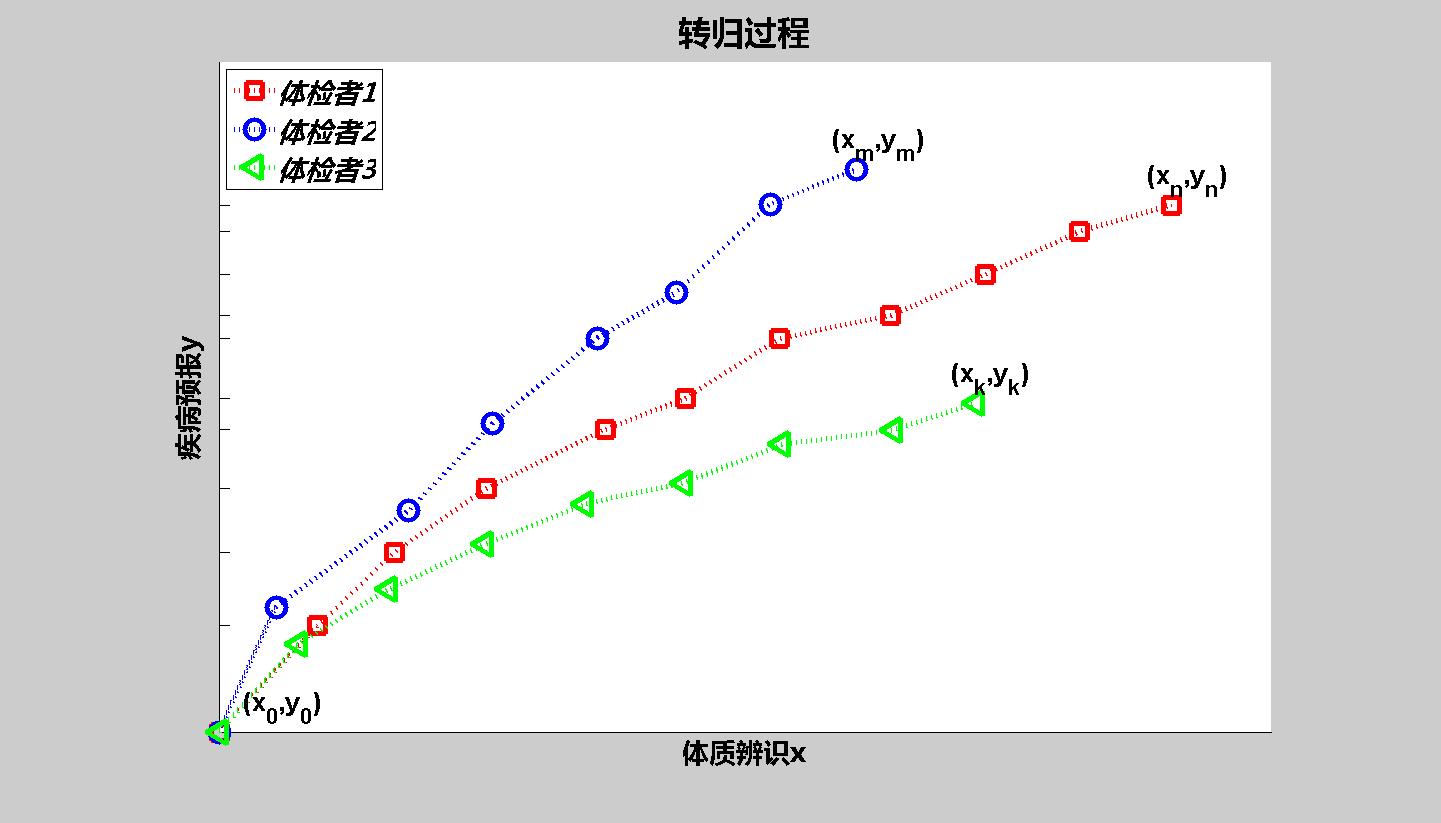
示例3
clc;
close all;
%%数据生成
ya = [];
yb = [];
yc = [];
xa = [];
xb = [];
xc = [];
for i = 0:10
    value0 = i*2+rand();
    valuea = i*2+rand();
    xa = [xa value0];
    ya = [ya 2*valuea.^(0.6)];
    valueb = i*2+rand();
    xb = [xb valueb];
    yb = [yb 2*valuea.^(0.7)];
    valuec = i*2+rand();
    xc = [xc valuec];
    yc = [yc 2*valuea.^(0.5)];
end
xa = xa - min(xa);
ya = ya - min(ya);
xb = xb - min(xb);
yb = yb - min(yb);
xc = xc - min(xc);
yc = yc - min(yc);
figure(1);
hold on;
axis equal  %强制坐标轴尺度相同,这个放在前面或者后面效果会不一样
xlim([0 22]);%x轴范围
ylim([0 14]);%y轴范围

%%绘制曲线
plot(xa,ya,'ms:','LineWidth',4,'MarkerSize',15,'Color', [1 0 0]);
x = xa(end);y = ya(end);
text(x-0.5,y+0.5,['(x_n,y_n)'],...
    'FontSize',20, 'Color',[0.0 0.0 0.0], 'FontWeight','bold');
plot(xb(1:end-3),yb(1:end-3),'ro:','LineWidth',4,'MarkerSize',15,'Color', [0 0 1]);
x = xb(end-3);y = yb(end-3);
text(x-0.5,y+0.5,['(x_m,y_m)'],...
    'FontSize',20, 'Color',[0.0 0.0 0.0], 'FontWeight','bold');
plot(xc(1:end-2),yc(1:end-2),'r<:','LineWidth',4,'MarkerSize',15,'Color', [0 1 0]);
x = xc(end-2);y = yc(end-2);
text(x-0.5,y+0.5,['(x_k,y_k)'],...
    'FontSize',20, 'Color',[0.0 0.0 0.0], 'FontWeight','bold');

%坐标原点
x = xc(1);y = yc(1);
text(x+0.5,y+0.5,['(x_0,y_0)'],...
    'FontSize',20, 'Color',[0.0 0.0 0.0], 'FontWeight','bold');
title('转归过程','FontSize',25,'FontWeight','bold','FontName','微软雅黑');

%%坐标轴标题设置
xlabel('体质辨识x','Color','k','FontSize',20,'FontWeight','bold','FontName','微软雅黑');%横轴标题
ylabel('疾病预报y','Color','k','FontSize',20,'FontWeight','bold','FontName','微软雅黑');%纵轴标题

%设置legend
hleg = legend('体检者1','体检者2','体检者3','Location','NorthWest');%本身不能设置字体的大小,需要通过set进行设置
set(hleg,'FontSize', 20, 'FontAngle','italic','FontWeight','bold',...
    'Color',[1,1,1]);%Color为设置坐标的背景颜色

%%坐标轴刻度设置
set(gca, 'ytick',ya,'yticklabel',{' ',' ',' ',' ',' ',' ','','','',''},'xtick',x,...
    'xticklabel',{'','','','','','','','','',''}, 'color',[1 1 1],...
    'FontSize',12,'FontName','微软雅黑'); %xtick就是你要在哪些地方显示刻度,xticklabel就是显示什么内容

scrsz = get(0,'ScreenSize');
set(gcf,'Position',scrsz);

%%保存图像
set(1, 'InvertHardCopy', 'off');%设置的背景色有效,如果为on则图形不保存背景色,maltab 默认为 on
filename = 'test';
saveas(1,filename,'jpeg');
效果如下图所示:

Make Change - Focus on Computer Vision and Pattern Recognition
版权声明:本文为博主原创文章,未经博主允许不得转载
版权声明:本文为博主原创文章,未经博主允许不得转载


