基于Python的某大学某学院新生高考成绩分析
# coding=gbk
import pandas as pd
import numpy as np
import matplotlib.pyplot as plt
from pylab import mpl
mpl.rcParams['font.sans-serif'] = ['FangSong'] # 指定默认字体
mpl.rcParams['axes.unicode_minus'] = False # 解决保存图像是负号'-'显示为方块的问题
# 读入数据
data = pd.read_excel("score.xls")
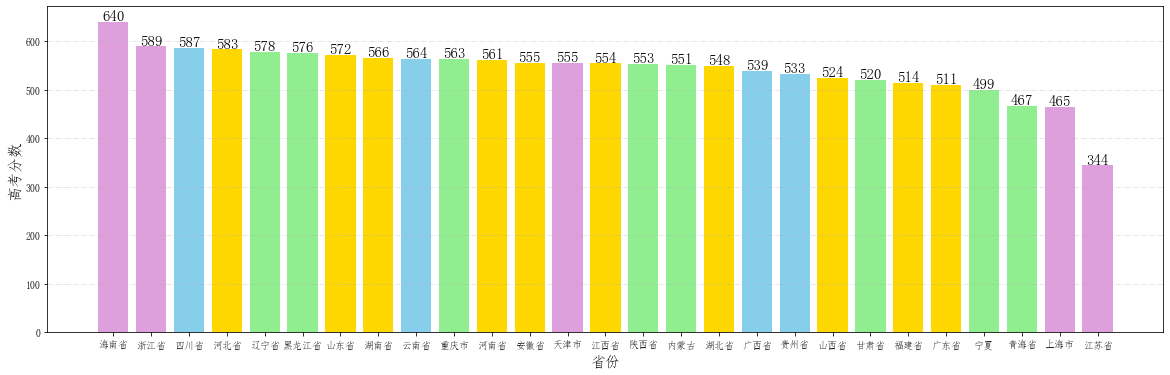
# 各省份数据分析
score_province = data.groupby("shengfen")
# 求取各省份高考成绩均值
score_province_mean = score_province.agg({"tdcj": "mean"})

score_province_mean = pd.DataFrame(score_province_mean)
score_province_mean = score_province_mean.sort_values(by="tdcj", ascending=False)
score_province_mean

# 提取出省份以及平均分
provinces = score_province_mean.index.tolist()
scores = score_province_mean["tdcj"].tolist()

# 开始画图

# 根据不同省的不同试卷规定柱子的颜色
TestPaper1 =  ['河南省', '河北省', '山西省', '江西省', '湖北省', '湖南省', '安徽省', '福建省', '山东省', '广东省'] #全国一卷
TestPaper2 = ['甘肃省', '青海省', '内蒙古', '黑龙江省', '辽宁省', '宁夏', '新疆省', '西藏', '陕西省', '重庆市']# 全国二卷
TestPaper3 = ['云南省', '广西省', '贵州省', '四川省'] #全国三卷

color = []
# gold 全国一卷
# lightgreen 全国二卷
# skyblue 全国三卷
# plum 自主命题

for i in provinces:
    if i in TestPaper1:
        color.append("gold")
    elif i in TestPaper2:
        color.append("lightgreen")
    elif i in TestPaper3:
        color.append("skyblue")
    else:
        color.append("plum")

# 开始作图
fig = plt.figure(figsize=(20,6))    # 设置画布大小
plt.grid(linestyle="-.", axis='y', alpha=0.4)
for a,b in zip(provinces,scores):
    plt.text(a, b-0.3,'%.0f'%b, ha = 'center',va = 'bottom',fontsize=15)
plt.xlabel("省份", fontsize=15)
plt.ylabel("高考分数", fontsize=15)
plt.bar(provinces,scores,color=color)
<BarContainer object of 27 artists>
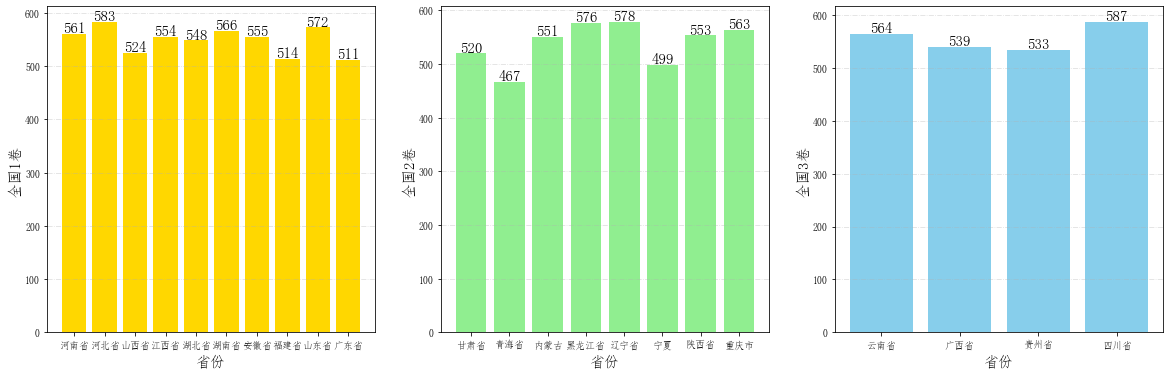
# 将相同试卷的省份拿出来进行对比作图
TestPaper1 =  ['河南省', '河北省', '山西省', '江西省', '湖北省', '湖南省', '安徽省', '福建省', '山东省', '广东省'] #全国一卷
TestPaper2 = ['甘肃省', '青海省', '内蒙古', '黑龙江省', '辽宁省', '宁夏', '陕西省', '重庆市']# 全国二卷
TestPaper3 = ['云南省', '广西省', '贵州省', '四川省'] #全国三卷

scores1 = [scores[provinces.index(i)] for i in TestPaper1]
scores2 = [scores[provinces.index(i)] for i in TestPaper2]
scores3 = [scores[provinces.index(i)] for i in TestPaper3]

# 创建子图
fig = plt.figure(figsize=(20,6))

ax1 = fig.add_subplot(1,3,1)
ax2 = fig.add_subplot(1,3,2)
ax3 = fig.add_subplot(1,3,3)


ax1.grid(linestyle="-.", axis='y', alpha=0.4)
for a,b in zip(TestPaper1,scores1):
    ax1.text(a, b-0.3,'%.0f'%b, ha = 'center',va = 'bottom',fontsize=15)
ax1.set_xlabel("省份", fontsize=15)
ax1.set_ylabel("全国1卷", fontsize=15)

ax2.grid(linestyle="-.", axis='y', alpha=0.4)
for a,b in zip(TestPaper2,scores2):
    ax2.text(a, b-0.3,'%.0f'%b, ha = 'center',va = 'bottom',fontsize=15)
ax2.set_xlabel("省份", fontsize=15)
ax2.set_ylabel("全国2卷", fontsize=15)

ax3.grid(linestyle="-.", axis='y', alpha=0.4)
for a,b in zip(TestPaper3,scores3):
    ax3.text(a, b-0.3,'%.0f'%b, ha = 'center',va = 'bottom',fontsize=15)
ax3.set_xlabel("省份", fontsize=15)
ax3.set_ylabel("全国3卷", fontsize=15)

ax1.bar(TestPaper1,scores1, color="gold")
ax2.bar(TestPaper2,scores2, color="lightgreen")
ax3.bar(TestPaper3,scores3, color="skyblue")
<BarContainer object of 4 artists>
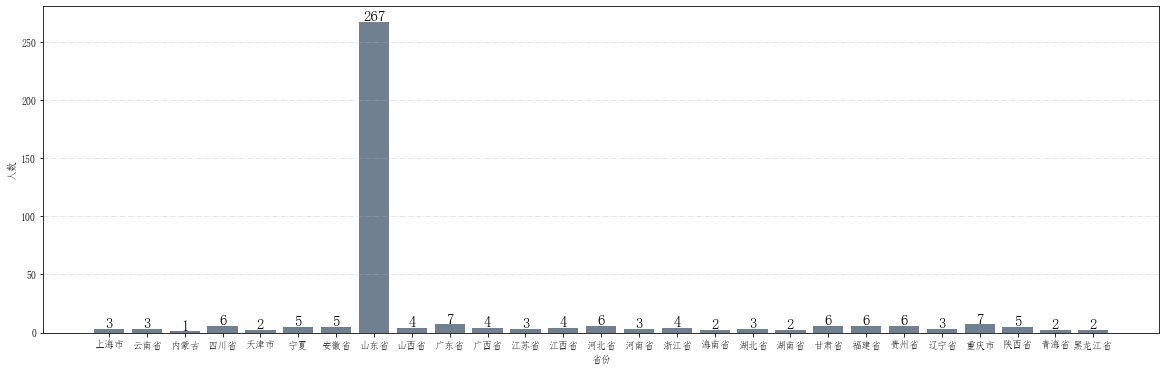
# 查看各省人数
numbers = score_province.count()
numbers = pd.DataFrame(numbers)
numbers = numbers["lqxy"]

# 提取出省份以及各省人数
provinces = numbers.index.tolist()
num_stu = numbers.tolist()

# 开始画图

fig = plt.figure(figsize=(20,6))    # 设置画布大小
plt.grid(linestyle="-.", axis='y', alpha=0.4)
for a,b in zip(provinces,num_stu):
    plt.text(a, b-0.3,'%.0f'%b, ha = 'center',va = 'bottom',fontsize=15)
plt.xlabel("省份")
plt.ylabel("人数")
plt.bar(provinces,num_stu, color="slategray")
<BarContainer object of 27 artists>
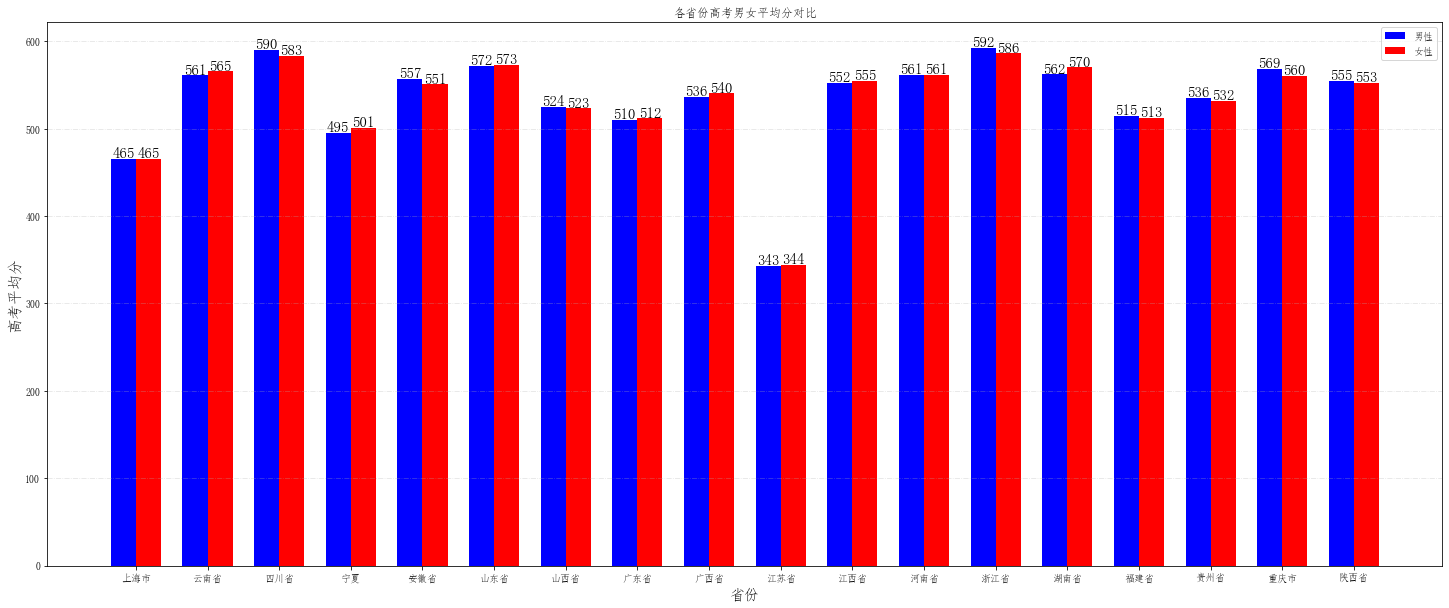
## 下面开始统计各省男女平均分数对比
sex_province_score = data.groupby(["shengfen", "xbmc"])["tdcj"].mean()
male = []
female = []

drop_list = []
for i in provinces:
    try:
        male.append(sex_province_score[i,"男"])
    except:
        male.append(0)
        drop_list.append(provinces.index(i))
    try:
        female.append(sex_province_score[i,"女"])
    except:
        female.append(0)
        drop_list.append(provinces.index(i))

male = np.delete(male, drop_list).tolist()
female = np.delete(female, drop_list).tolist()
provinces = np.delete(provinces, drop_list).tolist()

# 开始作图

fig = plt.figure(figsize=(25,10))
plt.grid(linestyle="-.", axis='y', alpha=0.35)
bar_width = 0.35  # 条形宽度
index_male = np.arange(len(provinces))  # 男生条形图的横坐标
index_female = index_male + bar_width  # 女生条形图的横坐标

# 使用两次 bar 函数画出两组条形图
plt.bar(index_male, male, width=bar_width, color='b', label='男性')
plt.bar(index_female, female, width=bar_width, color='r', label='女性')
for a,b in zip(index_male, male):
    plt.text(a, b-0.3,'%.0f'%b, ha = 'center',va = 'bottom',fontsize=15)
for a,b in zip(index_female,female):
    plt.text(a, b-0.3,'%.0f'%b, ha = 'center',va = 'bottom',fontsize=15)
plt.legend()  # 显示图例
plt.xticks(index_male + bar_width/2, provinces)  # 设置xticks index_male + bar_width/2 为横坐标轴刻度的位置

plt.ylabel('高考平均分', fontsize=15)  # 纵坐标轴标题
plt.xlabel('省份', fontsize=15)  # 纵坐标轴标题
plt.title('各省份高考男女平均分对比')  # 图形标题

plt.show()
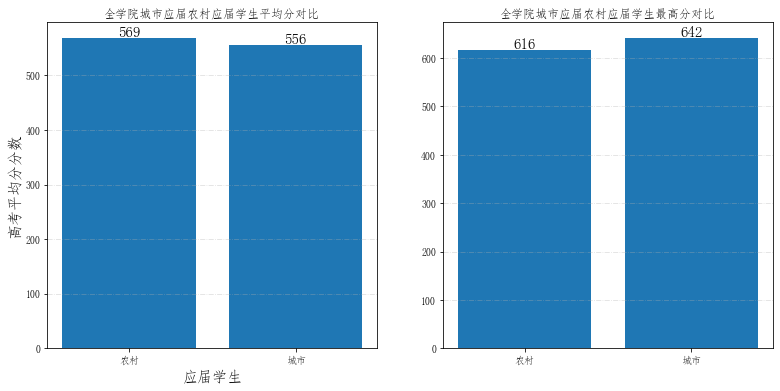
##下面开始统计城市应届与农村应届平均分数对比 以及 城市应届与农村应届男女平均分数对比
## 数据预处理
for index, row in data.iterrows():
     if "农" in data.loc[index, "kslbmc"]:
        data.loc[index, "kslbmc"] = "农村"
     elif "城" in data.loc[index, "kslbmc"]:
        data.loc[index, "kslbmc"] = "城市"
     else:
        data.drop(index=index, inplace=True)
city_village_data = data.groupby("kslbmc")
city_village_data = city_village_data["tdcj"]
city_village_data_max = pd.DataFrame(city_village_data.max())
city_village_data = pd.DataFrame(city_village_data.mean())


# 提取数据,以供作图
place = city_village_data.index.tolist()
score = city_village_data["tdcj"].tolist()
max_score = city_village_data_max["tdcj"].tolist()

# 开始作图
fig = plt.figure(figsize=(13,6))    # 设置画布大小
ax1 = fig.add_subplot(1,2,1)
ax2 = fig.add_subplot(1,2,2)

ax1.grid(linestyle="-.", axis='y', alpha=0.4)
ax2.grid(linestyle="-.", axis='y', alpha=0.4)

for a,b in zip(place,score):
    ax1.text(a, b-0.3,'%.0f'%b, ha = 'center',va = 'bottom',fontsize=15)
for a,b in zip(place,max_score):
    ax2.text(a, b-0.3,'%.0f'%b, ha = 'center',va = 'bottom',fontsize=15)

ax1.set_xlabel("应届学生", fontsize=15)
ax1.set_ylabel("高考平均分分数", fontsize=15)
ax1.set_title('全学院城市应届农村应届学生平均分对比')  # 图形标题
ax2.set_title('全学院城市应届农村应届学生最高分对比')  # 图形标题
ax1.bar(place,score)
ax2.bar(place, max_score)
<BarContainer object of 2 artists>
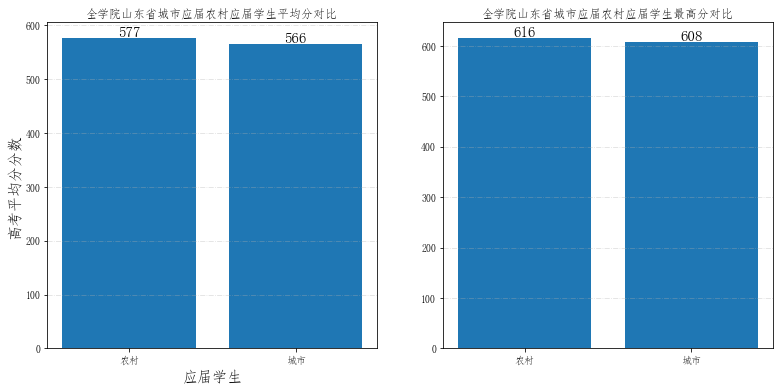
## 单独计算一下山东省城市应届农村应届平均分对比
temp= data.groupby("shengfen")
for i in temp:
    if i[0] == "山东省":
        ShanDong_data = i[1]
        break

ShanDong_data = ShanDong_data.groupby("kslbmc")
ShanDong_data = ShanDong_data["tdcj"]
ShanDong_data_max = pd.DataFrame(ShanDong_data.max())
print(ShanDong_data_max)
ShanDong_data = pd.DataFrame(ShanDong_data.mean())


# 提取数据,以供作图
place = ShanDong_data.index.tolist()
score = ShanDong_data["tdcj"].tolist()
max_score = ShanDong_data_max["tdcj"].tolist()

# 开始作图
fig = plt.figure(figsize=(13,6))    # 设置画布大小
ax1 = fig.add_subplot(1,2,1)
ax2 = fig.add_subplot(1,2,2)

ax1.grid(linestyle="-.", axis='y', alpha=0.4)
ax2.grid(linestyle="-.", axis='y', alpha=0.4)

for a,b in zip(place,score):
    ax1.text(a, b-0.3,'%.0f'%b, ha = 'center',va = 'bottom',fontsize=15)
for a,b in zip(place,max_score):
    ax2.text(a, b-0.3,'%.0f'%b, ha = 'center',va = 'bottom',fontsize=15)

ax1.set_xlabel("应届学生", fontsize=15)
ax1.set_ylabel("高考平均分分数", fontsize=15)
ax1.set_title('全学院山东省城市应届农村应届学生平均分对比')  # 图形标题
ax2.set_title('全学院山东省城市应届农村应届学生最高分对比')  # 图形标题
ax1.bar(place,score)
ax2.bar(place, max_score)
              tdcj
kslbmc
农村      616.000000
城市      608.128223


<BarContainer object of 2 artists>
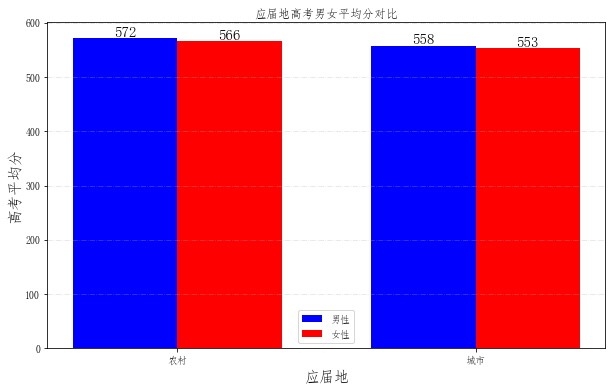
# 查看一下山东省农村应届与城市应届学生男女平均分数
# 数据预处理
for index, row in data.iterrows():
     if "女" in data.loc[index, "xbmc"]:
        data.loc[index, "xbmc"] = "女"
     elif "男" in data.loc[index, "xbmc"]:
        data.loc[index, "xbmc"] = "男"
     else:
        data.drop(index=index, inplace=True)

sex_cv_score = data.groupby(["kslbmc", "xbmc"])["tdcj"].mean()

print(sex_cv_score)
place = ["农村", "城市"]

male = []
female = []

for i in place:
    female.append(sex_cv_score[i,"女"])
    male.append(sex_cv_score[i,"男"])

# 开始作图

fig = plt.figure(figsize=(10,6))
plt.grid(linestyle="-.", axis='y', alpha=0.35)
bar_width = 0.35  # 条形宽度
index_male = np.arange(len(place))  # 男生条形图的横坐标
index_female = index_male + bar_width  # 女生条形图的横坐标

# 使用两次 bar 函数画出两组条形图
plt.bar(index_male, male, width=bar_width, color='b', label='男性')
plt.bar(index_female, female, width=bar_width, color='r', label='女性')
for a,b in zip(index_male, male):
    plt.text(a, b-0.3,'%.0f'%b, ha = 'center',va = 'bottom',fontsize=15)
for a,b in zip(index_female,female):
    plt.text(a, b-0.3,'%.0f'%b, ha = 'center',va = 'bottom',fontsize=15)
plt.legend()  # 显示图例
plt.xticks(index_male + bar_width/2, place)  # 设置xticks index_male + bar_width/2 为横坐标轴刻度的位置

plt.ylabel('高考平均分', fontsize=15)  # 纵坐标轴标题
plt.xlabel('应届地', fontsize=15)  # 纵坐标轴标题
plt.title('应届地高考男女平均分对比')  # 图形标题

plt.show()
kslbmc  xbmc
农村      女       566.241910
        男       572.030391
城市      女       553.481005
        男       557.798552
Name: tdcj, dtype: float64
本文来自博客园,作者:CuriosityWang,转载请注明原文链接:https://www.cnblogs.com/curiositywang/p/14444473.html

 浙公网安备 33010602011771号