python 双曲线 双坐标 上下X坐标轴 左右Y坐标轴
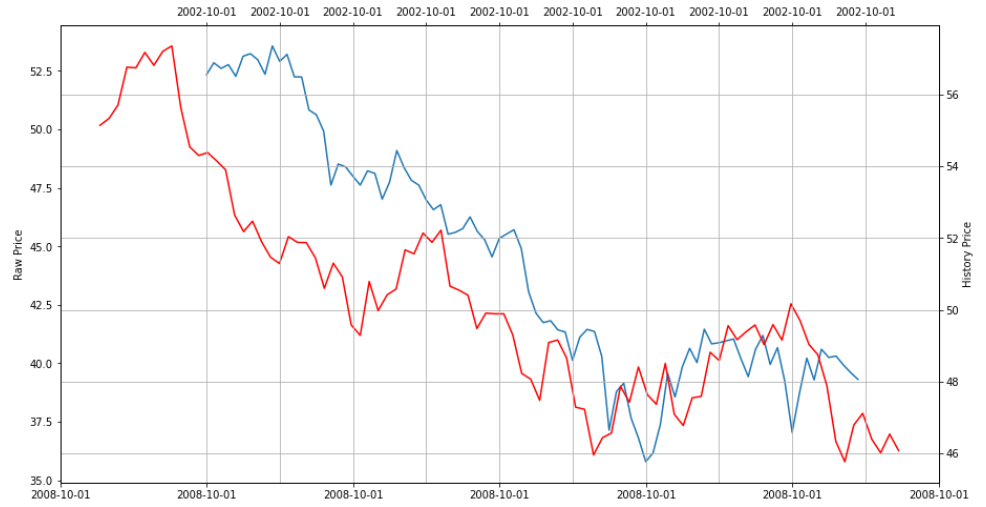
raw = [52.34, 52.85, 52.61, 52.77, 52.27, 53.13, 53.24, 52.98, 52.36, 53.57, 52.91, 53.21, 52.25, 52.24, 50.83, 50.63, 49.93, 47.62, 48.52, 48.4, 48.0, 47.62, 48.23, 48.12, 47.02, 47.74, 49.1, 48.36, 47.82, 47.62, 46.99, 46.57, 46.78, 45.52, 45.6, 45.76, 46.26, 45.64, 45.28, 44.55, 45.34, 45.53, 45.71, 44.91, 43.06, 42.15, 41.74, 41.82, 41.43, 41.34, 40.13, 41.12, 41.45, 41.36, 40.29, 37.14, 38.79, 39.15, 37.66, 36.81, 35.79, 36.17, 37.39, 39.57, 38.56, 39.85, 40.64, 40.03, 41.46, 40.83, 40.88, 40.96, 41.04, 40.2, 39.43, 40.6, 41.19, 39.95, 40.67, 39.22, 37.05, 38.72, 40.22, 39.29, 40.6, 40.25, 40.31, 39.93, 39.6, 39.31]
history = [55.14, 55.33, 55.7, 56.76, 56.74, 57.17, 56.81, 57.2, 57.35, 55.64, 54.54, 54.3, 54.38, 54.15, 53.9, 52.64, 52.18, 52.47, 51.9, 51.47, 51.29, 52.04, 51.88, 51.87, 51.45, 50.6, 51.3, 50.92, 49.58, 49.29, 50.79, 49.98, 50.42, 50.58, 51.67, 51.56, 52.14, 51.88, 52.22, 50.66, 50.55, 50.41, 49.48, 49.91, 49.89, 49.89, 49.3, 48.23, 48.07, 47.48, 49.09, 49.16, 48.66, 47.29, 47.23, 45.96, 46.44, 46.57, 47.87, 47.43, 48.41, 47.64, 47.37, 48.51, 47.09, 46.78, 47.55, 47.59, 48.82, 48.59, 49.56, 49.17, 49.39, 49.58, 49.03, 49.59, 49.16, 50.17, 49.71, 49.04, 48.75, 47.89, 46.34, 45.77, 46.79, 47.12, 46.4, 46.02, 46.54, 46.08]


By=raw
Bx=history
fig = plt.figure(figsize=(15,8))
ax1=fig.add_subplot(111)
ax1.plot(By,label='Br')
#ax1.set_xticks(range(0,len(Bx),10))  # 设置x轴的刻度
#ax1.xaxis.set_ticks_position('bottom')
ax1.set_ylabel('Br(T)')
top_label1 =  ['2008-10-01']*10 #置换的标签
ax1.set_xticklabels(top_label1)

ax2 = ax1.twinx()
ax2.plot(Bx,'r',label='Bn')
ax2.set_ylabel('Bn(T)')
#plt.style.use('seaborn-paper')
#ax1.set_xticks(range(10,len(By)+10),10)  # 设置x轴的刻度
# ax2.xaxis.set_ticks_position('top')
# ax2.yaxis.tick_right()
# ax1.legend(loc='upper left')
# ax2.legend(loc='upper right')
plt.grid()

ax_top = ax1.twiny()
xticks = ax1.get_xticks()
ax1.set_xticks(xticks)
xlim = ax1.get_xlim()
ax_top.set_xlim(xlim)

top_tick = range(0,100,10) #坐标的位置
top_label =  ['2002-10-01']*10 #置换的标签
ax_top.set_xticks(top_tick)
ax_top.set_xticklabels(top_label)
plt.grid()
plt.show();
#fig.savefig('111',bbox_inches = 'tight',pad_inches = 0,dpi =350)
参考:

 浙公网安备 33010602011771号