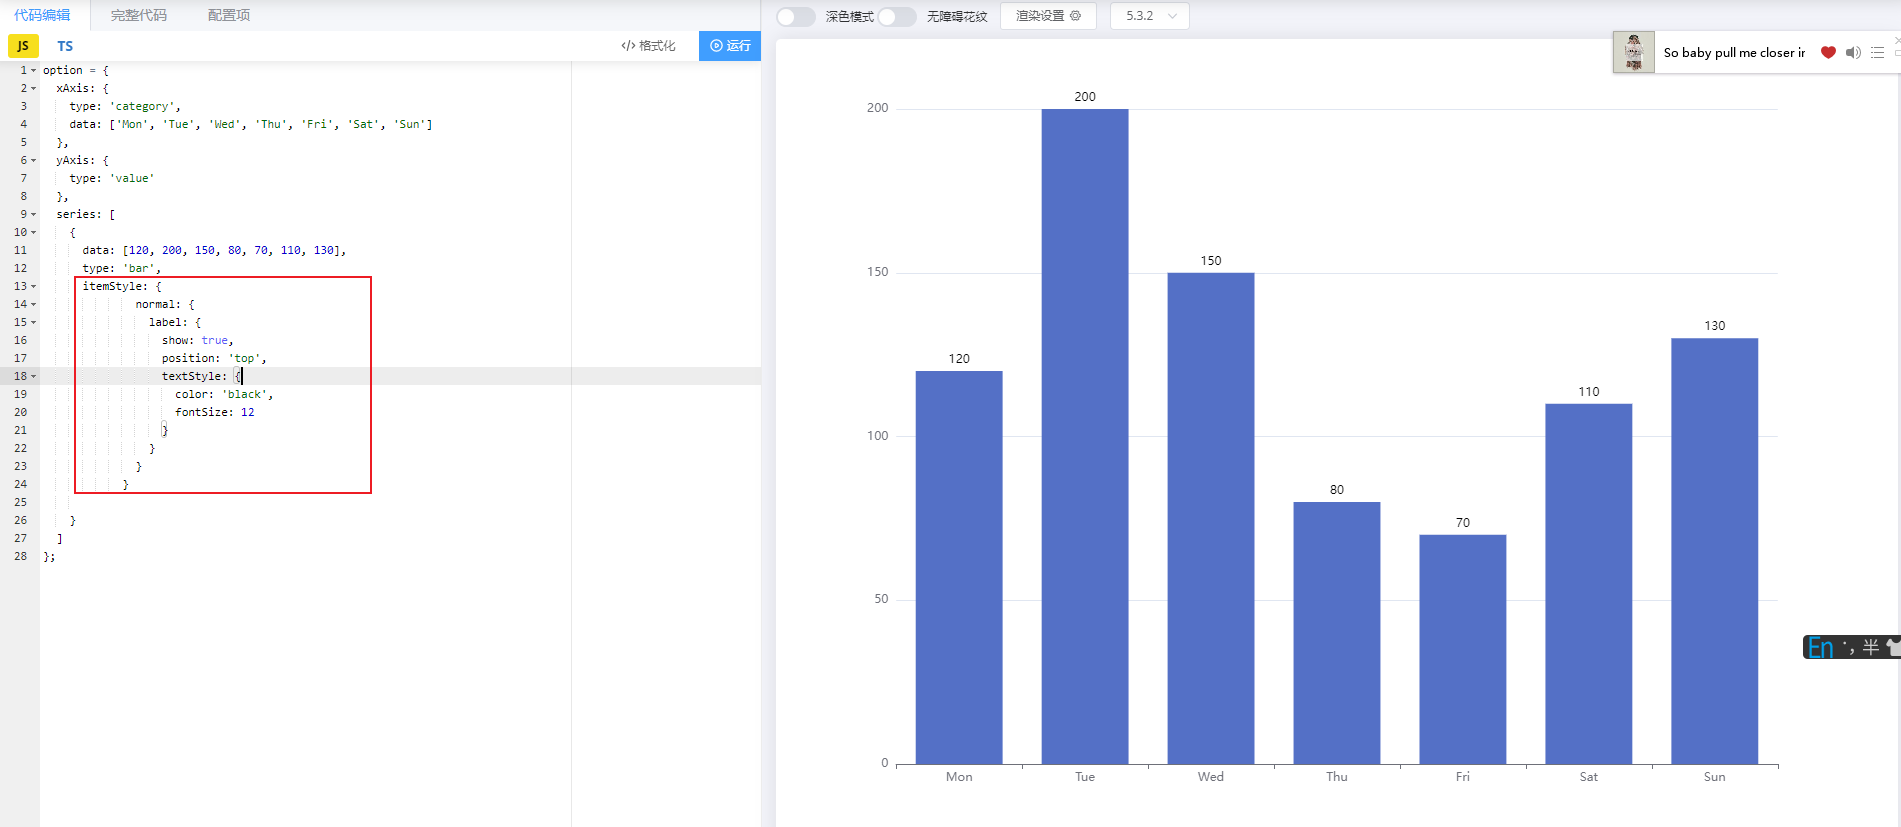
echarts-柱状图-上方显示数据
使用官网的例子,只不过加了itemStyle属性
<!DOCTYPE html>

<head>
	<meta charset="utf-8">
	<title>ECharts</title>
</head>

<body>
	<!-- 为ECharts准备一个具备大小(宽高)的Dom -->
	<div id="main" style="width:900px;height:300px"></div>
	<!-- ECharts单文件引入 -->
	<script src="http://echarts.baidu.com/build/dist/echarts.js"></script>
	<script type="text/javascript">
		// 路径配置
		require.config({
			paths: {
				echarts: 'http://echarts.baidu.com/build/dist'
			}
		});

		// 使用
		require(
			[
				'echarts',
				'echarts/chart/bar' // 使用柱状图就加载bar模块,按需加载
			],
			function(ec) {
				// 基于准备好的dom,初始化echarts图表
				var myChart = ec.init(document.getElementById('main'));

				var option = {
                    xAxis: {
                        type: 'category',
                        data: ['Mon', 'Tue', 'Wed', 'Thu', 'Fri', 'Sat', 'Sun']
                    },
                    yAxis: {
                        type: 'value'
                    },
                    series: [
                        {
                            data: [120, 200, 150, 80, 70, 110, 130],
                            type: 'bar',
                            itemStyle: {
                                normal: {
                                    label: {
                                        show: true,
                                        position: 'top',
                                        textStyle: {
                                            color: 'black',
                                            fontSize: 12
                                        }
                                    }
                                }
                            }

                        }
                    ]
                };

				// 为echarts对象加载数据
				myChart.setOption(option);
			}
		);
	</script>

</body>

 浙公网安备 33010602011771号