
1.依赖centos安装docker
2.下载镜像包
docker pull prom/node-exporter
docker pull prom/prometheus
docker pull grafana/grafana

3.启动node-exporter
docker run -d -p 9100:9100 \ -v "/proc:/host/proc:ro" \ -v "/sys:/host/sys:ro" \ -v "/:/rootfs:ro" \ --net="host" \ prom/node-exporter
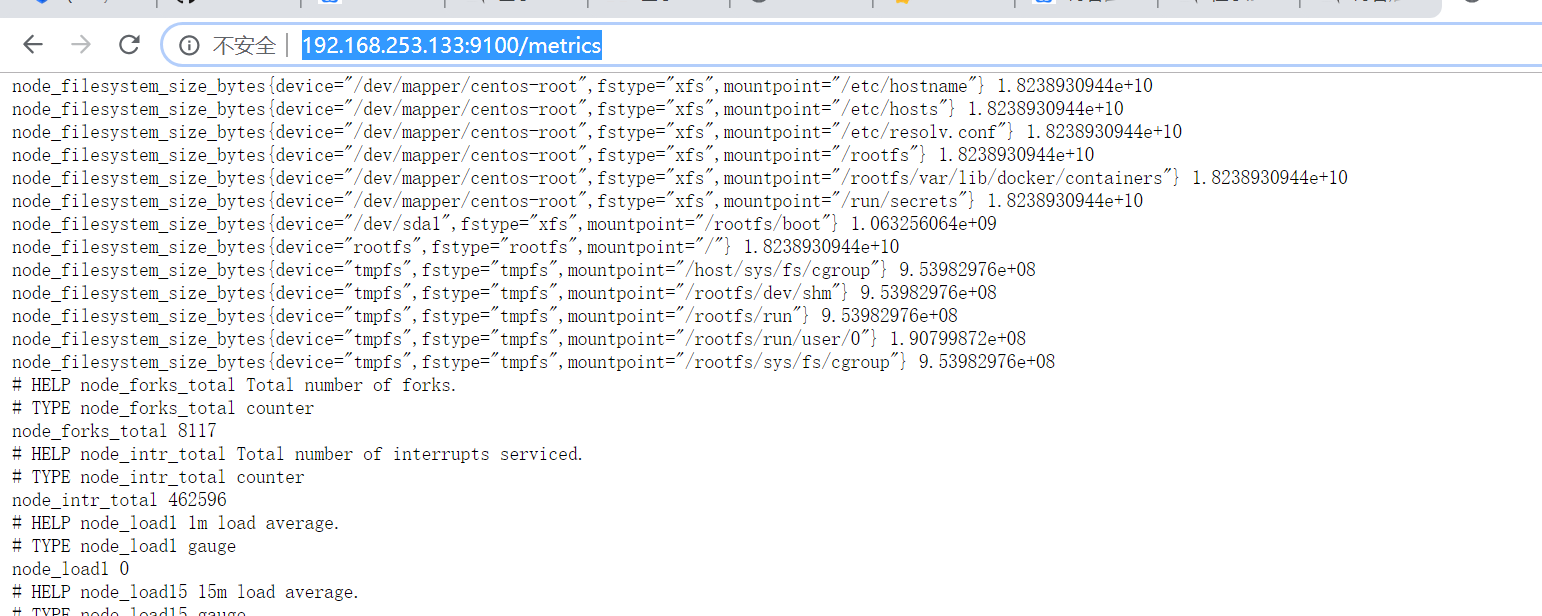
4.检查启动9100端口映射
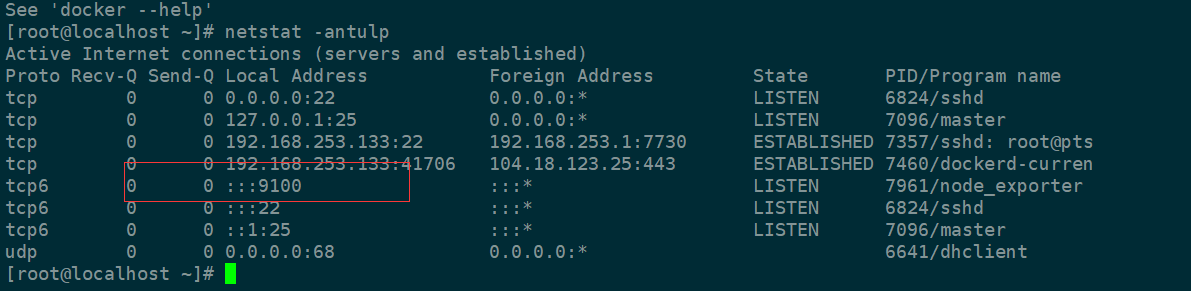
http://192.168.253.133:9100/metrics
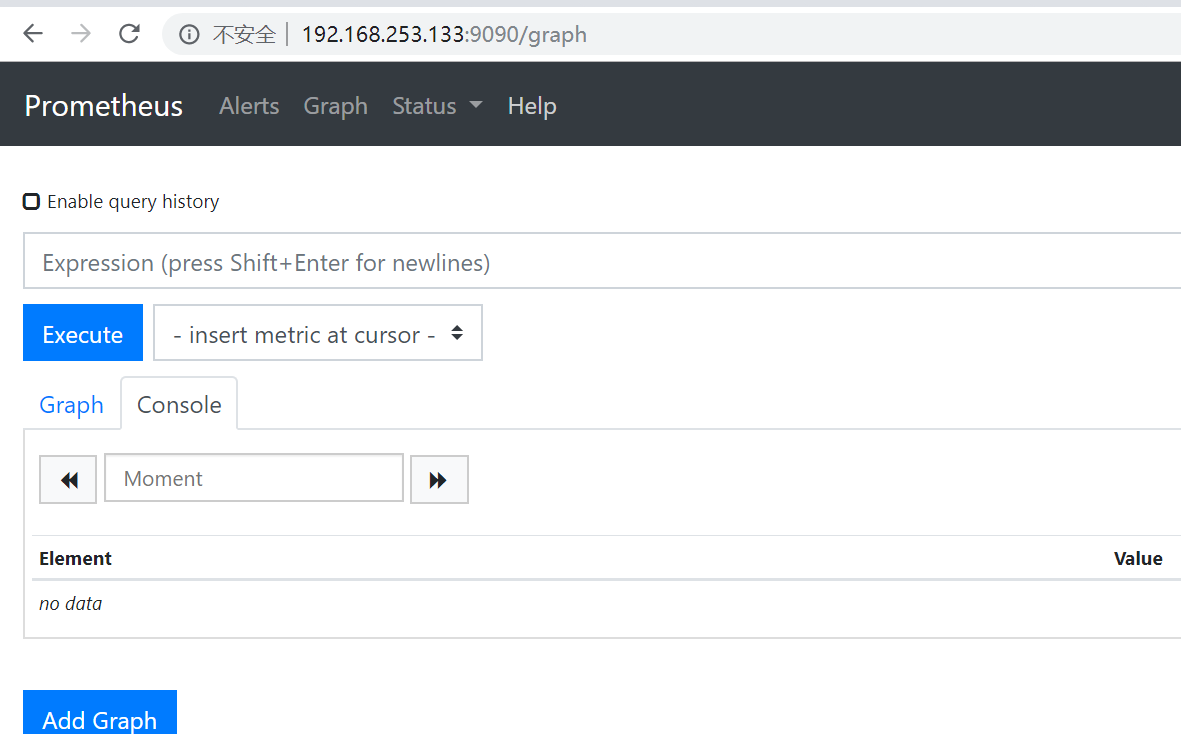
5.启动prometheus
mkdir /opt/prometheus
cd /opt/prometheus/
vim prometheus.yml
global:
scrape_interval: 60s
evaluation_interval: 60s
scrape_configs:
- job_name: prometheus
static_configs:
- targets: ['localhost:9090']
labels:
instance: prometheus
- job_name: linux
static_configs:
- targets: ['192.168.253.133:9100']
labels:
instance: localhost
[root@localhost prometheus]# docker run -d -p 9090:9090 -v /opt/prometheus/prometheus.yml:/etc/prometheus/prometheus.yml prom/prometheus
d4738e450194e1500defb0625c37d63a2d9b01e803dfb73f21c34f7bbb22e644
[root@localhost prometheus]# docker logs -f d4738e450194e1500defb0625c37d63a2d9b01e803dfb73f21c34f7bbb22e644
level=info ts=2019-06-14T17:22:24.736Z caller=main.go:286 msg="no time or size retention was set so using the default time retention" duration=15d
level=info ts=2019-06-14T17:22:24.736Z caller=main.go:322 msg="Starting Prometheus" version="(version=2.10.0, branch=HEAD, revision=d20e84d0fb64aff2f62a977adc8cfb656da4e286)"
level=info ts=2019-06-14T17:22:24.736Z caller=main.go:323 build_context="(go=go1.12.5, user=root@a49185acd9b0, date=20190525-12:28:13)"
level=info ts=2019-06-14T17:22:24.736Z caller=main.go:324 host_details="(Linux 3.10.0-957.el7.x86_64 #1 SMP Thu Nov 8 23:39:32 UTC 2018 x86_64 d4738e450194 (none))"
level=info ts=2019-06-14T17:22:24.736Z caller=main.go:325 fd_limits="(soft=1048576, hard=1048576)"
level=info ts=2019-06-14T17:22:24.736Z caller=main.go:326 vm_limits="(soft=unlimited, hard=unlimited)"
level=info ts=2019-06-14T17:22:24.738Z caller=main.go:645 msg="Starting TSDB ..."
level=info ts=2019-06-14T17:22:24.739Z caller=web.go:417 component=web msg="Start listening for connections" address=0.0.0.0:9090
level=info ts=2019-06-14T17:22:24.752Z caller=main.go:660 fs_type=XFS_SUPER_MAGIC
level=info ts=2019-06-14T17:22:24.752Z caller=main.go:661 msg="TSDB started"
level=info ts=2019-06-14T17:22:24.752Z caller=main.go:730 msg="Loading configuration file" filename=/etc/prometheus/prometheus.yml
level=info ts=2019-06-14T17:22:24.754Z caller=main.go:758 msg="Completed loading of configuration file" filename=/etc/prometheus/prometheus.yml
level=info ts=2019-06-14T17:22:24.754Z caller=main.go:614 msg="Server is ready to receive web requests."
6.启动grafana
[root@localhost prometheus]# mkdir /opt/grafana-storage
[root@localhost prometheus]# chmod 777 -R /opt/grafana-storage
[root@localhost prometheus]# docker run -d \
> -p 3000:3000 \
> --name=grafana \
> -v /opt/grafana-storage:/var/lib/grafana \
> grafana/grafana
65b31be51c39b90cd3fdff431a4e4f17b124aa96cd56d3019565696ef2a6bd6e
[root@localhost prometheus]# docker


 浙公网安备 33010602011771号