计算机图形学报告4
西安电子科技大学
计算机图形学 课程实验报告
实验名称 第4次上机实验
 计算机 学院 1803012 班
姓名 曹王欣 学号 18030100167
同作者
实验日期 2020 年 月 日
实验地点 实验批次
指导教师评语:
指导教师: 年 月 日 |
实验报告内容基本要求及参考格式 一、实验目的 二、实验所用仪器(或实验环境) 三、实验基本原理及步骤(或方案设计及理论计算) 四、实验数据记录(或仿真及软件设计) 五、实验结果分析及回答问题(或测试环境及测试结果) |
- 绘制曲线(借鉴lec6课件)
1. 已知4点P1(0,0,0)、P2(1,1,1)、 P3(2,-1,-1)、P4(3,0,0),用其作为控制点分别绘制一条Bezier曲线、一条B样条曲线,并分别计算参数为0、1/3、 2/3、1时它们各自的位置矢量。
画bezier曲线的代码如下:
#include<GL/glut.h>
#include<iostream>
using namespace std;
typedef struct {
float x, y, z;
}Point;
Point ctrlpoints[4] = { {0,0,0.0},{1,1.0,1.0},{2.0,-1.0,-1.0},{3.0,0.0,0.0} };
void init()
{
glClearColor(1.0, 1.0, 1.0, 1.0);
}
void DrawCurve(int n)
{
Point p;
double t, deltat, t2, t3, et, et2, et3;
int i;
deltat = 1.0 / (n - 1);
glBegin(GL_LINE_STRIP);
for (i = 0; i < 100; i++)
{
t = i * deltat;
et = 1 - t;
t2 = t * t;
et2 = et * et;
t3 = t * t2;
et3 = et * et2;
p.x = et3 * ctrlpoints[0].x + 3 * t * et2 * ctrlpoints[1].x + 3 * t2 * et * ctrlpoints[2].x + t3 * ctrlpoints[3].x;
p.y = et3 * ctrlpoints[0].y + 3 * t * et2 * ctrlpoints[1].y + 3 * t2 * et * ctrlpoints[2].y + t3 * ctrlpoints[3].y;
p.z = et3 * ctrlpoints[0].z + 3 * t * et2 * ctrlpoints[1].z + 3 * t2 * et * ctrlpoints[2].z + t3 * ctrlpoints[3].z;
glVertex3f(p.x, p.y, p.z);
if (i == 33 || i == 66 || i == 99 || i == 0)
{
cout << (double)i / 100 << endl;
cout << p.x << " " << " " << p.y << " " << p.z << endl;
}
}
glEnd();
glPointSize(5.0);
glColor3f(0.0, 0.0, 0.0);
glBegin(GL_POINTS);
for (i = 0; i < 4; i++)
glVertex3f(ctrlpoints[i].x, ctrlpoints[i].y, ctrlpoints[i].z);
glEnd();
}
void RenderScence()
{
glClear(GL_COLOR_BUFFER_BIT);
glColor3f(1.0, 0.0, 0.0);
DrawCurve(100);
glFlush();
}
void ChangeSize(GLsizei w, GLsizei h)
{
GLfloat aspectRatio;
if (h == 0)
h = 1;
glViewport(0, 0, w, h);
glMatrixMode(GL_PROJECTION);
glLoadIdentity();
aspectRatio = (GLfloat)w / (GLfloat)h;
if (w <= h)
glOrtho(-5.0, 5.0, -5.0 / aspectRatio, 5.0 / aspectRatio, 1.0, -1.0);
else
glOrtho(-5.0 * aspectRatio, 5.0 * aspectRatio, -5.0, 5.0, 1.0, -1.0);
glMatrixMode(GL_MODELVIEW);
glLoadIdentity();
}
int main(int argc, char** argv)
{
glutInit(&argc, argv);
glutInitDisplayMode(GLUT_SINGLE | GLUT_RGB);
glutCreateWindow("DrawBezier");
init();
glutDisplayFunc(RenderScence);
glutReshapeFunc(ChangeSize);
glutMainLoop();
return 0;
}
而且我们计算了t=0,1/3,2/3,1的值
看实验截图:
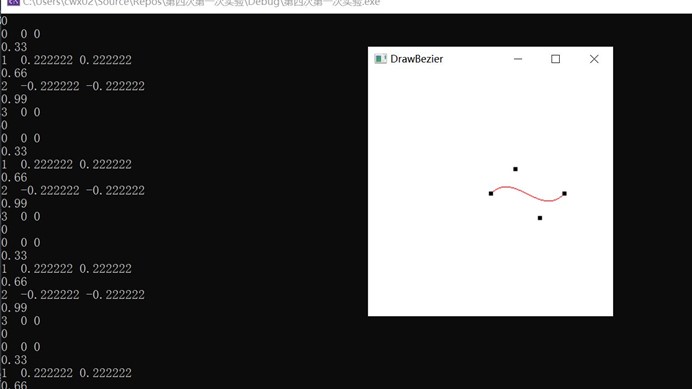
当t=0 (0,0,0) ;t=1/3时(1,0.22,0.22); t=2/3的时候显示的(0,-0.22,-0.22) t=1为(3,0,0)
画bline曲线的代码如下:
#include<GL/glut.h>
#include<iostream>
using namespace std;
typedef struct {
float x, y, z;
}Point;
Point ctrlpoints[4] = { {0,0,0.0},{1,1.0,1.0},{2.0,-1.0,-1.0},{3.0,0.0,0.0} };
void init()
{
glClearColor(1.0, 1.0, 1.0, 1.0);
}
void DrawCurve(int n)
{
Point p;
double t, deltat, t2, t3, et, et2, et3,et0;
int i;
deltat = 1.0 / (n - 1);
/*glBegin(GL_LINE_STRIP);
for (i = 0; i < 100; i++)
{
t = i * deltat;
et = 1 - t;
t2 = t * t;
et2 = et * et;
t3 = t * t2;
et3 = et * et2;
p.x = et3 * ctrlpoints[0].x + 3 * t * et2 * ctrlpoints[1].x + 3 * t2 * et * ctrlpoints[2].x + t3 * ctrlpoints[3].x;
p.y = et3 * ctrlpoints[0].y + 3 * t * et2 * ctrlpoints[1].y + 3 * t2 * et * ctrlpoints[2].y + t3 * ctrlpoints[3].y;
p.z = et3 * ctrlpoints[0].z + 3 * t * et2 * ctrlpoints[1].z + 3 * t2 * et * ctrlpoints[2].z + t3 * ctrlpoints[3].z;
glVertex3f(p.x, p.y, p.z);
if (i == 33 || i == 66 || i == 99 || i == 0)
{
cout << (double)i / 100 << endl;
cout << p.x << " " << " " << p.y << " " << p.z << endl;
}
}
glEnd();*/
//画bline样条曲线
glBegin(GL_LINE_STRIP);
for (i = 0; i < 100; i++)
{
t = i * deltat;
et3 = 1.0 / 6 * (1 - 3 * t + 3 * t * t - t * t * t);
et2 = 1.0 / 6 * (4 - 6 * t * t + 3 * t * t * t);
et = 1.0 / 6 * (-3 * t * t * t + 3 * t * t + 3 * t + 1);
et0 = 1.0 / 6 * (t * t * t);
p.x = et3 * ctrlpoints[0].x + et2 * ctrlpoints[1].x + et * ctrlpoints[2].x + et0 * ctrlpoints[3].x;
p.y = et3 * ctrlpoints[0].y + et2 * ctrlpoints[1].y + et * ctrlpoints[2].y + et0 * ctrlpoints[3].y;
p.z = et3 * ctrlpoints[0].z + et2 * ctrlpoints[1].z + et * ctrlpoints[2].z + et0 * ctrlpoints[3].z;
glVertex3f(p.x, p.y, p.z);
if (i == 33 || i == 66 || i == 99 || i == 0)
{
cout << (double)i / 100 << endl;
cout << p.x << " " << " " << p.y << " " << p.z << endl;
}
}
glEnd();
glPointSize(5.0);
glColor3f(0.0, 0.0, 0.0);
glBegin(GL_POINTS);
for (i = 0; i < 4; i++)
glVertex3f(ctrlpoints[i].x, ctrlpoints[i].y, ctrlpoints[i].z);
glEnd();
}
void RenderScence()
{
glClear(GL_COLOR_BUFFER_BIT);
glColor3f(1.0, 0.0, 0.0);
DrawCurve(100);
glFlush();
}
void ChangeSize(GLsizei w, GLsizei h)
{
GLfloat aspectRatio;
if (h == 0)
h = 1;
glViewport(0, 0, w, h);
glMatrixMode(GL_PROJECTION);
glLoadIdentity();
aspectRatio = (GLfloat)w / (GLfloat)h;
if (w <= h)
glOrtho(-5.0, 5.0, -5.0 / aspectRatio, 5.0 / aspectRatio, 1.0, -1.0);
else
glOrtho(-5.0 * aspectRatio, 5.0 * aspectRatio, -5.0, 5.0, 1.0, -1.0);
glMatrixMode(GL_MODELVIEW);
glLoadIdentity();
}
int main(int argc, char** argv)
{
glutInit(&argc, argv);
glutInitDisplayMode(GLUT_SINGLE | GLUT_RGB);
glutCreateWindow("DrawBezier Bline");
init();
glutDisplayFunc(RenderScence);
glutReshapeFunc(ChangeSize);
glutMainLoop();
return 0;
}
这两个代码我最终合并了,把另外一部分注释掉就能看到画bezier曲线的代码,而现在时画bline的代码
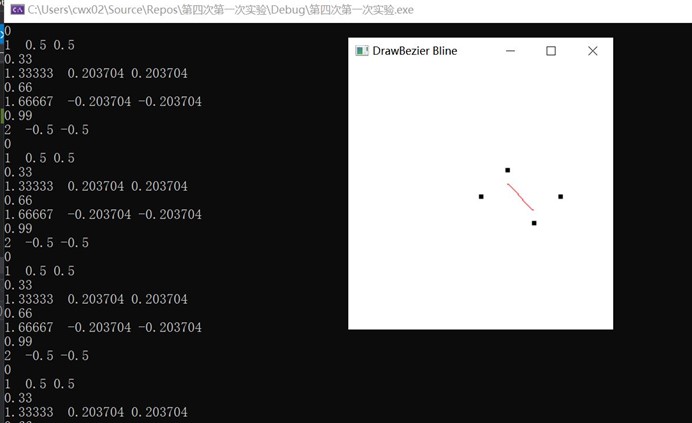
实验截图如下:
可以看到t=0时 (1,0.5,0.5) t=1/3时(1.33,0.203,0.203)
T=2/3的时候时(1.67,-0.203,-0.203) t=1的时候是(2,-0.5,-0.5)
- 绘制曲面(借鉴lec6课件)
1. 利用Bezier曲面构造茶壶的表面形状,定义控制点:
float ctrlpoints[4][4][3] = {
{ {-2, -1, 0}, { -2.0, -1.0, 4.0},
{ 2.0, -1.0, 4.0}, { 2, -1, 0} },
{ {-3, 0, 0}, { -3.0, 0, 6.0},
{ 3.0, 0, 6.0}, { 3, 0, 0}},
{ {-1.5, 0.5, 0}, {-1.5, 0.5, 3.0},
{1.5, 0.5, 3.0}, {1.5, 0.5, 0}},
{ {-2, 1, 0}, { -2.0, 1.0, 4.0},
{ 2.0, 1.0, 4.0}, { 2, 1, 0} }
};
OpenGL中Bezier曲面定义的函数为:
void glMap2{fd}(GLenum target,TYPE t1,TYPE t2,GLint tstride, GLint torder, TYPE s1,TYPE s2,GLint sstride, GLint sorder,const const TYPE *points);
函数的第一个参数target指出控制顶点的意义,如GL_MAP2_VERTEX_3表示生成顶点坐标三元组;参数points指针可以指向控制点集等; 参数t1和t2,指明变量t的范围,t一般从0变化到1;参数s1和s2,指明变量s的范围,s一般从0变化到1;参数tstride表示跨度,指定了控制点数组中t方向顶点之间的浮点值数量,即两个控制点间的偏移量,比如控制点集ctrlpoints[4][4][3]的跨度就为3;参数torder是次数加1,叫阶数,与控制点数一致;参数sstride表示跨度,指定了控制点数组中s方向顶点之间的浮点值数量,即两个控制点间的偏移量,比如控制点集ctrlpoints[4][4][3]的跨度就为12;参数sorder是次数加1,叫阶数,与控制点数一致。
曲线定义后,必须要启动,才能进行下一步的绘制工作。启动函数是glEnable(),其中参数与glMap2*()的第一个参数一致。
使用高层函数来定义网格:
void glMapGride2{fd}[v](GLint tn,TYPE t1,TYPE t2,GLint sn,TYPE s1,TYPE s2);
建立一个2D映射网格,tn和sn指定了t和s方向网格划分的数量。
使用点或直线计算网格:
void glEvalMesh2(GLenum mode,GLint t1,GLint t2,GLint s1,GLint s2);
计算2D点或直线的网格,mode指定网格应该被计算为点(GL_POINT)、直线(GL_LINE)或填充表面(GL_FILL)。
实验源程序如下:
#include<gl/glut.h>
float ctrlpoints[4][4][3] = {
{ {-2, -1, 0}, { -2.0, -1.0, 4.0},
{ 2.0, -1.0, 4.0}, { 2, -1, 0} },
{ {-3, 0, 0}, { -3.0, 0, 6.0},
{ 3.0, 0, 6.0}, { 3, 0, 0}},
{ {-1.5, 0.5, 0}, {-1.5, 0.5, 3.0},
{1.5, 0.5, 3.0}, {1.5, 0.5, 0}},
{ {-2, 1, 0}, { -2.0, 1.0, 4.0},
{ 2.0, 1.0, 4.0}, { 2, 1, 0} }
};
void init()
{
glClearColor(1.0, 1.0, 1.0, 1.0);
glMap2f(GL_MAP2_VERTEX_3, 0.0, 1.0, 3, 4, 0.0, 1.0, 12, 4, &ctrlpoints[0][0][0]);
glEnable(GL_MAP2_VERTEX_3);
glEnable(GL_DEPTH_TEST);
}
void DrawCurvedSurface(int n, int m)
{
int i, j;
glMapGrid2f(n, 0.0, 1.0, m, 0.0, 1.0);
glEvalMesh2(GL_LINE, 0, n, 0, m);
glPointSize(5.0);
glColor3f(0.0, 0.0, 0.0);
glBegin(GL_POINTS);
for (i = 0; i < 4; i++)
for (j = 0; j < 4; j++)
glVertex3f(ctrlpoints[i][j][0], ctrlpoints[i][j][1], ctrlpoints[i][j][2]);
glEnd();
}
void RenderScence()
{
glClear(GL_COLOR_BUFFER_BIT | GL_DEPTH_BUFFER_BIT);
glColor3f(1.0, 0.0, 0.0);
glPushMatrix();
glTranslated(0.0, 0.0, -8);
glRotatef(35.0, 1.0, 1.0, 1.0);
DrawCurvedSurface(30, 8);
glPopMatrix();
glFlush();
}
void ChangeSize(GLsizei w, GLsizei h)
{
GLfloat aspectRatio;
if (h == 0)
h = 1;
glViewport(0, 0, w, h);
glMatrixMode(GL_PROJECTION);
glLoadIdentity();
aspectRatio = (GLfloat)w / (GLfloat)h;
if (w <= h)
glOrtho(-5.0, 10.0, -5.0 / aspectRatio, 5.0 / aspectRatio, 10, -10.0);
else
glOrtho(-5.0 * aspectRatio, 5.0 * aspectRatio, -5.0, 5.0, 10.0, -10.0);
glMatrixMode(GL_MODELVIEW);
glLoadIdentity();
}
int main(int argc,char** argv)
{
glutInit(&argc, argv);
glutInitDisplayMode(GLUT_SINGLE | GLUT_RGB | GLUT_DEPTH);
glutCreateWindow("DrawBezier");
init();
glutDisplayFunc(RenderScence);
glutReshapeFunc(ChangeSize);
glutMainLoop();
return 0;
}
实验截图如下,可以看到一个茶壶面

- 其它
1. 将屏幕上的鼠标选取点作为多边形顶点进行填充。
这里我们主要实现鼠标响应函数
void mouse(GLint button, GLint action, GLint x, GLint y)//鼠标回调
{
if (button == GLUT_LEFT_BUTTON && action == GLUT_DOWN)
{
glutPostRedisplay();
mousecount++;
xx[mousecount] = x;//记录真正的x,y坐标
yy[mousecount] = winheight - y;
}
if (mousecount == 5)
{
mousecount = 0;
}
glFlush();
}
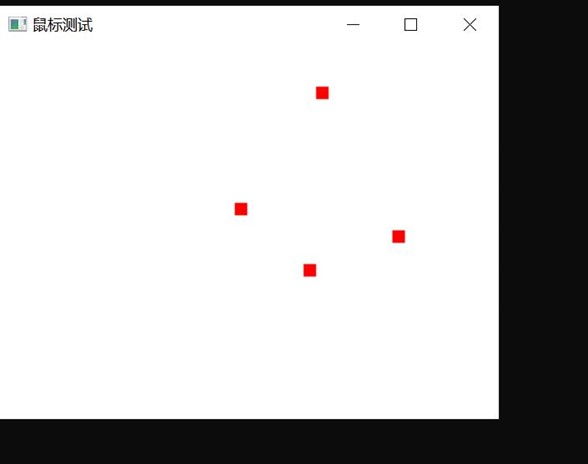
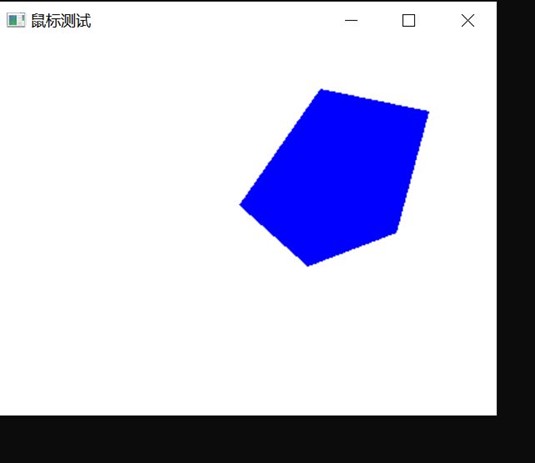
在程序中,我们可以看到,我每次点击五个点,都能在屏幕上相应位置点击一个红点,最后到第五个点的时候可以画一个蓝色的五边形,实验截图如下:
实验源程序如下:
#include <GL/glut.h>
GLsizei winwidth = 400, winheight = 300;
int mousecount = -1;//一开始的时候没有点
double xx[5];
double yy[5];
void init()
{
glClearColor(1, 1, 1, 0);
glMatrixMode(GL_PROJECTION);
gluOrtho2D(0, 200, 0, 150);
}
void display()
{
glClear(GL_COLOR_BUFFER_BIT);
glColor3f(1, 0, 0);//点是红色的
glPointSize(10);
if (mousecount != 4)//当点数到达5的时候就要画多边形
{
glBegin(GL_POINTS);
for (int i = 0; i <= mousecount; i++)
{
glVertex2i(xx[i], yy[i]);
}
glEnd();
}
else
{
glColor3f(0, 0, 1);//多边形是蓝色的
glBegin(GL_POLYGON);
for (int i = 0; i <= mousecount; i++)
{
glVertex2i(xx[i], yy[i]);
}
glEnd();
}
glFlush();
}
void ChangeSize(GLsizei w, GLsizei h)
{
glViewport(0, 0, w, h);
glMatrixMode(GL_PROJECTION);
glLoadIdentity();
gluOrtho2D(0, w, 0, h);
winwidth = w;
winheight = h;
}
void plotpoint(GLint x, GLint y)
{
glBegin(GL_POINTS);
glVertex2i(x, y);
glEnd();
}
void mouse(GLint button, GLint action, GLint x, GLint y)//鼠标回调
{
if (button == GLUT_LEFT_BUTTON && action == GLUT_DOWN)
{
glutPostRedisplay();
mousecount++;
xx[mousecount] = x;//记录真正的x,y坐标
yy[mousecount] = winheight - y;
}
if (mousecount == 5)
{
mousecount = 0;
}
glFlush();
}
int main(int argc, char** argv)
{
glutInit(&argc, argv);
glutInitDisplayMode(GLUT_SINGLE | GLUT_RGB);
glutInitWindowPosition(100, 100);
glutInitWindowSize(winwidth, winheight);
glutCreateWindow("鼠标测试");
init();
glutDisplayFunc(display);
glutReshapeFunc(ChangeSize);
glutMouseFunc(mouse);
glutMainLoop();
}

 浙公网安备 33010602011771号