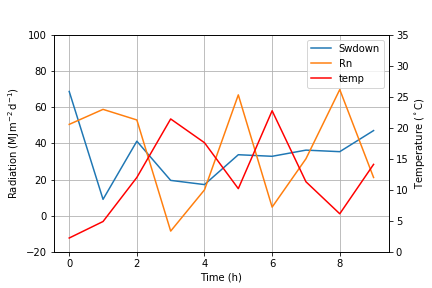
1.双y轴绘制 关键函数:twinx()
 # -*- coding: utf-8 -*-
 import numpy as np
 import matplotlib.pyplot as plt
 from matplotlib import rc
 rc('mathtext', default='regular')

 time = np.arange(10)
 temp = np.random.random(10)*30
 Swdown = np.random.random(10)*100-10
 Rn = np.random.random(10)*100-10

 fig = plt.figure()
 ax = fig.add_subplot(111)
 ax.plot(time, Swdown, '-', label = 'Swdown')
 ax.plot(time, Rn, '-', label = 'Rn')
 ax2 = ax.twinx()
 ax2.plot(time, temp, '-r', label = 'temp')
 ax.legend(loc=0)
 ax.grid()
 ax.set_xlabel("Time (h)")
 ax.set_ylabel(r"Radiation ($MJ\,m^{-2}\,d^{-1}$)")
 ax2.set_ylabel(r"Temperature ($^circ$C)")
 ax2.set_ylim(0, 35)
 ax.set_ylim(-20,100)
 ax2.legend(loc=0)
![]()
合并图例
# -*- coding: utf-8 -*-
 import numpy as np
 import matplotlib.pyplot as plt
 from matplotlib import rc
 rc('mathtext', default='regular')

 time = np.arange(10)
 temp = np.random.random(10)*30
 Swdown = np.random.random(10)*100-10
 Rn = np.random.random(10)*100-10


 fig = plt.figure()
 ax = fig.add_subplot(111)

 lns1 = ax.plot(time, Swdown, '-', label = 'Swdown')
 lns2 = ax.plot(time, Rn, '-', label = 'Rn')
 ax2 = ax.twinx()
 lns3 = ax2.plot(time, temp, '-r', label = 'temp')


 # added these three lines
 lns = lns1+lns2+lns3
 labs = [l.get_label() for l in lns]
 ax.legend(lns, labs, loc=0)


 ax.grid()
 ax.set_xlabel("Time (h)")
 ax.set_ylabel(r"Radiation ($MJ\,m^{-2}\,d^{-1}$)")
 ax2.set_ylabel(r"Temperature ($^circ$C)")
 ax2.set_ylim(0, 35)
 ax.set_ylim(-20,100)
![]()
 # -*- coding: utf-8 -*-
 import numpy as np
 import matplotlib.pyplot as plt

 x = np.linspace(0,10)
 y = np.linspace(0,10)
 z = np.sin(x/3)**2*98

 fig = plt.figure()
 ax = fig.add_subplot(111)
 ax.plot(x,y, '-', label = 'Quantity 1')

 ax2 = ax.twinx()
 ax2.plot(x,z, '-r', label = 'Quantity 2')
 fig.legend(loc=1, bbox_to_anchor=(1,1), bbox_transform=ax.transAxes)


 ax.set_xlabel("x [units]")
 ax.set_ylabel(r"Quantity 1")
 ax2.set_ylabel(r"Quantity 2")
![]()
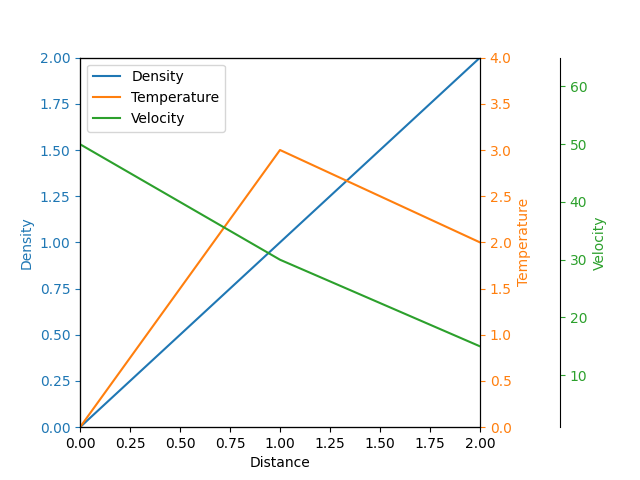
多Y轴图例
import matplotlib.pyplot as plt

fig, ax = plt.subplots()
fig.subplots_adjust(right=0.75)

twin1 = ax.twinx()
twin2 = ax.twinx()

# Offset the right spine of twin2.  The ticks and label have already been
# placed on the right by twinx above.
twin2.spines.right.set_position(("axes", 1.2))

p1, = ax.plot([0, 1, 2], [0, 1, 2], "C0", label="Density")
p2, = twin1.plot([0, 1, 2], [0, 3, 2], "C1", label="Temperature")
p3, = twin2.plot([0, 1, 2], [50, 30, 15], "C2", label="Velocity")

ax.set(xlim=(0, 2), ylim=(0, 2), xlabel="Distance", ylabel="Density")
twin1.set(ylim=(0, 4), ylabel="Temperature")
twin2.set(ylim=(1, 65), ylabel="Velocity")

ax.yaxis.label.set_color(p1.get_color())
twin1.yaxis.label.set_color(p2.get_color())
twin2.yaxis.label.set_color(p3.get_color())

ax.tick_params(axis='y', colors=p1.get_color())
twin1.tick_params(axis='y', colors=p2.get_color())
twin2.tick_params(axis='y', colors=p3.get_color())

ax.legend(handles=[p1, p2, p3])

plt.show()
![]()


 浙公网安备 33010602011771号