
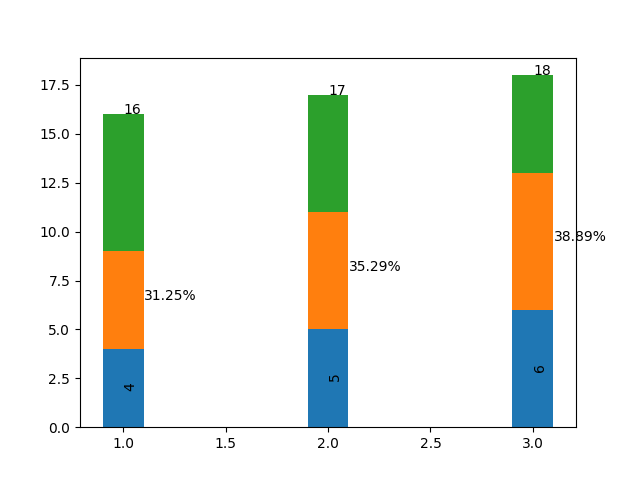
matplotlib柱状图形上添加文本
x = [1,2,3]
y1 = np.array([4,5,6])
y2 = np.array([5,6,7])
y3 = np.array([7,6,5])
width = 0.2
Sum = y1+y2+y3
per = 100*y2/Sum

#添加在中间,旋转90度
def add_mid(x,y,text):
	for x0,y0,text0 in zip(x,y,text):
		ax.text(x0,y0-y0/2,text0,rotation = 90)
#添加文本在图形顶部
def add_top(x,y,text):
	for x0,y0,text0 in zip(x,y,text):
		ax.text(x0,y0,text0)
#添加百分比
def add_per(x,y,text):
	for x0,y0,text0 in zip(x,y,text):
		ax.text(x0+width/2,y0,str(round(text0,2))+'%')

fig,ax =plt.subplots()
ax.bar(x,y1,width)
ax.bar(x,y2,width,bottom = y1)
ax.bar(x,y3,width,bottom = y1+y2)
#(x坐标,y坐标,文本)
add_mid(x,y1,y1)
add_top(x,Sum,Sum)
add_per(x,y1+y2/2,per)
plt.show()

 浙公网安备 33010602011771号