
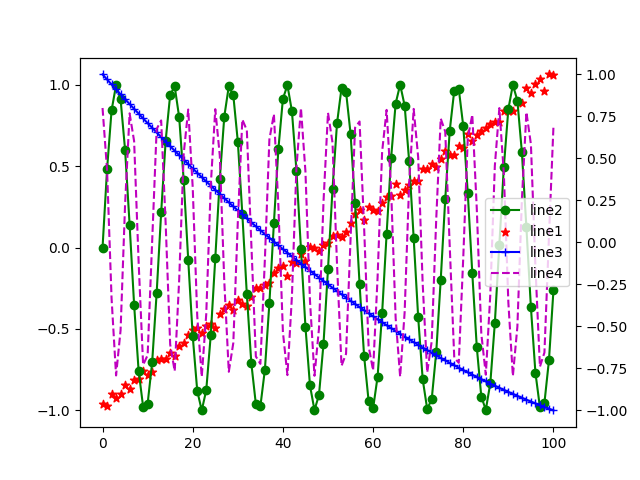
双Y轴图形Legend配置
        x = np.arange(0,101)
        wn = np.random.rand(101)
	y1 = -1+0.02*x+0.1*wn
	y2 = np.sin(0.5*x)
	y3 = 0.0001*x**2-0.03*x+1
	y4 = 0.8*np.cos(x)

	fig,ax1 = plt.subplots()
	ax1.scatter(x,y1,c='r',marker ='*',label = 'line1')
	ax1.plot(x,y2,'g-o',label = 'line2')

	ax2 = ax1.twinx()
	ax2.plot(x,y3,'b-+',label='line3')
	ax2.plot(x,y4,'m--',label='line4')

	lines1, labels1 = ax1.get_legend_handles_labels()
	lines2, labels2 = ax2.get_legend_handles_labels()
	ax2.legend(lines1 + lines2, labels1 + labels2, loc=0)

	plt.show()

 浙公网安备 33010602011771号