
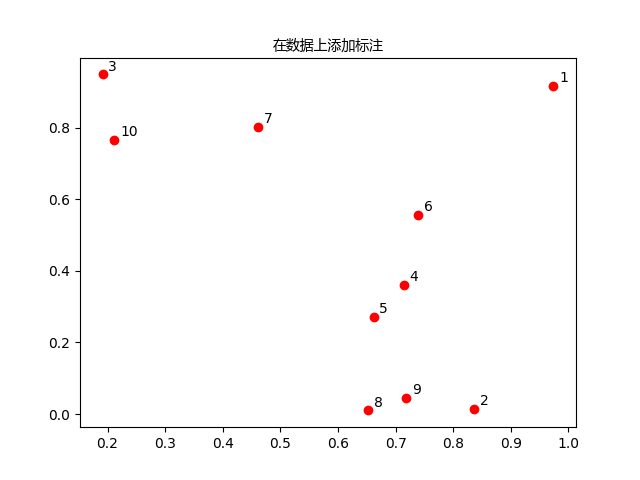
matplotlib 在数据上添加标注
x = np.random.random(10)

y = np.random.random(10)

note = np.arange(1,11)

plt.scatter(x,y,marker = 'o', c = 'r')
plt.title('在数据上添加标注',fontproperties='Microsoft YaHei')
for i in range(10):
	plt.annotate(note[i],xy = (x[i],y[i]),xytext = (x[i]+0.01,y[i]+0.01))
plt.show()

 浙公网安备 33010602011771号